Abstract
Classically, the basic concept of chemical synaptic transmission was established at the frog neuromuscular junction, and direct intracellular recordings from presynaptic terminals at the squid giant presynaptic terminal have further clarified principles of neurotransmitter release. More recently, whole-cell patch-camp recordings from the calyx of Held in rodent brainstem slices have extended the classical concept to mammalian synapses providing new insights into the mechanisms underlying strength and precision of neurotransmission and developmental changes therein. This review summarizes findings from our laboratory and others on these subjects, mainly at the calyx of Held, with a particular focus on precise, high-fidelity, fast neurotransmission. The mechanisms by which presynaptic terminals acquire strong, precise neurotransmission during postnatal development are also discussed.
Introduction
Since Sherrington introduced the term “synapse” for the neuro-neuronal nexus,1) the basic concept of chemical synaptic transmission has been established by electrophysiological studies at the frog neuromuscular junction (NMJ) as well as at the squid stellate ganglion giant synapse. At the frog NMJ, Ca2+-dependent neurotransmitter release2) and the quantal nature of neurotransmission3) were discovered. The latter finding led Katz to predict vesicular transmitter release.4) At the squid synapse, the biophysical nature of neurotransmission including the input-to-output correlation of electrical signals was clarified with simultaneous pre- and postsynaptic intracellular recordings,5),6) and molecular mechanisms of transmitter release7),8) were investigated by direct injections of pharmacological reagents into presynaptic terminals.
These pioneering studies of synaptic transmission were accomplished at visually identified presynaptic terminals, whereas investigations of neurotransmission in the mammalian central nervous system (CNS) were performed with blind microelectrode recordings from anesthetized animals.9) Attempts to visualize CNS neurons were made using cultured neurons10) and cerebellar slices.11) Intracellular recordings were then made from neurons visualized in thin slices of immature rat spinal cord (Fig. 1A).12) Later, patch-clamp techniques were applied to this thin slice preparation, thereby enabling stable recordings from neurons in various CNS regions (Fig. 1B),13) as well as at different postnatal developmental stages (Fig. 1C).14) This “slice-patch-clamp” method was subsequently applied to a giant presynaptic terminal, the calyx of Held, in auditory brainstem slices of rodents (Fig. 1D).15)–17) Hence, this giant synapse slice preparation has become a model mammalian synapse for investigating molecular and cellular mechanisms of neurotransmission. The large structure of the calyx of Held allows direct access to the presynaptic terminal with whole-cell patch pipettes, enabling researchers to load pharmacological tools or to manipulate intra-terminal ionic composition. It is also possible to measure intra-terminal Ca2+ concentration and its spatio-temporal profile (Fig. 1E).18) The calyx of Held is a typical, high-fidelity fast glutamatergic synapse, with strong synaptic efficacy and precise neurotransmission with synchronous transmitter release, contributing to sound localization by detecting inter-aural differences in sound intensity.19) Likewise, precise neurotransmission is essential for a wide range of fast synapses, such as those involved in coincidence detection for sensory cognition or Hebbian-type memory formation20),21) as well as for motor co-ordination.22),23) At the rodent calyx of Held, synaptic strength and precision are acquired during postnatal development, particularly during the second week when animals start to hear sound.24),25)

Quantal nature of transmitter release at a mammalian CNS synapse
The quantal nature of neurotransmitter release is clearly demonstrated at amphibian NMJ, where miniature end-plate potentials (mepps) represent unit postsynaptic responses to neurotransmitter3) released from single vesicles. However, it took a long time before the quantum release hypothesis was fully accepted for the mammalian CNS.26) This was mainly because multiple synaptic inputs to most CNS neurons made it difficult to confirm spontaneous miniature responses as units of nerve-evoked synaptic responses. Exceptionally, at the calyx of Held synapse, the postsynaptic neuron in the medial nucleus of the trapezoid body (MNTB) receives a single glutamatergic input from a globular bushy cell in the anterior ventral cochlear nucleus, allowing the quantum hypothesis to be tested.27) The amplitude distribution of spontaneous miniature excitatory postsynaptic currents (mEPSCs) recorded from MNTB neurons approximately fits a Gaussian distribution (Fig. 2). Depolarization of the presynaptic terminal increases mEPSC frequency, but has no effect on mEPSC amplitude, i.e., quantal size (Fig. 2A), as at the frog NMJ.28) In a low [Ca2+]/[Mg2+] bath solution, EPSC amplitude distribution is described by Poisson’s law as:
| \begin{equation*}
\text{P}(r) = (m^{\text{r}}/r!)\text{e}^{-m},
\end{equation*}
|
where P(
r) represents the probability that a presynaptic AP will induce release of
r (0,1,2,3…) quanta, and
m represents the mean number of quanta released in response to a presynaptic AP (
Fig. 2B). By definition,
m is given as the EPSC/mEPSC amplitude ratio provided that evoked transmitter release occurs synchronously, and from Poisson’s law as −ln (number of failures/number of stimulation trials).
3) These criteria all fit the calyx of Held, where multiples of the mEPSC amplitude account for peaks of the EPSC amplitude (
Fig. 2B).
Synaptic strength as a determinant of neuronal circuitry operation
At excitatory synapses, AP generation in postsynaptic neurons and ensuing propagation in neuronal circuitry is determined primarily by the EPSC amplitude, representing synaptic strength,
| \begin{equation*}
I = Npq
\end{equation*}
|
where
N,
p, and
q represent the number of release sites (or readily releasable vesicles), mean release probability, and quantal size, respectively.
3) At excitatory synapses, strength of synaptic transmission represented by
Npq plays pivotal roles in functional operation of neuronal circuitries. When
Npq does not reach the AP threshold in a postsynaptic neuron, electrical signals stop there, whereas supra-threshold
Npq generates APs that propagate down into their axon terminals. In this regard, short- and long-lasting changes in synaptic strength are thought to underlie different lengths of memory formation and cancellation, whereas its irreversible decline may underlie various neuronal diseases. The mechanisms determining
N and
p reside in presynaptic terminals, whereas
q is determined by both presynaptic and postsynaptic factors,
i.e., vesicular transmitter content and postsynaptic receptor density. It is of fundamental importance to clarify molecular mechanisms underlying
N,
p,
q and to identify which of these parameters can be targeted by signaling molecules.
Determinants of quantal size, q
It has long been believed that a quantal packet of transmitter saturates postsynaptic receptors at the CNS synapse. This is based on the finding that “quantal size”, deduced from deconvolution of nerve-evoked synaptic responses, has a small (e.g., 0.1) coefficient of variation (CV), comparable to that of background noise.29)–31) The saturation hypothesis was supported by the prediction from a calculation that vesicular transmitter content largely exceeds the number of postsynaptic receptors activated by each transmitter packet.32) However, later studies found much larger CVs for “quantal size”, deduced from synaptic currents by lowering p at various synapses in CNS slices.33)–36) If quantal transmitter release saturates postsynaptic receptors, the quantal size, q, is determined predominantly by postsynaptic receptor density. By contrast, if it does not, vesicular transmitter content also determines q. A direct test of this alternative hypothesis was made at the calyx of Held, where the concentration of the neurotransmitter glutamate in the presynaptic terminal cytosol can be manipulated with a whole-cell patch pipette. Whole-cell dialysis of calyceal terminals with glutamate-free solution decreases the amplitude of EPSCs because of time-dependent glutamate leakage out of vesicles and a use-dependent increase in the number of empty vesicles after recycling (Fig. 3A). If vesicular glutamate normally saturates postsynaptic AMPA receptors, glutamate overloading into vesicles will not further increase the amplitude of mEPSCs (q) or evoked EPSCs (I). When high concentrations of glutamate were loaded into presynaptic terminals with a patch pipette, both mEPSC and EPSC amplitudes significantly increased (Fig. 3B), indicating that neither single nor multiple packets of transmitter normally saturate postsynaptic AMPA receptors.37)

After exocytic release of transmitter, vesicles are retrieved by endocytosis and refilled with transmitter to be reused for another round of neurotransmission (Fig. 3C). Refilling of vesicles with glutamate is mediated by vesicular glutamate transporters (VGLUTs),38) which actively transport glutamate from presynaptic cytosol (3–5 mM) into vesicles (80–100 mM) using an electrochemical gradient produced by the proton pump vacuolar ATPase (Fig. 3C). Glutamate uptake into isolated vesicles in vitro takes tens of minutes,39),40) which is far too slow to account for the time required for vesicle reuse at synapses (∼40 s).41) The time needed to refill vesicles with glutamate can be measured in the calyx nerve terminal, first by reducing vesicular glutamate using a glutamate-free pipette solution and then abruptly increasing glutamate concentration using UV photolysis of caged MNI-glutamate (Fig. 3D).42) As vesicles refill with glutamate, the EPSC amplitude recovers due to vesicle refilling with glutamate. The time constant of vesicular glutamate refilling estimated from the EPSC recovery time is 15 s at room temperature with a Q10 of 2.4, implying that full refilling takes nearly 1 min. Thus, vesicle refilling in intact presynaptic terminals is much faster than that in vitro, but it still is a rate-limiting step for vesicle reuse. The vesicle refilling time constant estimated at glutamatergic presynaptic terminals constrains the physiological role of fast vesicle endocytosis and recycling, characterized as “kiss and run”43) or “ultrafast endocytosis”.44)
Regulatory mechanisms underlying the release probability p
Modulation of the transmitter release probability, p, is a common presynaptic mechanism for regulating synaptic strength. In the nerve terminal, there are three main targets that can be involved in regulation of p. One of these is the release machinery comprising soluble N-ethylmaleimide-sensitive factor activating protein receptors (SNAREs). Botulinum toxin A and E inhibit the target (t)-SNARE SNAP-25, and tetanus toxin blocks the vesicular (v)-SNARE synaptobrevin, thereby inhibiting transmitter release. Another target in the presynaptic terminal is the voltage-gated K+ channel. Its activation hyperpolarizes terminals, thereby deactivating voltage-gated Ca2+ channels (VGCCs) to reduce transmitter release.45) Drugs such as cyclothiazide46) or 4-chloro-m-cresol,47) or some lipid mediators48) inhibit voltage-gated K+ channels, thereby increasing p. VGCCs are often coupled to GTP-binding protein-coupled receptors (GPCRs), and probably the most common presynaptic target for signaling molecules that have been studied to date. When a ligand binds to a GPCR, the GPCR βγ subunit is dissociated from the α subunit and directly blocks VGCCs from inside, in a so-called membrane-delimited manner. This type of VGCC inhibition can be reproduced by direct loading of βγ subunits into the calyx of Held terminal.49) Immature calyx of Held terminals express a variety of GPCRs, including metabotropic glutamate receptors, GABAB receptors, adenosine A1 receptors, and 5-hydroxytryptophan 1B receptors, all of which inhibit VGCCs via the GPCR βγ subunit, thereby lowering transmitter release probability.50)
During repetitive activation, presynaptic VGCCs at the calyx of Held undergo facilitation followed by inactivation (Fig. 4A).51) This activity-dependent VGCC facilitation depends upon Ca2+ entry that triggers acceleration of channel gating.52),53) The VGCC facilitation is mediated by the Ca2+-binding protein neuronal calcium sensor 1 (NCS-1)54) and/or calmodulin.55) Synaptic facilitation is caused by residual Ca2+ from the initial entry,56) and simple summation of residual Ca2+ and the Ca2+ influx during the subsequent pulse have been thought to cause synaptic facilitation. At the calyx of Held, this direct contribution of residual Ca2+ to synaptic facilitation is estimated at 30%.57) In addition, 50% of the paired-pulse EPSC facilitation (at a 5 ms inter-pulse interval, Fig. 4B) can be explained by VGCC facilitation caused by residual Ca2+.58),59) At cerebellar inhibitory synapses, VGCC facilitation almost fully accounts for synaptic facilitation (Shinya Kawaguchi, personal communication). Another mechanism postulated for synaptic facilitation is a transient saturation of endogenous fixed Ca2+ buffer by Ca2+ on the first entry, causing a greater Ca2+ concentration rise in the second Ca2+ entry.57) Thus, VGCC facilitation downstream of residual Ca2+ is an important mechanism underlying synaptic facilitation. VGCC facilitation is a unique feature of CaV2.1 (P/Q-type).55),60),61) In mice with their CaV2.1 genetically ablated, CaV2.2 (N-type) dominates calyx synaptic transmission (Fig. 4C).60),61) In these mice, repetitive stimulation causes VGCC inactivation with no facilitation. VGCC inactivation contributes to short-term synaptic depression during sustained stimulation.51),60)

Maintenance of readily releasable vesicle numbers, N
After exocytic fusion, synaptic vesicles are retrieved by endocytosis into nerve terminals, refilled with neurotransmitter and reused (Fig. 3C). This vesicle recycling process comprises two important steps, endocytosis and trafficking. Vesicle endocytosis requires GTP hydrolysis by the GTP-binding protein dynamin, which participate in fission of the nerve terminal plasma membrane to reform vesicles. The non-hydrolysable GTP analog GTPγS, when loaded into calyceal terminals, blocks vesicle endocytosis (Fig. 5B),62) as assessed from membrane capacitance measurements (Fig. 5A). GTPγS has no immediate effect on exocytosis, but gradually attenuates exocytosis as stimulation proceeds, and eventually abolishes it (Fig. 5B), due to a lack of vesicle recycling. Thus, endocytic block secondarily blocks exocytosis. Another mechanism postulated for the block of exocytosis following endocytic block is a jammed pathway from a release site to an endocytic site. This type of block reportedly occurs shortly after high frequency stimulation.63)

It is well established that exocytic transmitter release is triggered by Ca2+. Although the dependence of vesicle endocytosis upon Ca2+ was controversial, recent findings at immature calyces of Held support the model of Ca2+ dependence. Ca2+-chelating agents (EGTA or BAPTA) loaded into the calyx terminal attenuate endocytic capacitance changes (Fig. 5C).64)–66) Thus, both exocytosis and endocytosis of synaptic vesicles depend upon cytosolic [Ca2+] in the nerve terminal.
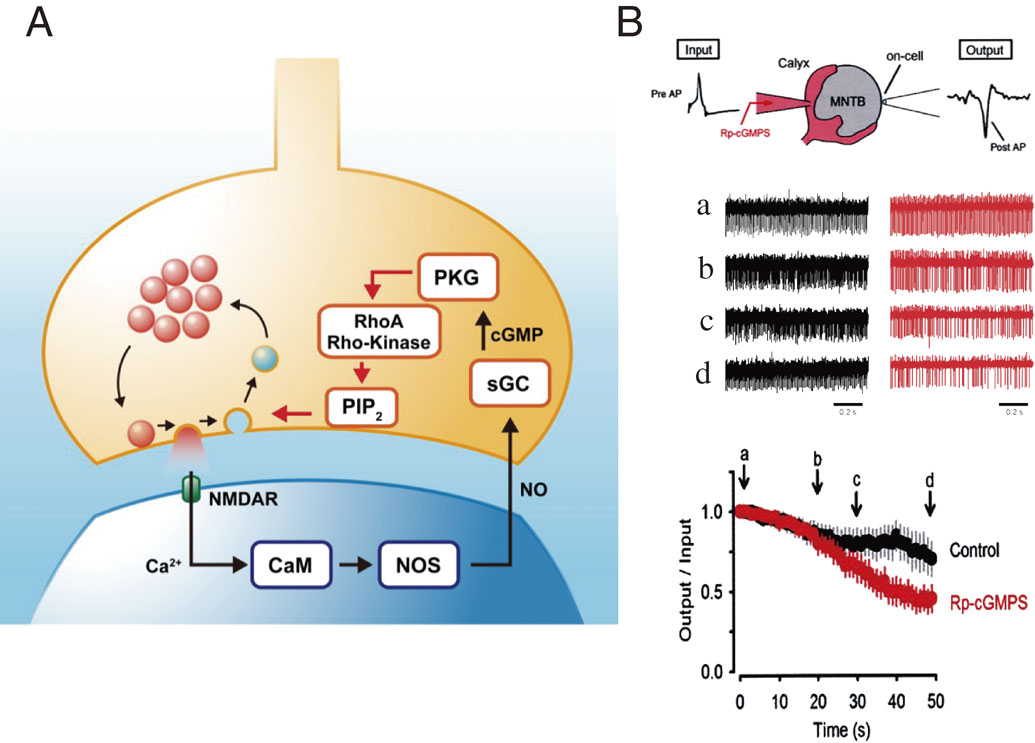
A balance between the rates of exocytosis and endocytosis is essential for maintaining terminal membrane area and vesicle number. This balance is achieved in part by Ca2+ entry, which simultaneously accelerates both exo- and endocytosis. In addition, there is an activity-dependent mechanism for exo-endocytic balancing. During high-frequency stimulation, vesicles undergo massive recycling. At the calyx of Held, glutamate released by exocytosis activates postsynaptic NMDA receptors, and ensuing postsynaptic Ca2+ entry stimulates NO synthesis.67) Gaseous NO released from postsynaptic neurons enters presynaptic terminals and stimulates soluble guanylyl cyclase,68) thereby increasing cyclic GMP concentration. Protein kinase G (PKG) activated by cyclic GMP activates the G-protein RhoA, thereby activating Rho kinase.69) Rho kinase up-regulates phosphatidylinositol-4,5-bisphosphate (PIP2) synthesis in the terminal membrane, thereby accelerating vesicle endocytosis (Fig. 6A).68) In this cascade, endocytosis is accelerated in proportion to the rate of exocytosis. A similar feedback cascade also operates at hippocampal synapses in culture,70) suggesting that this is likely a general homeostatic mechanism for the maintenance of high frequency neurotransmission. In fact, a PKG inhibitor, when loaded into the presynaptic terminal, slows endocytic capacitance change and also reduces synaptic fidelity during sustained high-frequency transmission (Fig. 6B).68)
Mechanisms underlying the precision of neurotransmission
Together with synaptic strength, synaptic precision is an important parameter for fast synaptic transmission. Precisely timed AP generations at postsynaptic neurons require synchronous transmitter release. Thus, synaptic precision is defined as the rate of transmitter release that can be estimated by deconvolution of AP-evoked EPSCs with quantal EPSCs.71) The coupling distance between VGCCs and release-ready (primed) vesicles influence vesicle release probability, as well as speed and synchronicity of transmitter release. Recently, freeze fracture replica immunogold labeling of Cav2.1 revealed that VGCCs are distributed in clusters at the calyx of Held (Fig. 7A),72) as well as at hippocampal73) presynaptic terminals. Among Ca2+-chelating agents, EGTA has a relatively slow binding on-rate (107 M−1 s−1);74) therefore it is used as a tool to assess coupling distances between Ca2+ sources and sensors. At the calyx of Held in slices from P14 rats, intra-terminal loading of 10 mM EGTA by pipette perfusion attenuates EPSC amplitude by 56% (Fig. 7B). This EGTA sensitivity constrains primed vesicles outside of VGCC clusters (Fig. 7C). Coupling distance between a VGCC cluster and a vesicle is then defined most properly as the distance between a vesicle and the perimeter, rather than the center, of a VGCC cluster (Fig. 7D). With this topography and definition, and the percentage inhibition by EGTA of EPSC amplitude, by taking into account the endogenous fixed buffer strength and kinetics, as well as the stochastic nature of VGCC opening in response to an AP, the “perimeter coupling distance” can be estimated by simulation at 11–19 nm with 1–64 VGCCs per cluster. The relatively narrow range of coupling distance, compared with the broad variation in assumed VGCC number, arises from the fact that coupling distance is measured from the perimeter, instead of the center of a VGCC cluster. As the vesicle release probability p strongly depends on the number of VGCCs per cluster (Fig. 7D), this model predicts that synaptic precision is determined by the “perimeter coupling distance” independently of the synaptic strength parameter, p. This explains variable synaptic characters and their developmental changes (see below).

Postnatal developmental changes in synaptic strength and precision
Strength and precision of neurotransmission, which support accurate brain functions, are acquired during postnatal development. Activity-dependent VGCC facilitation underlying synaptic facilitation (Fig. 4) reflects the nature of P/Q-type Ca2+ channels (Cav2.1). In the early postnatal period, multiple types of VGCCs including N-type (Cav2.2), P/Q-type and R-type (Cav2.3) channels mediate transmitter release in presynaptic terminals in various CNS regions (Fig. 8A).75) As animals mature, N- and R-type channels are down-regulated in nerve terminals and synaptic transmission becomes predominantly mediated by P/Q-type channels at major excitatory and inhibitory synapses with relatively strong synaptic efficacy, such as the calyx of Held synapse, the inhibitory synapse from cerebellar Purkinje cells to deep cerebellar nuclear (DCN) cells, and the reticulo-thalamic inhibitory synapse (Fig. 8B).76) This developmental switching strengthens synaptic efficacy, particularly in response to high frequency inputs, because of the facilitatory nature of P/Q-type channels (Fig. 4). Interestingly, this VGCC subtype exchange occurs specifically in the nerve terminal, with no change in the cell body.77),78) Thus, the developmental switch is caused by cellular sorting of VGCC subtypes in nerve terminals rather than direct de novo synthesis in cell somata. The responsible mechanism was further pursued using cerebellar slices in culture.78) In this slice culture, Purkinje cells (PCs) and DCN cells can be visually identified and IPSCs can be evoked in DCN cells in response to extracellular stimulation of PC axons. During early culture stages, IPSCs are blocked by both the N-type specific blocker, ω-conotoxin GVIA, and the P/Q-type specific blocker, ω-agatoxin IVA, but IPSCs gradually become resistant to ω-conotoxin with time. Thus, the slice culture system replicates the postnatal N-to-P/Q type channel switch at cerebellar PC-DCN synapses (Fig. 8C). At 12–14 days in vitro (DIV), the N-type channel fraction of IPSCs is reduced to 14% (Fig. 8D). This fraction can be reduced further to 1.4% when neuronal activity during culture is enhanced with the GABAA receptor blocker bicuculline. In contrast, block of neuronal activity with tetrodotoxin (TTX) increases the N-type fraction to 87%. This TTX effect can be reproduced in vivo by chronically infusing TTX into pup cerebella.78) Thus, during postnatal development, increasing neuronal activity down-regulates presynaptic N-type channels. How does it accomplish this? It is suggested that the neurotrophin receptor TrkB is involved because the TrkB ligand BDNF or NT4 applied to culture media specifically counteracts the up-regulatory effect of TTX on N-type channels, whereas the TrkA ligand NGF or the TrkC ligand NT3 has no such effect (Fig. 8D). BDNF and/or NT4 released from cerebellar neurons in response to APs may bind to TrkB, thereby inducing the N-to-P/Q-type channel switch in developing nerve terminals. Consistent with the Ca2+-dependent release of neurotrophins, low [Ca2+]/high [Mg2+] culture media increases the N-type channel fraction like TTX. The molecular mechanism downstream of TrkB, causing VGCC subtype sorting, remains to be clarified.

During the second postnatal week, at the calyx of Held in rodents, synaptic strength remains similar in response to low frequency inputs, but it increases to high frequency inputs (Fig. 9A).79) This is because of reciprocal changes in parameters p and N during development; p decreases, but N increases, both 2-fold.79),80) Thus, as animals mature, a smaller fraction of the larger vesicle pool is consumed in response to a presynaptic AP. The main cause of the developmental decrease in p is the presynaptic AP duration, which is shortened 2-fold from P7 to P14 (Fig. 9B),81),82) thereby decreasing the resulting Ca2+ influx.72) This developmental shortening of AP duration is caused mainly by an increase in the density of voltage-gated potassium channels and acceleration in their gating kinetics (Fig. 9B).82)

Developmental changes in quantal parameters are directed toward an increase in synaptic strength, particularly for high frequency synaptic transmission. Developmental changes are also directed toward an increase in synaptic precision. Shortening of presynaptic AP duration reduces the synaptic delay, the time from AP to transmitter release.72) Furthermore, a numerical simulation constrained by EGTA infusion experiments indicates that the coupling distance from the perimeter of VGCC cluster to the vesicular Ca2+ sensor shortens by ∼10 nm from P7 to P14 in the calyx of Held (Fig. 9C) (Fig. 7B).72) Together with AP acceleration, reduction of the coupling distance shortens the synaptic delay by 0.4 ms. Developmental shortening of the coupling distance also enhances synchrony of transmitter release, with the duration of the 50% release rate diminishing by 0.2 ms (Fig. 9C). Thus, both synaptic strength and precision increase as animals mature.
To maintain high-frequency synaptic transmission with high fidelity, vesicular endocytosis is coupled to exocytosis using Ca2+ (Fig. 5). As animals mature, at P14 calyces, vesicle endocytosis is no longer attenuated by 10 mM EGTA or 1 mM BAPTA (Fig. 9D, cf. Fig. 5C), whereas it is blocked by 10 mM BAPTA.66) Thus, the Ca2+ domain that primes endocytosis is narrowed during development. The molecular mechanism determining coupling distances between VGCC clusters and vesicles undergoing exocytosis or endocytosis remains unknown. Another regulatory mechanism for balancing exo-endocytosis is the PKG-dependent retrograde feedback mechanism (Fig. 6). This mechanism is acquired during postnatal development. Endocytosis following exocytosis evoked by a 20 ms depolarizing pulse is relatively slow at P7, with the PKG inhibitor having no effect, but it becomes faster by P14 (Fig. 9E). In the presence of the PKG inhibitor, endocytic time course at P14 is similar to that at P7. Consistently, PKG expression in the calyx terminal increases significantly from P7 to P14. Thus, endocytosis is accelerated during development by initiating the PKG-dependent retrograde feedback cascade.68)
Future scope
In Drosophila,83) C. elegans84) and mice, genetic techniques elucidated various roles of synaptic molecules. However, there are many more molecules of unknown function in presynaptic terminals. Conditional gene manipulation techniques85) combined with presynaptic functional analysis, will provide new insights into their roles. Another powerful approach in this regard will be shRNA knockdown techniques that have been applied to a recently developed giant presynaptic terminal in dissociated neuronal culture (unpublished observations). A giant presynaptic terminal culture preparation will also facilitate real-time imaging of vesicle dynamics and presynaptic molecular interactions correlated with presynaptic functions.
Among many presynaptic molecules, overexpression of α-synuclein is associated with Parkinson’s disease.86) The microtubule-binding tau protein, which localizes in axons and axon terminals, is found at 8-fold higher concentrations, in phosphorylated form, in brain homogenates from Alzheimer’s patients.87) Neurons derived from iPS cell lines from psychiatric patients express mutated psychiatric disorder related protein, Disrupted-in-Schizophrenia 1 (DISC1) and vesicular transmitter release at glutamatergic synapses is impaired.88) Thus, the nerve terminal may be the initiation site for various neuronal diseases. In this respect, clarification of presynaptic molecular interactions and cascades for the maintenance of neurotransmission is essential for both scientific and clinical reasons.
Profile

Tomoyuki Takahashi was born in 1944. He graduated from Tokyo Medical and Dental University Medical School, and then from Graduate School of Medicine. He obtained Ph.D. in 1975 for his work on the sensory neurotransmitter substance P in cat spinal cord (supervised by Masanori Otsuka), and became an assistant professor in the same university. In 1977, he became a postdoctoral fellow of Bernard Katz at the Biophysics Department in University College London, and worked with Ricardo Miledi on calcium transients in skeletal muscles. In 1980, he became a visiting associate professor at the laboratory of Shigehiro Nakajima in Purdue University, and studied structural-functional relationships during the active zone formation in cultured Xenopus neuromuscular junction. In 1981, he became an assistant professor, and later a lecturer, in Kyoto University Medical School, in the laboratory of Motoy Kuno, and collaborated with the group of Shosaku Numa on cloned acetylcholine receptors and sodium channels expressed in Xenopus oocytes. Thereafter, he collaborated with Bert Sakmann in Max-Planck Institute Goettingen, and developed the brain slice patch-clamp method. In 1993, he became a professor in the University of Tokyo, where he established simultaneous pre- and postsynaptic recording method from rodent calyx of Held, in collaboration with Ian Forsythe. Since then, his research has been focused on mechanisms of presynaptic functions. In 2007, after retirement from the University of Tokyo, he became a professor in Doshisha University, Faculty of Life and Medical Sciences. In 2014, he retired from Doshisha University and became a distinguished professor in Okinawa Institute of Science and Technology. Further to address functional and pathologic roles of presynaptic molecules, he has recently developed a cultured calyx synapse preparation, where patch clamp recording and real time imaging can be made in parallel from presynaptic terminals after molecular/genetic manipulations.
Acknowledgments
I thank Takeshi Sakaba for comments and Steven Aird for editing the paper.
References
- 1) Sherrington, C. (1906) The Integrative Action of the Nervous System. Yale Univ. Press, New Haven.
- 2) Katz, B. and Miledi, R. (1967) The timing of calcium action during neuromuscular transmission. J. Physiol. 189, 535–544.
- 3) Del Castillo, J. and Katz, B. (1954) Quantal components of the end-plate potential. J. Physiol. 124, 560–573.
- 4) Katz, B. (1969) The Release of Neural Transmitter Substances. The Sherrington Lectures X, Liverpool Univ. Press, Liverpool.
- 5) Hagiwara, S. and Tasaki, I. (1958) A study on the mechanism of impulse transmission across the gian synapse of the squid. J. Physiol. 143, 114–137.
- 6) Takeuchi, A. and Takeuchi, N. (1962) Electrical changes in pre- and postsynaptic axons of the giant synapse of Loligo. J. Gen. Physiol. 45, 1181–1193.
- 7) Llinas, R., McGuinness, T.L., Leonard, C.S., Sugimori, M. and Greengard, P. (1985) Intraterminal injection of synapsin I or calcium/calmodulin-dependent protein kinase II alters neurotransmitter release at the squid giant synapse. Proc. Natl. Acad. Sci. U.S.A. 82, 3035–3039.
- 8) Augustine, G.J., Burns, M.E., DeBello, W.M., Pettit, D.L. and Schweizer, F.E. (1996) Exocytosis: Proteins and perturbations. Annu. Rev. Pharmacol. Toxicol. 36, 659–701.
- 9) Eccles, J.C. (1964) The Physiology of Synapses. Springer Verlag, Berlin.
- 10) Nelson, P.G. (1976) Central Nervous system synapses in cell culture. Cold Spring Harb. Symp. Quant. Biol. 40, 359–371.
- 11) Yamamoto, C. (1975) Recording of electrical activity from microscopically identified neurons of the mammalian brain. Exprientia 31, 309–310.
- 12) Takahashi, T. (1978) Intracellular recording from visually identified motoneurons in rat spinal cord slices. Proc. R. Soc. Lond., B 202, 417–421.
- 13) Edwards, F.A., Konnerth, A., Sakmann, B. and Takahashi, T. (1989) A thin slice preparation for patch clamp recordings from neurones of the mammalian central nervous system. Pflugers Arch. 414, 600–612.
- 14) Takahashi, T., Momiyama, A., Hirai, K., Hishinuma, F. and Akagi, H. (1992) Functional correlation of fetal and adult forms of glycine receptors with developmental changes in inhibitory synaptic receptor channels. Neuron 9, 1155–1161.
- 15) Forsythe, I.D. (1994) Direct patch recording from identified presynaptic terminals mediating glutamatergic EPSCs in the rat CNS, in vitro. J. Physiol. 479, 381–387.
- 16) Borst, J.G.G., Helmchen, F. and Sakmann, B. (1995) Pre- and postsynaptic whole-cell recordings in the medial nucleus of the trapezoid body of the rat. J. Physiol. 489, 825–840.
- 17) Takahashi, T., Forsythe, I.D., Tsujimoto, T., Barnes-Davies, M. and Onodera, K. (1996) Presynaptic calcium current modulation by a metabotropic glutamate receptor. Science 274, 594–597.
- 18) Nakamura, Y., Harada, H., Kamasawa, N., Matsui, K., Rothman, J.S., Shigemoto, R., Silver, R.A., DiGregorio, D.A. and Takahashi, T. (2015) Nanoscale distribution of presynaptic Ca2+ channels and its impact on vesicular release during development. Neuron 85, 145–158.
- 19) Oertel, D. (1997) Encoding of timing in the brain stem auditory nuclei of vertebrates. Neuron 19, 959–962.
- 20) Konig, P., Engel, A.K. and Singer, W. (1996) Integrator or coincidence detector? The role of the cortical neuron revisited. Trends Neurosci. 19, 130–137.
- 21) Sabatini, B.L. and Regehr, W.G. (1999) Timing of synaptic transmission. Annu. Rev. Physiol. 61, 521–542.
- 22) Sugihara, I., Lang, E.J. and Llinas, R. (1993) Uniform olivocerebellar conduction time underlies Purkinje cell complex spikes synchronicity in the rat cerebellum. J. Physiol. 470, 243–271.
- 23) Ritzau-Jost, A., Delvendahl, I., Rings, A., Byczkowicz, N., Harada, H., Shigemoto, R., Hirringer, J., Eilers, J. and Hallermann, S. (2014) Ultrafast action potentials mediate kilohertz signaling at a central synapse. Neuron 84, 152–163.
- 24) Kikuchi, K. and Hilding, D. (1965) The development of the organ of corti in the mouse. Acta Otolaryngol. 60, 207–222.
- 25) Jewett, D.L. and Romano, M.N. (1972) Neonatal development of auditory synaptic potentials averaged from the scalp of rat and cat. Brain Res. 36, 101–115.
- 26) Kuno, M. (1995) The Synapse: Function, Plasticity and Neurotrophism. Oxford Univ. Press, Oxford.
- 27) Sahara, Y. and Takahashi, T. (2001) Quantal components of the excitatory postsynaptic currents at a rat central auditory synapse. J. Physiol. 536, 180–197.
- 28) Del Castillo, J. and Katz, B. (1954) Changes in end-plate activity produced by pre-synaptic polarization. J. Physiol. 124, 586–604.
- 29) Jack, J.J.B., Redman, S.J. and Wong, K. (1981) The components of synaptic potentials evoked in cat spinal motoneurones by impulses in single group Ia afferents. J. Physiol. 321, 65–96.
- 30) Larkman, A., Stratford, K. and Jack, J. (1991) Quantal analysis of excitatory synaptic action and depression in hippocampal slices. Nature 350, 344–347.
- 31) Jonas, P., Major, G. and Sakmann, B. (1993) Quantal components of unitary EPSCs at the mossy fibre synapse on CA3 pyramidal cells of rat hippocampus. J. Physiol. 472, 615–663.
- 32) Frerking, M. and Wilson, M. (1996) Saturation of postsynaptic receptors at central synapses? Curr. Opin. Neurobiol. 6, 395–403.
- 33) Takahashi, T. (1992) The minimal inhibitory synaptic currents evoked in neonatal rat motoneurones. J. Physiol. 450, 593–611.
- 34) Silver, R.A., Cull-Candy, S.G. and Takahashi, T. (1996) Non-NMDA glutamate receptor occupancy and open probability at a rat cerebellar synapse with single and multiple release sites. J. Physiol. 494, 231–250.
- 35) Liu, G., Choi, S. and Tsien, R.W. (1999) Variability of neurotransmitter concentration and nonsaturation of postsynaptic AMPA receptors at synapses in hippocampal cultures and slices. Neuron 22, 395–409.
- 36) McAllister, A.K. and Stevens, C.F. (2000) Nonsaturation of AMPA and NMDA receptors at hippocampal synapses. Proc. Natl. Acad. Sci. U.S.A. 97, 6173–6178.
- 37) Ishikawa, T., Sahara, Y. and Takahashi, T. (2002) A single packet of transmitter does not saturate postsynaptic glutamate receptors. Neuron 34, 613–621.
- 38) Takamori, S., Rhee, J.S., Rosenmund, C. and Jahn, R. (2000) Identification of a vesicular glutamate transporter that defines a glutamatergic phenotype in neurons. Nature 407, 189–194.
- 39) Maycox, P.R., Deckwerth, T., Hell, J.W. and Jahn, R. (1988) Glutamate uptake by brain synaptic vesicles. Energy dependence of transport and functional reconstitution in proteoliposomes. J. Biol. Chem. 263, 15423–15428.
- 40) Wilson, N.R., Kang, J., Hueske, E.V., Leung, T., Varoqui, H., Murnick, J.G., Erickson, J.D. and Liu, G. (2005) Presynaptic regulation of quantal size by the glutamate transporter VGLUT1. J. Neurosci. 25, 6221–6234.
- 41) Liu, G. and Tsien, R.W. (1995) Properties of synaptic transmission at single hippocampal synaptic boutons. Nature 375, 404–408.
- 42) Hori, T. and Takahashi, T. (2012) Kinetics of synaptic vesicle refilling with neurotransmitter glutamate. Neuron 76, 511–517.
- 43) Harata, N., Pyle, J.L., Arvanis, A.M., Mozhayeva, M., Kavalali, E.T. and Tsien, R.W. (2001) Limited numbers of recycling vesicles in small CNS nerve terminals: implication for neural signaling and vesiclular cycling. Trends Neurosci. 24, 637–643.
- 44) Watanabe, S., Rost, B.R., Camacho-Perez, M., Davis, M.W., Sohl-Kielczynski, B., Rosenmund, C. and Jorgensen, E.M. (2013) Ultrafast endocytosis at mouse hippocampal synapses. Nature 504, 242–247.
- 45) Katz, B. and Miledi, R. (1969) Tetrodotoxin-resistant electric activity in presynaptic terminals. J. Physiol. 203, 459–487.
- 46) Ishikawa, T. and Takahashi, T. (2001) Mechanisms underlying presynaptic facilitatory effect of cyclothiazide at the calyx of Held of juvenile rats. J. Physiol. 533, 423–431.
- 47) Suzuki, D., Hori, T., Saitoh, N. and Takahashi, T. (2007) 4-Cloro-m-cresol, an activator of ryanodine receptors, inhibits voltage-gated K channels at the rat calyx of Held. Eur. J. Neurosci. 26, 1530–1536.
- 48) Carta, M., Lanore, F., Rebola, N., Szabo, Z., Da Silva, S.V., Lourenco, J., Verraes, A., Nadler, A., Schultz, C., Blanchet, C. and Mulle, C. (2014) Membrane lipids tune synaptic transmission by direct modulation of presynaptic potassium channels. Neuron 81, 787–799.
- 49) Kajikawa, Y., Saitoh, N. and Takahashi, T. (2001) GTP-binding protein βγ subunits mediate presynaptic calcium current inhibition by GABAB receptors. Proc. Natl. Acad. Sci. U.S.A. 98, 8054–8058.
- 50) Takahashi, T., Kajikawa, Y., Kimura, M., Saitoh, N. and Tsujimoto, T. (2004) Presynaptic mechanism underlying regulation of transmitter release by G protein coupled receptors. Kor. J. Physiol. 8, 69–76.
- 51) Forsythe, I.D., Tsujimoto, T., Barnes-Davies, M., Cuttle, M.F. and Takahashi, T. (1998) Inactivation of presynaptic calcium current contributes to synaptic depression at a fast central synapse. Neuron 20, 797–807.
- 52) Cuttle, M.F., Tsujimoto, T., Forsythe, I.D. and Takahashi, T. (1998) Facilitation of the presynaptic calcium current at an auditory synapse in rat brainstem. J. Physiol. 512, 723–729.
- 53) Borst, J.G.G. and Sakmann, B. (1998) Facilitation of presynaptic calcium currents in the rat brainstem. J. Physiol. 513, 140–155.
- 54) Tsujimoto, T., Jeromin, A., Saitoh, N., Roder, J.C. and Takahashi, T. (2002) Neuronal calcium sensor 1 and activity-dependent facilitation of P/Q-type calcium currents at presynaptic nerve terminals. Science 295, 2276–2279.
- 55) DeMaria, C.D., Soong, T.W., Alseikhan, B.A., Alvania, R.S. and Yue, D.T. (2001) Calmodulin bifurcates the local Ca2+ sigmal that modulates P/Q-type Ca2+ channels. Nature 411, 484–489.
- 56) Katz, B. and Miledi, R. (1968) The role of calcium in neuromuscular facilitation. J. Physiol. 195, 481–492.
- 57) Felmy, F. and Neher, E. (2003) Probing the intracellular calcium sensitivity of transmitter release during synaptic facilitation. Neuron 37, 801–811.
- 58) Hori, T. and Takahashi, T. (2009) Mechanisms underlying short-term modulation of transmitter release by presynaptic depolarization. J. Physiol. 587, 2987–3000.
- 59) Muller, M., Felmy, F. and Schneggenburger, R. (2008) A limited contribution of Ca2+ current facilitation to paired-pulse facilitation of transmitter release at the rat calyx of Held. J. Physiol. 586, 5503–5520.
- 60) Ishikawa, T., Kaneko, M., Shin, H.-S. and Takahashi, T. (2005) Presynaptic N-type and P/Q-type Ca2+ channels mediating synaptic transmission at the calyx of Held of mice. J. Physiol. 568, 199–209.
- 61) Inchauspe, C.G., Martini, F.J., Forsythe, I.D. and Uchitel, O.D. (2004) Functional compensation of P/Q by N-type channels blocks short-term plasticity at the calyx of Held presynaptic terminal. J. Neurosci. 24, 10379–10383.
- 62) Yamashita, T., Hige, T. and Takahashi, T. (2005) Vesicle endocytosis requires dynamin-dependent GTP hydrolysis at a fast CNS synapse. Science 307, 124–127.
- 63) Lee, J.S., Ho, W.-K., Neher, E. and Lee, S.-H. (2013) Superpriming of synaptic vesicles after their recruitment to the readily releasable pool. Proc. Natl. Acad. Sci. U.S.A. 110, 15079–15084.
- 64) Hosoi, N., Holt, M. and Sakaba, T. (2009) Calcium-dependence of exo- and endocytotic coupling at a glutamatergic synapse. Neuron 63, 216–229.
- 65) Wu, X.-S., McNeil, B.D., Xu, J., Fan, J., Xue, L., Melicoff, E., Adachi, R., Bai, L. and Wu, L.-G. (2009) Ca2+ and calmodulin initiate all forms of endocytosis during depolarization at a nerve terminal. Nat. Neurosci. 12, 1003–1010.
- 66) Yamashita, T., Eguchi, K., Saitoh, N., von Gersdorff, H. and Takahashi, T. (2010) Developmental shift to a mechanism of synaptic vesicle endocytosis requiring nanodomain Ca2+. Nat. Neurosci. 13, 838–844.
- 67) Steinert, J.R., Kopp-Scheinpflug, C., Barker, C., Challiss, R.A.J., Mistry, R., Haustein, M.D., Griffin, S.J., Tong, H., Graham, B.P. and Forsythe, I.D. (2008) Nitric oxide is a volume transmitter regulating postsynaptic excitability at a glutamatergic synapse. Neuron 60, 642–656.
- 68) Eguchi, K., Nakanishi, S., Takagi, H., Taoufiq, Z. and Takahashi, T. (2012) Maturation of a PKG-dependent retrograde mechanism for exoendocytic coupling of synaptic vesicles. Neuron 74, 517–529.
- 69) Taoufiq, Z., Eguchi, K. and Takahashi, T. (2013) Rho-kinase accelerates synaptic vesicle endocytosis by linking cyclic GMP-dependent protein kinase activity to phosphatidylinositol-4,5-bisphosphate synthesis. J. Neurosci. 33, 12099–12104.
- 70) Micheva, K.D., Buchaman, J., Holz, R.W. and Smith, S.J. (2003) Retrograde regulation of synaptic vesicle endocytosis and recycling. Nat. Neurosci. 6, 925–932.
- 71) Neher, E. and Sakaba, T. (2001) Combining deconvolution and noise analysis for the estimation of transmitter release at the caly of Held. J. Neurosci. 21, 444–461.
- 72) Nakamura, Y., Harada, H., Kamasawa, N., Matsui, K., Rothman, J.A., Shigemoto, R., Silver, A., DiGregorio, D.A. and Takahashi, T. (2015) Nanoscale distribution of presynaptic Ca2+ channels and its impact on vesicular release during development. Neuron 85, 145–158.
- 73) Holderith, N., Lorincz, A., Katona, G., Rozsa, B., Kulik, A., Watanabe, M. and Nusser, Z. (2012) Release probability of hippocampal glutamatergic terminals scales with the size of the active zone. Nat. Neurosci. 15, 988–997.
- 74) Nagerl, U.V., Novo, D., Mody, I. and Vergara, J.L. (2000) Binding kinetics of calbindin-D (28K) determined by flash photolysis of caged Ca2+. Biophys. J. 79, 3009–3018.
- 75) Takahashi, T. and Momiyama, A. (1993) Different types of calcium channels mediate central synaptic transmission. Nature 366, 156–158.
- 76) Iwasaki, S., Momiyama, A., Uchitel, O.D. and Takahashi, T. (2000) Developmental changes in calcium channel types mediating central synaptic transmission. J. Neurosci. 20, 59–65.
- 77) Doughty, J.M., Barnes-Davies, M., Ruznak, Z., Harasztosi, C. and Forsythe, I.D. (1998) Contrasting Ca2+ channel subtypes at cell bodies and synaptic terminals of rat anterioventral cochlear bushy neurones. J. Physiol. 512, 365–376.
- 78) Miki, T., Hirai, H. and Takahashi, T. (2013) Activity-dependent neurotrophin signaling underlies developmental switch of Ca2+ channel subtypes mediating neurotransmitter release. J. Neurosci. 27, 18755–18763.
- 79) Iwasaki, S. and Takahashi, T. (2001) Developmental regulation of transmitter release at the calyx of Held in rat auditory brainstem. J. Physiol. 534, 861–871.
- 80) Taschenberger, H., Leao, R.M., Rowland, K.C., Spirou, G.A. and von Gersdorff, H. (2002) Optimizing synaptic architecture and efficiency for high-frequency transmission. Neuron 36, 1127–1143.
- 81) Taschenberger, H. and von Gersdorff, H. (2000) Fine-tuning an auditory synapse for speed and fidelity: Developmental changes in presynaptic waveform, EPSC kinetics, and synaptic plasticity. J. Neurosci. 20, 9162–9173.
- 82) Nakamura, Y. and Takahashi, T. (2007) Developmental changes in potassium currents at the rat calyx of Held presynaptic terminal. J. Physiol. 581, 1101–1112.
- 83) Wu, M.N. and Bellen, H.J. (1997) Genetic dissection of synaptic transmission in Drosophila. Curr. Opin. Neurobiol. 7, 624–630.
- 84) Margeta, M.A., Shen, K. and Grill, B. (2008) Building a synapse: lessons on synaptic specificity and presynaptic assembly from the nematode C. elegans. Curr. Opin. Neurobiol. 18, 69–76.
- 85) Lewandoski, M. (2002) Conditional control of gene expression in the mouse. Nat. Rev. Genet. 2, 743–755.
- 86) Bendor, J.T., Logan, T.P. and Edwards, R.H. (2013) The function of α-synuclein. Neuron 79, 1044–1066.
- 87) Khatoon, S., Grundke-Iqbal, I. and Iqbal, K. (1992) Brain levels of microtubule-associated protein τ are elevated in Alzheimer’s disease: A radioimmuno-slot-blot assay for nanograms of the protein. J. Neurochem. 59, 750–753.
- 88) Wen, Z., Nguyen, H.N., Guo, Z., Lalli, M.A., Wang, X., Su, Y., Kim, N.S., Yoon, K.J., Shin, J., Zhang, C., Makri, G., Nauen, D., Yu, H., Guzman, E., Chiang, C.H., Yoritomo, N., Kaibuchi, K., Zou, J., Christian, K.M., Cheng, L., Ross, C.A., Margolis, R.L., Chen, G., Kosik, K.S., Song, H. and Ming, G.L. (2014) Synaptic dysregulation in a human iPS cell model of mental disorders. Nature 515, 414–418.
