SEMINAR
Introduction to Multilevel Analysis
2021 Volume 3 Issue 1 Pages 5-9
Details
2021 Volume 3 Issue 1 Pages 5-9
In this era of large-scale, multi-institutional studies, the importance of analyzing hierarchical (clustered) data is increasing. However, conventional regression analysis may be inadequate for this purpose because it assumes that records for individual patients are independent of records for other patients. Multilevel analysis is a statistical method that allows one to analyze data with a hierarchical structure. Mixed-effect models expand the conventional regression models by incorporating random coefficients for each unit of cluster. Multilevel analysis can be applied to studies on repeated measures among individuals, multi-institutional studies on effects of individual-level variables, and studies on effects of cluster-level variables or cluster-level variances. This report summarizes the basics of multilevel analysis and how it can be used in clinical epidemiology research.
In conventional regression analysis, records for individual patients are considered independent of records for other patients. In other words, patients are assumed to have no correlations with other patients. However, this assumption may not hold true in analyses of multi-institutional studies. Similar patients may tend to visit a particular hospital. Hospital characteristics are clearly identical for all patients visiting the same hospital, and may affect the outcomes of individuals. Such data are referred to as having a multilevel (or hierarchical) structure, wherein individuals are considered to be clustered (or nested) within a hospital.
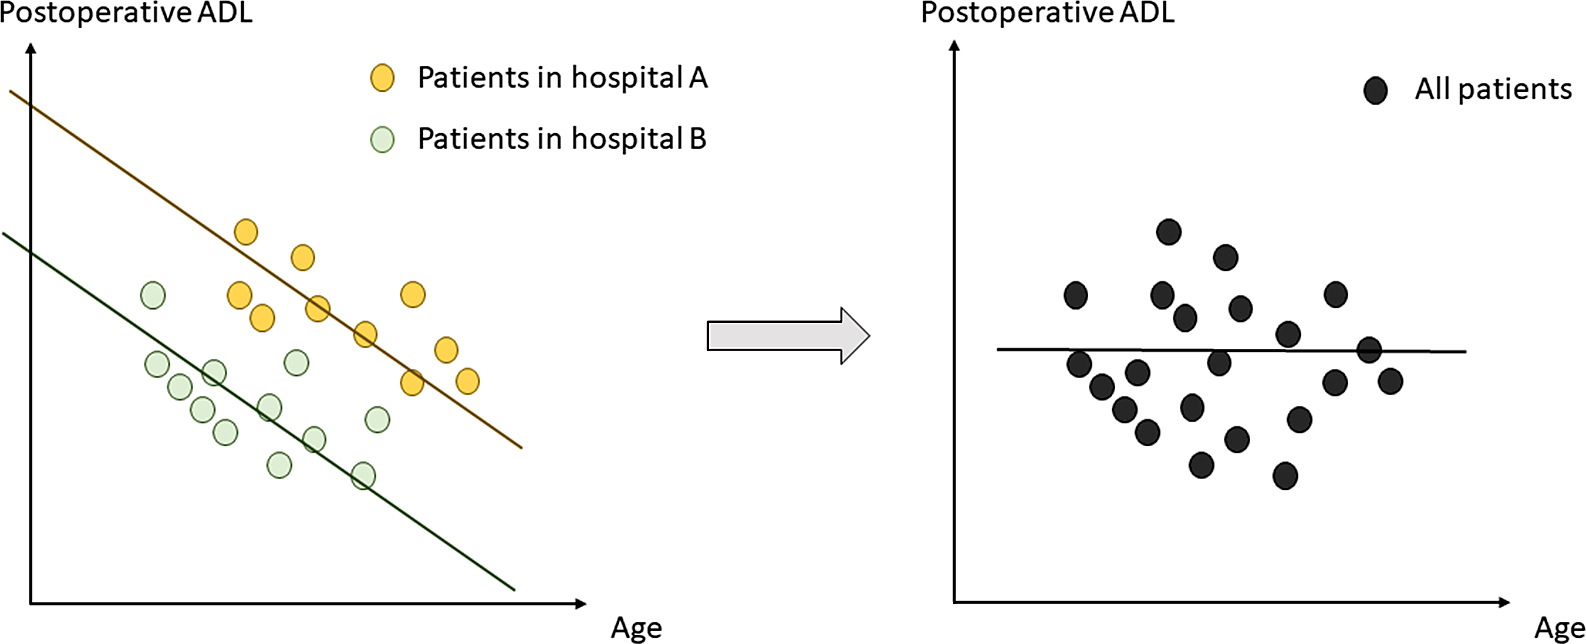
Fig. 1 depicts an example of the misinterpretation that can arise by inappropriately subjecting clustered data to conventional regression analysis. In both hospitals A and B, age is inversely associated with postoperative activities of daily living (ADL). Furthermore, the patients in hospital A generally have higher ADL than the patients in hospital B. However, when the data from the two hospitals are combined and analyzed by considering the patients as independent individuals, the relationship between age and ADL is lost.
Researchers may need to account for clustering of data and analyze the effect of individual variables (e.g., age) on individual outcomes (e.g., ADL). In different scenarios, researchers may be interested in the influence of a particular context (e.g., hospital) on the outcomes of individuals. This general contextual effect can be observed as an individual correlation within the context. Finally, the research objective may be to analyze a specific contextual effect, reflecting the effect that a characteristic of the context (e.g., hospital volume) has on individual outcomes. Multilevel analysis is a statistical method that allows one to analyze these effects [1].
In this era of large-scale studies using real-world data obtained from multiple institutions, analysis of hierarchical data is becoming increasingly important. Readers of Annals of Clinical Epidemiology may be interested in statistical methods that are appropriate for analyzing clustered data to address their research questions. In this seminar paper, I introduce the concept of multilevel analysis and present how it can be used in clinical epidemiology research. The paper is structured as follows. First, I introduce the settings where multilevel analysis may be useful. Second, I familiarize readers with multilevel regression models and their interpretation. Finally, I provide examples of studies using multilevel models.
Multilevel analysis is useful in the cases described below.
1. Study on Repeated Measures in IndividualsAn individual has characteristics that are constant over time (e.g., genetic background). Thus, repeated measures for the same individual over different time periods are inherently correlated with one another. Here, the multiple measures are considered to be clustered within the level of an individual, and a multilevel analysis treating each individual as a unit of cluster can be applied.
2. Multi-institutional Study on Effect of Individual-level VariablesPatients who are treated in the same hospital may have similar characteristics. In addition, the treatment patterns and quality of care in a single hospital may uniformly affect the outcomes of all patients treated in the same hospital. Even if the exposure and outcome variables of interest are at the individual level (e.g., new/old treatment and death), multilevel analysis is appropriate to take these clustering effects into account. This situation may be especially relevant for readers of Annals of Clinical Epidemiology.
3. Study on Effect of Cluster-level Variables and Cluster-level VariancesThe exposure of interest may be a specific contextual variable (i.e., a characteristic at a higher level within the hierarchical model) that affects all individuals within the cluster. For example, one may be interested in evaluating the effect of an institutional characteristic (e.g., hospital size or number of staff) on individual outcomes. The level of the cluster is not confined to specific institutions; it may be neighborhood or regional. A social epidemiology research study may investigate the association between regional socioeconomic deprivation status and individual health status. Meanwhile, a study on health inequality may assess the regional variation in health status.
We begin with a conventional regression model. A linear regression model can be expressed as:
| (1) |
where j is a variable that identifies an individual, yj is an outcome variable for each individual, xj is an exposure variable, α is the intercept, β is the regression coefficient for variable x, and εj is a residual. If x is age and y is postoperative ADL, formula (1) reflects that a unit increase in age results in a β change in postoperative ADL.
Next, we consider data obtained from hospitals A and B. If we allow two hospital-specific intercepts αA and αB, instead of a single intercept α, while holding a common coefficient β, the formula can be revised as follows:
| (2) |
Formula (2) considers two specific hospitals using specific intercepts αA and αB. When the number of hospitals is increased and hospitals are considered non-specific, randomly-selected samples, the formula can be expressed as:
| (3) |
where i represents each hospital. The intercept for each hospital, α0 + δi, is assumed to take different values following a probability distribution with an average of α0. The effect of hospitals is considered a random effect. The effect of variable x is the same for all hospitals and is called a fixed effect. Formula (3) contains both a fixed effect and a random effect and is thus called a mixed-effect model. Here, only the intercept is randomly distributed. Therefore, the model is referred to as a random-intercept model.
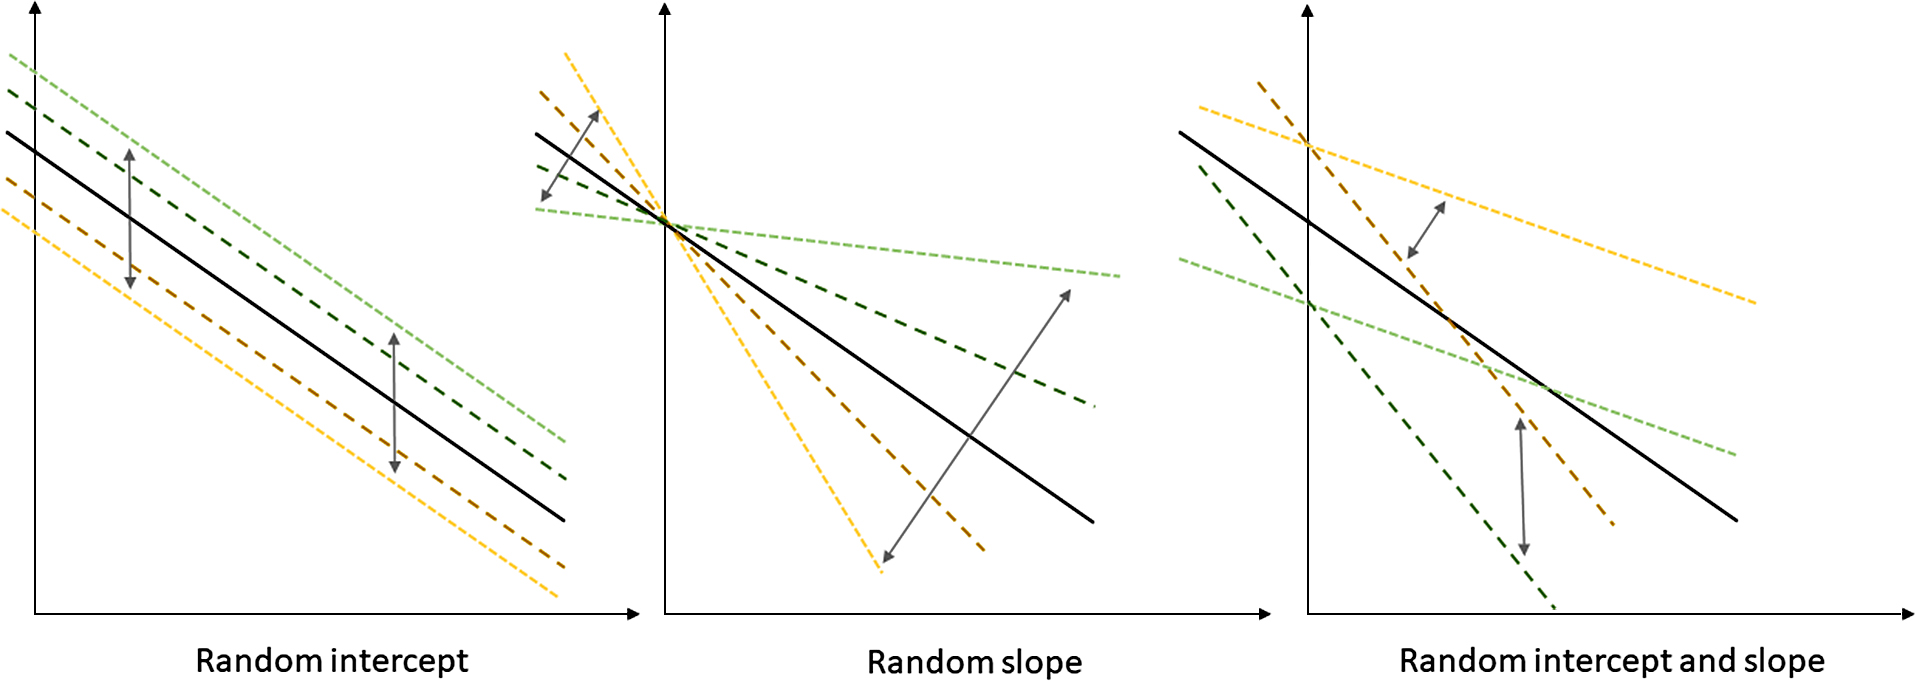
2. Multilevel ModelsIn the random-intercept model, the intercept α is considered to be randomly distributed across different hospitals, while the coefficient (or slope) β is held constant. However, the slope β can also be considered to take random values for each hospital, following a probability distribution. This is referred to as a random-slope model. The combination of a random-intercept model and a random-slope model is referred to as a random-coefficient model and can be expressed as:
| (4) |
Schematic figures of the different multilevel models are shown in Fig. 2.
The idea of multilevel models can also be applied to different regression analyses, including multivariable linear regression, logistic regression, and Poisson regression. A multivariable logistic regression model with a random intercept for each hospital can be expressed as:
| (5) |
It is important to note that the regression coefficients obtained from a multilevel analysis represent cluster-specific (or intra-cluster) measures of association [1, 2]. For example, consider applying formula (5) to evaluate the effect of age and other variables on death of a patient, while considering hospital as a unit of cluster. The odds ratio of 1.5 for every 10-year increase in age implies that, when comparing two individuals within the same hospital who have the same values for other variables but differ in age by 10 years, the odds of death of the older patient is 1.5 times that of the younger patient. This is different from the population-average effect that summarizes the comparison of individuals from different clusters [2, 3].
4. Analysis of Specific and General Contextual EffectsThe aforementioned interpretation of cluster-specific effects does not pose difficulties when variables are at the individual level (e.g., age, sex, disease severity) within clusters (e.g., hospitals). Thus, interpretation of a multilevel analysis for a multi-institutional study on the effect of individual-level variables is straightforward. However, when cluster-level variables are entered into the model to evaluate a specific contextual effect, the interpretation becomes less intuitive because the cluster-level variables are obviously same for all individuals within the cluster. Statisticians have proposed several measures to quantify the effect of cluster-level variables. The interval odds ratio proposed by Larsen and colleagues and the proportion of opposed odds ratios proposed by Merlo and colleagues are examples of summary measures that quantify the effects of cluster-level variables using the variance of random effects [4–7]. Merlo et al. [8] further showed that the precision of estimated specific contextual effects may be paradoxically overestimated when the intra-cluster correlation is small (i.e., the general contextual effect is small) and suggested that both general and specific contextual effects should be considered when interpreting the contextual influences on individual health. The intraclass correlation coefficient (ICC) is commonly used as a measure of general contextual effect in hierarchical structures [1, 8]. The ICC can be calculated as follows:
| (6) |
where σ2u represents the variance across clusters and σ2e represents the variance across subjects within clusters.
This section provides examples of clinical and health services research studies that used multilevel analysis.
1. Study on Repeated Measures among IndividualsAlthough continuous positive airway pressure (CPAP) is a standard intervention for moderate or severe obstructive sleep apnea, poor adherence to the therapy is a concern. Bakker et al. [9] conducted a randomized controlled trial to evaluate the effect of motivational enhancement (ME) on adherence of patients with obstructive sleep apnea receiving CPAP. Eligible participants were those with moderate or severe obstructive sleep apnea who had cardiovascular disease or were at risk of cardiovascular disease. The intervention group received ME in addition to CPAP, while the control group received CPAP only. ME provided by a psychologist comprised in-person sessions at baseline and week 1 followed by phone calls until week 32. Data on CPAP use were automatically collected, and adherence (hours/night on CPAP) until 6 months was compared between the two groups.
Because the outcome was repeatedly measured among individuals, there was a hierarchical structure (i.e., person—night). A multilevel analysis was therefore conducted with person as a unit of clustering. Adherence was expected to decrease over time in a person-dependent manner. Thus, a random slope for time was incorporated into the model in addition to a random intercept.
There were 83 participants (42 for CPAP only and 41 for CPAP + ME) with 14,273 nights of data over 6 months. After adjustment for time and other variables, the average adherence was 99 minutes per night higher in the CPAP + ME group compared with the CPAP only group.
2. Multi-institutional Study on Effect of Individual-level VariablesA severe nationwide shortage of noradrenaline occurred in the United States between 2011 and 2012. Because noradrenaline is a first-line vasopressor for treatment of septic shock, the drug shortage may have had an impact on the outcomes of patients with septic shock admitted during the shortage period. Vail et al. [10] conducted a retrospective cohort study using real-world data. Adults admitted to hospitals in the Premier Healthcare Database for septic shock between July 2008 and June 2013 were included. The exposure was patient admission during the period of the hospital-level noradrenaline shortage (>20% decrease in hospital rate of noradrenaline use). The outcome was in-hospital mortality.
Although the exposure of interest was at the individual level, patients admitted to the same hospital may share similar characteristics, and the hospital characteristics may also affect individual outcomes. Therefore, the study used a multilevel logistic regression model with hospital as a unit of clustering. A random intercept model was selected, and both individual-level and hospital-level covariates were used for adjustment.
The study included 27,835 patients admitted to 26 hospitals. There were 1,961 patients hospitalized during the noradrenaline shortage period and 25,874 patients hospitalized during control periods. After adjustment for patient and hospital characteristics, admission during the shortage period was associated with increased odds of death (odds ratio, 1.15; 95% confidence interval, 1.01 to 1.30).
3. Study on Cluster-level VariancesAn example of a study analyzing variance in health outcomes across clusters was found in the field of social epidemiology. Merlo et al. [11] reported an observational study that assessed geographical differences in body mass index and proportion of overweight individuals. Data from the Health Survey in Skåne, Sweden, conducted in 2008 were used to evaluate the variance across municipalities.
Considering that each individual was nested within a municipality, a multilevel linear regression model was used for the continuous outcome variable (body mass index) and a multilevel logistic regression model was used for the dichotomous outcome variable (overweight or not). Individual factors associated with health status were not the focus of the study. Instead, the variance across municipalities was assessed using the ICC as a measure.
The study involved 27,222 participants from 33 municipalities. The ICCs for body mass index and prevalence of overweight individuals were both 0.9%, reflecting no meaningful differences across municipalities.
Multilevel analysis is a statistical method that allows one to analyze data with a hierarchical structure. Mixed-effect models expand the conventional regression models by incorporating random coefficients for each unit of cluster. Multilevel analysis can be applied to different types of studies, including studies on repeated measures among individuals, multi-institutional studies, and studies on cluster-level characteristics or cluster-level variances.