Abstract In cold region such as sea ice areas, it is difficult to evaluate the carbon dioxide exchange between the surface and atmosphere (CO2 flux) by eddy covariance due to their small flux magnitudes. Drying air samples using a closed-path infrared gas analyzer is effective for measuring small CO2 fluxes. However, using drying equipment leads to the attenuation of turbulent fluctuations, which tends to result in underestimation of CO2 flux. Therefore, it is necessary to survey which dryer is best to minimize this underestimation while effectively drying air samples. In this study, we evaluated the drying ability and persistence using desiccants and a membrane dryer, and the impact of air-drying on CO2 fluxes by simultaneous observations of the drying and non-drying systems. The drying systems with desiccants showed high drying abilities, but their persistence was only a few hours. The drying system with a membrane dryer had a lower drying ability. However, it successfully eliminated the water vapor fluctuation, which was important for accurate CO2 flux measurements. The use of the membrane dryer in the drying system resulted in only 5% underestimation of CO2 fluxes due to the attenuation of CO2 mixing ratio fluctuations, further suggesting its usefulness.
Key words: Drierite, Magnesium perchlorate, Membrane dryer, Partial air-drying, Polar ocean
1. Introduction
In recent years, global warming has been proceeding rapidly due to the enormous emissions of carbon dioxide (CO2) from human activities (IPCC Sixth Assessment Report, 2021). CO2 absorption by the oceans from the atmosphere is estimated to be about 2 Pg-C y-1, which is approximately 20% of the total CO2 emissions from human activities (Sitch et al., 2015; Friedlingstein et al., 2022). The cold regions such as the Southern and Arctic Oceans are particularly significant sinks of atmospheric CO2, with the Southern Ocean estimated to represent about 50% of total oceanic CO2 absorption (Takahashi et al., 2012) and the Arctic Ocean about 5%-14% (Bates and Mathis, 2009).
Sea ice distribution in high latitudes plays a major role as a controlling factor in global climate change. Traditionally, sea ice has been recognized as a barrier between the atmosphere and the ocean in terms of gas exchange. However, the number of evidences has been increasing that at certain time in the seasonal cycle the sea ice surface CO2 becomes enriched by the concentration effect of freezing, in which brine (seawater) is produced with high salinity and CO2 concentration by discharging salt and carbonate components when seawater freezes, and the sea ice becomes a source of CO2 emission to the atmosphere, while at other time the high productivity of algae living in the sea ice makes it a sink of CO2 from the atmosphere (Ikawa and Oechel, 2011; Delille et al., 2014; Nomura et al., 2018).
The eddy covariance (EC) method, which directly measures the carbon dioxide exchange per area (CO2 flux) between the surface and the atmosphere, is an excellent method for obtaining long-term and ecosystem-scale data, and it has been widely used in terrestrial areas such as forests. However, in the sea ice area, the application of the EC method is difficult because the CO2 flux is very small compared with terrestrial surfaces (Butterworth and Else, 2018). In the EC method, an open-path infrared gas analyzer that directly measures the density fluctuations of CO2 caused by atmospheric turbulence is most commonly used, but in cold, low-flux environments, the errors caused by the analyzer being a heat source (Ono et al., 2008), optical interference between CO2 and water vapor in the analyzer (Blomquist et al., 2014; Kondo et al., 2014; Landwehr et al., 2014; Yang et al., 2016), and uncertainty in the air density fluctuation correction (Kondo and Tsukamoto, 2012) have been reported to result in final CO2 flux values that do not match at the order of magnitude level compared with that obtained by other methods (Butterworth and Else, 2018).
Drying air sample using a closed-path infrared gas analyzer is an effective strategy to address these problems (Miller et al., 2010) as long as remained uncertainty is carefully evaluated (Dong et al., 2021). Methods for removing water vapor from the air sample include using drying equipment such as a membrane dryer and using granular desiccants such as magnesium perchlorate or Drierite. However, drying typically causes the loss of turbulent fluctuations at the gas analyzing detector as the sample air passes through the dryer (Miller et al., 2010). As a result, a problem arises that the magnitude of calculated CO2 fluxes is underestimated. Various methods have been proposed to correct the loss of turbulence fluctuations on land surfaces (e.g., Moore, 1986; Watanabe et al., 2000), but in cold regions where the absolute value of the flux is expected to be small, it is desirable to minimize the loss of turbulence fluctuations at the measurement stage in order to avoid errors associated with post-processing corrections. The degree of underestimation of CO2 flux by drying is discussed by Miller et al. (2010), but there is no study that compares and evaluates the loss of turbulence fluctuations by different drying methods. Often, logistical constraints make it difficult to access EC equipment deployed on sea ice in polar regions, and it is not possible to maintain the dryer frequently. Therefore, it is necessary to examine which drying system is suitable for use in cold regions from the viewpoints of convenience, drying ability and persistence, and preservation of CO2 fluctuations.
In this study, we aim to construct an EC system that can dry air samples to the extent that H2O mixing ratio fluctuations do not affect the CO2 flux, while minimizing the loss of turbulent fluctuations of CO2 mixing ratio. The purpose of this study is to compare how the standard deviation values and covariance values (i.e., fluxes) of H2O and CO2 mixing ratios measured by the gas analyzer change when three drying systems using desiccants (Drierite and magnesium perchlorate) and a membrane dryer are introduced, based on the data obtained from simultaneous observations with drying and non-drying systems. In order to evaluate the loss of turbulent fluctuations, we selected the time period when the influence of water vapor fluctuation on the non-drying system could be ignored and compared the standard deviation values and flux values between the drying and non-drying systems.
2.Materials and Methods
2.1 Observation
We conducted observation experiment using the EC system with two closed-path CO2 & H2O gas analyzers (LI-7200, LI-COR, USA: the measurement cell size of 0.016 L) and an ultrasonic anemometer (CSAT3, Campbell Scientific, USA) installed at the height of 1.9 m within the meteorological observation field (1.4 ha) of the Institute for Agro-Environmental Sciences, National Agricultural and Food Research Organization (NIAES) from February 26th to 29th, 2020 (Fig. 1a). One of the gas analyzers was connected to a drying system, and comparative observations were made with and without drying. The observation field is covered with sedge with a few centimeters of vegetation height, and a slight CO2 uptake by photosynthesis during the day and a small CO2 emission by sedge and soil respiration at night are expected. Sample air was drawn into the gas analyzer using a diaphragm pump (DAU-20, ULVAK KIKO, Inc, Japan) and the flow rate was adjusted by a sample flow control valve and a flow meter (KR1200, KOFLOC, Japan) (Fig. 1b). The wind vector, sonic temperature, and CO2 and H2O mixing ratios output by the observation equipment were recorded by a data logger (CR3000, Campbell Scientific, USA) at 10 Hz.

Three types of methods were adopted for the drying system. One was Drierite (24001, 10-20 Mesh, W.A. Hammond, USA) and another is magnesium perchlorate (6-14 mesh, FUJIFILM Wako Pure Chemical Corporation, Japan); for these drying systems 300 g of desiccant was packed in a 283 mL holder (CF-30-1, General Rika, Japan). The flow rate of the air sample when using these desiccants was 13 L min-1 (Fig. 1c).
The drying duration during which the desiccants remained effective was estimated using the following procedure. Drierite has a water absorption capacity of 5%, while magnesium perchlorate has a capacity of 16% on a mass basis. Consequently, the total water absorption capacity of the desiccants in the holder was determined to be 15 g and 48 g for Drierite and magnesium perchlorate, respectively. To estimate the drying duration, these amounts were divided by the rate of water vapor pass passing through the column, which is the product of a flow rate and water vapor density. Assuming an average water vapor density of 200 mol m-3 and a flow rate of 13 L min-1, the estimated drying duration was found to be 5 hours for Drierite and 17 hours for magnesium perchlorate.
The other method was a membrane dryer (PD-50T-24MPP, Perma Pure LLC, USA). This model is relatively small compared with the membrane dryers used in other EC studies (e.g., Miller et al., 2010) with dimensions of 19 mm in diameter, 592 mm in length and fifty 0.033-inch internal membrane tube. The membrane dryer removes water vapor from the sample gas through the membrane by reducing the pressure of the purge gas relative to the sample gas. In this study, the purge line of the membrane dryer and the exhaust port of the gas analyzer were connected, and the drying ability was changed by adjusting the pressure of the purge line with the valve (Fig. 1d). The drying efficiency of the membrane dryer was based on the flow rate of the sample that controls the pressure of the purge line, and experiments were performed by adjusting the flow rate to three levels: 5, 9, and 13 L min-1 for high, medium, and low drying efficiencies, respectively. In any of these methods, the flow path length was less than one meter, and the flow rate was sufficient so that it took less than one second for the air sample taken at the inlet to reach the gas analyzer.
2.3 Calculation of turbulence statistics
In each drying system, turbulent fluctuations of the CO2 mixing ratio are attenuated as the sample air passes through the drying systems. Therefore, in order to compare the performance of different drying methods, it is necessary to quantify both the efficiency of drying and the impact on underestimation of CO2 flux. In this study, we clarify the characteristics of each drying method by comparing H2O and CO2 mixing ratios (χv and χc), standard deviations (σv and σc), the CO2 flux (Fc), and the latent heat flux (λE) obtained from the covariance of χv and vertical wind speed (w) of two systems with and without drying.
Fc was calculated by the following equation:
where ρd is the dry air density (mol m-3), bar is time average, and prime is deviation from the average. λE was calculated by the following equation:
where λ indicates the latent heat of vaporization per mole (J mol-1), and λE is calculated by multiplying it by the water vapor flux (E mol m-2 s-1). Note that the λE in this study is not necessarily the actual latent heat flux, but a value calculated from the observed data including the case of using the drying system.
In calculating these statistics, the averaging time was set to 10 minutes, assuming that the variations of χc and χv targeted in this study were at much higher frequency bands. Also, since the observation was in a flat area, no coordinate transformation was applied in the vertical direction. In addition, in calculating the covariance, the time series of χv or χc in relation to w was adjusted based on the maximum covariance approach within -2 to +1 seconds. As mentioned above, the time required for the air sample to pass through the system is within one second, and therefore, this time series adjustment also considers the time difference caused by the distance between the probe of the ultrasonic anemometer and the inlet of the gas analyzers. The drying ability was quantified by defining the attenuation rates (Aχ and Aσ, respectively) (%) of absolute value (i.e., χv) and fluctuation (i.e., σv) of water vapor mixing ratio as follows:


where the hat indicates the value of the non-drying system for comparison.
The evaluation of the turbulent fluctuation loss due to the introduction of the drying system was quantified by creating a one-to-one scatter plot for Fc and σc for each case of drying and non-drying and by the slope of linear regression with a zero intercept. Note that when λE is large, the uncertainty of χc measurement by LI-7200 increases due to optical interference of the analyzer (Kondo et al., 2014). Therefore, we used only data for time periods with small λE (less than 5 W m-2), where Fc and σc measured by the non-drying system can be regarded as true values (cf. Landwehr et al., 2014; in that paper the CO2 fluxes of non-drying and drying were almost the same when λE was less than 7 W m-2). We did not perform analysis for the turbulent fluctuation loss in the conditions of the membrane dryer with the high or low drying efficiency (i.e., flow rate of 5 L min-1 and 13 L min-1), where there were no time periods with sufficiently small λE.
3. Results
3.1 Meteorological conditions during observation
During the observation period, the air temperature varied from -3.9°C to 9.7°C. The air temperature rose during the day and reached the maximum (9.7°C) around 14:00 on February 27th (Fig. 2a). The wind speed ranged from 0.1 m s-1 to 4.4 m s-1 and tended to be higher during the day (Fig. 2b). The stability parameter (z/L where z is the measurements height and L is the Obukhov length) indicated that the condition was relatively stable at night and relatively unstable in the daytime (Fig. 2c).
3.2 Drying ability of different drying systems
In the experiment of the drying system using Drierite, both χv and σv showed sufficiently small values immediately after observation began, but both values increased about 3 hours later (around 19:50 JST on February 26th) and became comparable to the values observed in the non-drying system (Fig. 3a, b). The average values of Aχ and Aσ over the three hours are 95% and 98%, respectively (Fig. 3c, d). In the experiment using magnesium perchlorate as a desiccant, the drying ability lasted for about 15 hours (from 12:30 on February 27th to 03:20 on February 28th) (Fig. 4a, b). The average values of Aχ and Aσ over the fifteen hours are 82% and 94%, respectively (Fig. 4c, d). In the experiment using the membrane dryer, about one hour was need for χv to stabilize whenever after a flow rate was changed, but unlike the desiccants, the persistence of the drying ability continued after the stabilization (Fig. 5a, b). The average value of Aχ and Aσ during the time when the flow rate of the membrane dryer was stable (after 1 hour of setting) were 89%, 71%, and 4% (Fig. 5c) and 93%, 86%, and 61% (Fig. 5d) for the high, medium, and low drying efficiencies, respectively.

Figures 6, 7 and 8 show σc, Fc, and λE when using Drierite, magnesium perchlorate, and the membrane dryer, respectively. When using Drierite, generally, σc and Fc observed by both drying and non-drying system showed similar time variation, and a slight increase of Fc was observed around 17:30. At this time, λE also remained at relatively high value (about 20 W m-2) in non-drying system. From these time series data, we assumed σc and Fc observed by the non-drying system as the true values in the data of the time period from 18:20 to 19:50 on February 26th when λE was low and stable (Fig. 6).

The time variation of σc and Fc observed by both drying and non-drying system using magnesium perchlorate also agreed well, but Fc observed by the non-drying system was higher by up to 1μmol m-2 s-1 during the daytime when λE was relatively high (Fig. 7). In the data of the time period from 20:00 on February 27th to 02:00 on February 28th when λE was low and stable, we assumed σc and Fc observed by the non-drying system as the true values.
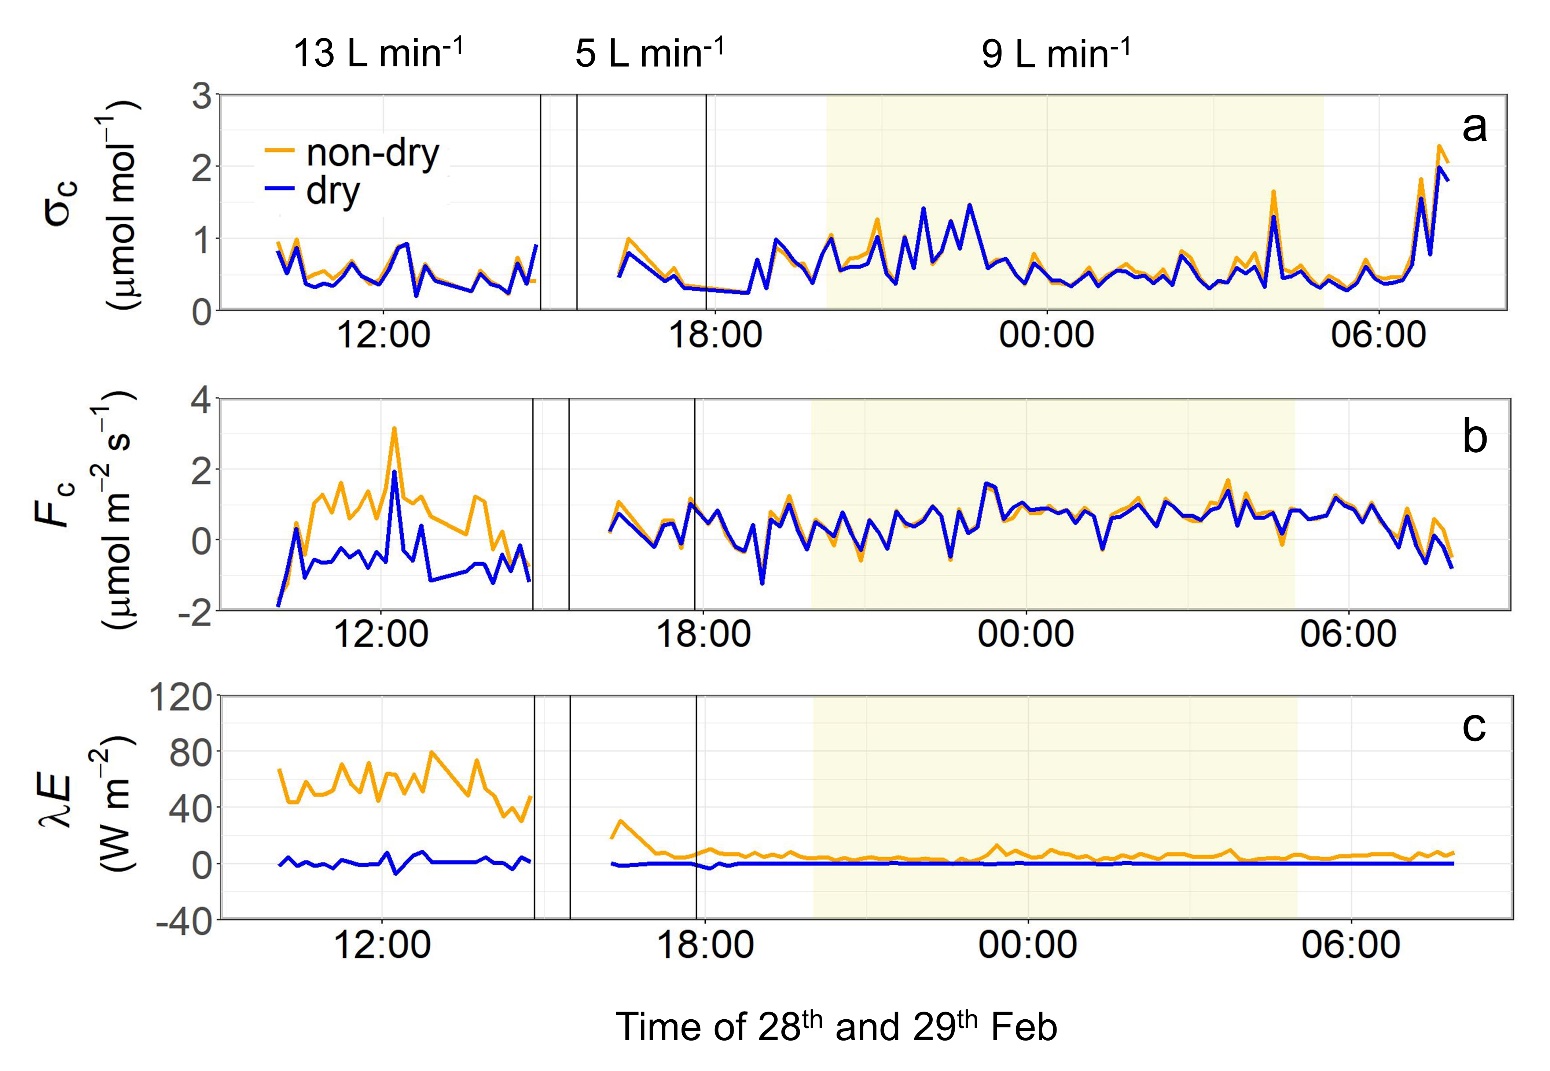
When the drying efficiency was low at a flow rate of 13 L min-1, λE exhibited relatively high values, and there was a large deviation in Fc observed using the drying and non-drying systems (Fig. 8). During time periods of low or high drying efficiencies at a flow rate of 13 L min-1 or 5 L min-1, λE remained relatively high. For the analysis of σc and Fc, only data from the stable time period (from 20:00 on February 28th to 05:00 on February 29th) when the drying efficiency was medium at a flow rate of 9 L min-1 were utilized.
3.4 Loss of turbulence fluctuations
In the time period when λE was negligible (highlighted with the yellow box in Figs. 3‒8), the loss of σc due to drying was 11% (the slope was 0.89) with Drierite (Fig. 9a), 3% (the slope was 0.97) with magnesium perchlorate (Fig. 9b), and 9% (the slope was 0.91) with the membrane dryer when drying efficiency was medium at a flow rate of 9 L min-1 (Fig. 9c). The loss of Fc due to drying was similar to that of σc, and it was 12% (the slope was 0.88) with Drierite (Fig. 9d), 3% (the slope was 0.97) with magnesium perchlorate (Fig. 9e), and 6% (the slope was 0.94) with the membrane dryer (Fig. 9f). We confirmed that the losses of σc and Fc were attributed to the high-frequency loss based on the spectral analysis (Fig. S1).
4. Discussion
4.1 Drying ability of each drying system
In the experiments where Drierite or magnesium perchlorate was filled in the holder, χv became close to 0 mmol mol-1 and Aχ was high (Fig. 3a, c, 4a, c). Especially, Drierite was superior to other drying systems in terms of Aχ and Aσ for the short period. Magnesium perchlorate had a moderate effect on both Aχ and Aσ compared to the membrane dryer and Drierite, but it lasted 12 hours longer than did Drierite. Thus, the utility of the desiccants should not be overlooked. The high performance of the short-term water removal (high Aχ) of Drierite might be accompanied with the cost of the greater high-frequency attenuation (Fig. 9a) compared with other drying systems, but this point needs to be evaluated further.
The drying durations achieved using desiccants were 3 hours for Drierite and 15 hours for magnesium perchlorate. These durations were closely aligned with the theoretical estimates of 5 hours for Drierite and 17 hours for magnesium perchlorate, respectively. The agreements between the theoretical value and the observations suggest that it is possible to roughly estimate the possible measurable duration prior to deployments when using desiccants.
Although drying systems with desiccants used in this study require frequent maintenance within a day, there are certainly advantages of using them due to their low costs if frequent maintenance is possible. However, in studies such as in sea ice areas, accessing to the observation site is often challenging according to logistical circumstances. It is possible to increase the amount of the desiccants, but this would come at the cost of further underestimating Fc. On the other hand, by adopting a drying system based on a pressure gradient, the membrane dryer can minimize the labor required for the system maintenance.
4.2 Importance of air-drying and performance of partial air-drying
Despite the loss of turbulent fluctuations due to the drying systems, the values of Fc measured by the drying and non-drying systems agreed very well except for some periods when λE was greater than 40 W m-2 (near 12:00-14:00 in Fig. 7 and 12:00 in Fig. 8). Large discrepancies in Fc were found when using the membrane dryer with a low drying efficiency at a flow rate of 13 L min-1 (Fig. 8b) even though the loss of turbulent fluctuations associated with the drying was expected to be minimum due to the large flow rate (Blomquist et al., 2014). These results signify the importance of drying for reliable Fc measurements in high latent heat flux environments.
This study also highlights the performance of a partial drying system, instead of a complete removal of water vapor in air samples. Using the membrane dryer with a medium drying efficiency at a flow rate of 9 L min-1 to remove 71% of χv (Fig. 5c) resulted in an 86% reduction in σv (Fig. 5d) and complete suppression of λE (Fig. 8c). Parts of the remaining 14% of σv might have been caused by the instrument noise (Dong et al., 2021) or low frequency variations of water vapor density, both of which did not contribute to flux measurements.
Although a flow rate above 10 L min-1 is desirable for resolving 10 Hz signals, given that the volume of LI-7200 cell is 0.016 L, the use of the membrane dryer with the medium drying efficiency at a flow rate of 9 L min-1 caused only minimal (5%) loss in the turbulent fluctuations related to CO2. Hence, we considered that the membrane dryer with the medium drying efficiency at a flow rate of 9 L min-1 was useful for Fc measurements. It is noteworthy, however, that our results also suggest that a much smaller amount of water vapor removal is practically useful. For the period around 12:00 on February 28, even a 10% removal of χv with the membrane dryer (Fig. 5c) led to significant reductions in both σv (Fig. 5d) and λE (Fig. 8c). However, we are not able to eliminate the possibility that the remaining λE affects Fc. Further investigations are needed if such a minimum removal of water vapor is sufficient to reasonably eliminate flux errors associated with water vapor fluctuations.
This study was only a short-term experiment that showed sufficient variations of χc for flux measurements, but it included many nighttime data when the atmosphere was stable (Fig. 2c). We did not assess how much errors associated with water vapor would affect long-term averaged Fc under various conditions, especially in high humidity environments that are typically encountered over marine areas. Furthermore, the random error for Fc needs to be evaluated appropriately in small Fc environments such as sea ice (Dong et al., 2021). Future tasks are anticipated to observe under more different conditions, and to separate and evaluate the measurement errors of χc caused by the measurement accuracy of water vapor and the optical interference factors of water vapor and CO2.
5. Conclusion
In this study, we evaluated the drying ability, the persistence of drying ability, and the loss of turbulence fluctuations due to drying from the results of simultaneous observation experiments with the non-drying EC system using three drying devices. The desiccants had a persistence of several hours at the weight used in the experiment, but it was found that they had a high drying ability and was valuable for intensive observations that require short-term observations or where frequent maintenance can be possible. Regarding the membrane dryer, although the water vapor removal ability was inferior to that of the desiccants, it was possible to continuously eliminate the fluctuation of water vapor to a sufficient extent by decreasing the pressure of the purge line. Furthermore, our study underscores the importance of removing water vapor fluctuation, that is, latent heat flux, rather than water vapor itself. From these results, we conclude that the use of the membrane dryer is effective when considering the difficulty of replacing desiccants in remote areas such as polar regions.
Acknowledgments
We thank Dr. Yuji Kominami and Dr. Takafumi Miyama (Forest Research and Management Organization) for the use of gas analyzers and discussion. This study was supported by the Joint Research Program of the Japan Arctic Research Network Center, the Japan Society for the Promotion of Science (grant numbers: JP18H03745; JP20H04345; JP23H02341), and the Arctic Challenge for Sustainability II (ArCS II) project. This study contributed to Measuring Essential Climate Variables in Sea Ice (ECV-Ice: SCOR Working group 152), Coupling of ocean-ice-atmosphere processes: from sea-Ice biogeochemistry to aerosols and Clouds (CIce2Clouds: SCOR Working Group 163), the Cryosphere and Atmospheric Chemistry (CATCH), and Biogeochemical Exchange Processes at Sea Ice Interfaces (BEPSII).
Reference
- Bates NR, Mathis JT, 2009: The Arctic Ocean marine carbon cycle: evaluation of air-sea CO2 exchanges, ocean acidification impacts and potential feedbacks. Biogeosciences 6(11), 2433-2459. DOI: 10.5194/bg-6-2433-2009
- Blomquist BW, Huebert BJ, Fairall CW et al., 2014: Advances in Air-Sea CO2 Flux Measurement by Eddy Correlation. Boundary-Layer Meteorology 152(3), 245-276. DOI: 10.1007/s10546-014-9926-2
- Butterworth BJ, Else BGT, 2018: Dried, closed-path eddy covariance method for measuring carbon dioxide flux over sea ice. Atmospheric Measurement Techniques 11, 6075-6090. DOI: 10.5194/amt-11-6075-2018
- Delille B, Vancoppenolle M, Geilfus NX et al., 2014: Southern Ocean CO2 sink: The contribution of the sea ice. Journal of Geophysical Research-Oceans 119(9), 6340-6355. DOI: 10.1002/2014JC009941
- Dong Y, Yang M, Bakker DCE et al., 2021: Uncertainties in eddy covariance air-sea CO2 flux measurements and implications for gas transfer velocity parameterisations. Atmospheric Chemistry and Physics 21(10), 8089-8110. DOI: 10.5194/acp-21-8089-2021
- Friedlingstein P, O’Sullivan M, Jones MW, et al., 2022: Global Carbon Budget 2022. Earth System Science Data 14(11), 4811-4900. DOI: 10.5194/essd-14-4811-2022
- Ikawa H, Oechel WC, 2011: Air-sea CO2 exchange of beach and near-coastal waters of the Chukchi Sea near Barrow, Alaska. Continental Shelf Research 31(13), 1357-1364. DOI: 10.1016/j.csr.2011.05.012
- IPCC, 2021: Summary for Policymakers. In Climate Change 2021: The Physical Science Basis. Contribution of Working Group I to the Sixth Assessment Report of the Intergovernmental Panel on Climate Change ed. By Delmotte VM, Zhai P, Pirani A, et al. Cambridge University Press, Cambridge, United Kingdom and New York, NY, USA, pp. 3-32. DOI:10.1017/9781009157896.001
- Kondo F, Ono K, Mano M et al., 2014: Experimental evaluation of water vapour cross-sensitivity for accurate eddy covariance measurement of CO2 flux using open-path CO2/H2O gas analysers. Tellus Series B-Chemical and Physical Meteorology 66(1), 23803. DOI: 10.3402/tellusb.v66.23803
- Kondo F, Tsukamoto O, 2012: Comparative CO2 flux measurements by eddy covariance technique using open- and closed-path gas analysers over the equatorial Pacific Ocean. Tellus Series B-Chemical and Physical Meteorology 64(1), 17511. DOI: 10.3402/tellusb.v64i0.17511
- Landwehr S, Miller SD, Smith MJ et al., 2014: Analysis of the PKT correction for direct CO2 flux measurements over the ocean. Atmospheric Chemistry and Physics 14, 3361-3372. DOI: 10.5194/acp-14-3361-2014
- Miller SD, Marandino C, Saltzman ES, 2010: Ship-based measurement of air-sea CO2 exchange by eddy covariance. Journal of Geophysical Research-Atmospheres 115, D02304. DOI: 10.1029/2009JD012193
- Moore CJ, 1986: Frequency response corrections for eddy correlation systems. Boundary-Layer Meteorology 37, 17-35. DOI: 10.1007/BF00122754
- Nomura D, Granskog MA, Fransson A et al., 2018: CO2 flux over young and snow-covered Arctic pack ice in winter and spring. Biogeosciences 15(11), 3331-3343. DOI: 10.5194/bg-15-3331-2018
- Ono K, Miyata A, Yamada T, 2008: Apparent downward CO2 flux observed with open-path eddy covariance over a non-vegetated surface. Theoretical and Applied Climatology 92(3-4), 195-208. DOI: 10.1007/s00704-007-0323-3
- Sitch S, Friedlingstein P, Gruber N et al., 2015: Recent trends and drivers of regional sources and sinks of carbon dioxide. Biogeosciences 12(3), 653-679. DOI: 10.5194/bg-12-653-2015
- Takahashi T, Sweeney C, Hales B et al., 2012: The changing carbon cycle in the Southern Ocean. Oceanography 25(3), 26-37. DOI: 10.5670/oceanog.2012.71
- Watanabe T, Yamanoi K, Yasuda Y, 2000: Testing of the bandpass eddy covariance method for a long-term measurement of water vapour flux over a forest. Boundary-Layer Meteorology 96, 473-491. DOI: 10.1023/A:1002642028984
- Yang M, Prytherch J, Kozlova E et al., 2016: Comparison of two closed-path cavity-based spectrometers for measuring air-water CO2 and CH4 fluxes by eddy covariance. Atmospheric Measurement Techniques 9(11), 5509-5522. DOI: 10.5194/amt-9-5509-2016