D-23-00023Version has been updated.
Analysis of the effect of troposphere ozone on grain production in North China Plain and Yangtze River Delta
Article ID: D-23-00023

Details
Article ID: D-23-00023
Tropospheric ozone (O3) is known to harm crops by intrinsically affecting photosynthesis and other functions during crop growth. In staple crop production bases in the North China Plain (NCP) and Yangtze River Delta (YRD) regions, food security, especially food production, has been reported to be threatened by high O3 concentrations. Studies have been conducted in the NCP or YRD to understand tropospheric O3 and its precursor gases; however, the need to understand the effect of O3 on crops in conjunction with the contributions of precursor gases (VOCs and NOx) to O3 formation using a fine-scale model remains. In this study, the combined Weather Research and Forecast with Chemistry (WRF-Chem) model was used to evaluate the impact of surface O3 on reduced grain yield in China in 2010, covering the crop-growing seasons of single rice, double late rice, and winter wheat. The relative yield loss due to O3 damage was evaluated using the accumulated O3 exposure over a threshold of 40 ppb (AOT40) and a mean 7-hour O3 mixing ratio (M7). The validation showed that the gas-phase chemistry mechanism Model for Ozone and Related chemical tracers, version 4 (MOZART-4), coupled with the Goddard Chemistry Aerosol Radiation and Transport (GOCART) aerosol module registered in WRF-Chem, can simulate O3 fairly in the NCP and YRD. The aggregated average rice (wheat) relative yield losses throughout NCP and YRD were estimated to be 5.9% (27.1%) for AOT40 and 2.2% (9.6%) for M7, whereas aggregated rice (wheat) production losses were 2,345 kt (13,947 kt) for AOT40 and 999 kt (3,753 kt) for M7. In addition, reducing anthropogenic emissions of Volatile Organic Compounds (VOCs) from the energy and transport sectors is effective in reducing the surface O3 concentration. The results provide important scientific evidence for achieving sustainable food production in China.
Increasing tropospheric ozone (O3) is harmful to food security in the context of global climate change (e.g., Raza et al., 2019). O3 is produced through a complex set of chemical reactions involving precursor pollutants such as nitrogen oxides and volatile organic compounds (VOCs). These precursor pollutants are often released into the atmosphere through human activities such as transportation, industry, and agriculture (Ebi and McGregor, 2008). Moreover, O3 can negatively affect plants, particularly plant growth and productivity. The damage to plant leaves caused by O3 exposure is known as O3 injury. O3 can cause visible symptoms in leaves, such as stippling, flecking, and chlorosis. This can interfere with photosynthesis and ultimately reduce the ability of a plant to grow and produce. Besides visible symptoms, O3 can also cause invisible damage to plant physiology, such as reduced photosynthetic capacity, declining stomatal conductance, and altered carbon allocation, which can further affect plant growth and yield (Grulke and Heath, 2020; Bhatia et al., 2021).
Globally, diverse staple crops are reported to be affected by tropospheric O3 including wheat, rice, beans, maize, cotton, lettuce, etc. (Emberson et al., 2018; Hayes et al., 2019). Based on experimental and modeling methods, from the year 2000 to 2012, on a global scale, it was estimated that there was a 3.0-47% rice production loss, 3.9-48% wheat production loss, 2.2-5.5% maize production loss, and 8.5-65% legumes production loss (Emberson et al., 2009; Mills, et al., 2018). In contrast, on a national scale rice production decreased by 3-4% in Europe Union (EU), 2-3% in North America (NA), 1-3% in India, 4-11% in China, 4.3% in Japan, wheat production decreased by 4% in EU, 4% in NA, 9-19% in China, 13-28% in India, etc. (Ren et al., 2020; Tatsumi, 2022).
In East Asia, China is a critical region for researching tropospheric O3 with its precursor gases and its impact on agricultural production, considering its relationship with the global trend of tropospheric O3, its critical role in crop production, and the absence of air quality monitoring data (Li et al., 2022a). China is located upwind of East Asia; therefore, the O3 precursor gases of NOx and VOCs not only affect crops domestically but can also be transported to nearby countries through meteorological drivers (Yim et al., 2019; Yoshino et al., 2021). In addition, previous findings have revealed that wheat and rice are sensitive to tropospheric O3 in China; however, these crops are essential for feeding large populations and for economic activities and are planted on a national scale (e.g., Wang et al., 2022). Especially, North China Plain (NCP) and Yangtze River Delta (YRD) are two essential agricultural bases in China, and various crops including barley, corn, wheat, rice, maize, etc. are planted in these regions. Winter wheat (24% of the total staple crops) and rice (40 % of the total staple crops (Xu et al., 2013)) are the major staple crops planted in NCP and YRD, two-thirds of which are produced in NCP, whereas 60% of total rice is produced in YRD (Xu et al., 2013; Tu et al., 2022). Meanwhile, since 2013, continuous research has proposed that increasingly high levels of O3, fine particulate matter, and violated compounds have been observed throughout the Beijing-Tianjin-Hebei (BTH) city cluster, NCP, YRD, Pearl River Delta, Sichuan Basin, and Fenwei Plain in the last few decades (Hu et al., 2020; Wu et al., 2020; Xu, 2021). Therefore, regarding the formation of high tropospheric O3 concentrations and the importance of staple crop production in these areas, assessment of O3 risks on crop production in these regions has become imperative.
As a populous country, China is devoting itself to build a pollutant monitoring system to ensure food supply, and a great effort in tropospheric O3 research has been made (Feng et al., 2022). However, Air Quality Index (AQI) policy has not been sufficiently implemented; therefore, research on tropospheric O3 before 2012 at the province scale is insufficient (Xu, 2021). The Chinese government has implemented a variety of policies and regulations aimed at reducing air pollutants since 2013. These include the top-level national policy outlined in China’s Five-Year Plans (Mao et al., 2014), the Air Pollution Prevention and Control Action Plan (Ministry of Ecology and Environment of the People’s Republic of China, 2018), and updates on Clean Air initiatives (General Office of the State Council, 2013). Owing to these efforts, key pollutants such as NOx, SO2, and fine particulate matter (PM2.5 and PM10) have been significantly reduced. However, levels of surface O3 pollutants have not been adequately reduced (Jin et al., 2016; Dang and Liao, 2019; Li et al., 2020b; Li et al., 2021). Modeling studies have underscored the influence of meteorological conditions, including wind, humidity, and mixing height, and varying anthropogenic emissions on the formation of O3 in urban areas (Li et al., 2022b; Ma et al., 2023). To further our understanding of policy effects on O3 reduction, it is essential to examine both meteorological and anthropogenic emissions in the NCP, which is a region of major anthropogenic emissions.
Previous studies have indicated that the formation of tropospheric O3 is controlled by photochemical reactions between NOx and VOCs (Sillman, 1999). However, the intricate mechanism of VOC formation tends to cause uncertainty in tropospheric O3 estimations (Cheng et al., 2019). Since 2000, continuous VOCs measurements conducted in urban and industrial areas and backgrounds suggest that the reduction of NOx and VOCs coming from industrial sectors are likely to reduce O3 formation depending on the research region (Shrestha et al., 2022; Mu et al., 2023; Xu et al., 2023) Therefore, the relationships between O3, VOCs, and NOx remain unclear. Furthermore, studies have reported a shift in the trend of anthropogenic emissions following the implementation of clean air initiatives. For instance, emissions of industrial VOCs have moved from key to surrounding areas (Simayi et al., 2022), and primary and secondary organic aerosol (SOA) except nitrate decrease comparably from 2011/2012 to 2017/2018 (61-70% in fall and winter; 34-63% in spring and summer) (Zhou et al., 2019). Additionally, the establishment of a more representative anthropogenic emissions profile has been suggested (Zhu et al., 2021). Given these changes and uncertainties, analyzing the contribution of anthropogenic emissions prior to 2013 is crucial for identifying effective methods of O3 reduction.
Regarding previous scale-effect analyses in the field of Ecosystem Services (ES) and Impervious Systems (IS) (Zhang et al., 2018; Zhang et al., 2023), simulations at a 5-km grid resolution have been indicated suitable for reproducing the human impact on ecosystems. However, few air pollution studies in China using the Weather Research and Forecasting model coupled with Chemistry (WRF-Chem) have applied a 5-km grid scale. The scales commonly used were 6 km in the YRD region (e.g., Tie et al., 2009; Wang et al., 2019), 9 km in Beijing (e.g., Guo et al., 2016), and larger than 10 km at the national scale (e.g., Jiang et al., 2012; Wang et al., 2016; Zhang et al., 2017). Although the capability of the WRF-Chem model to perform meteorological simulations at scales larger than 10 km has been confirmed, uncertainties remain regarding the model's performance in pollution simulations (e.g., VOCs) at multiple scales, particularly in rural areas (Liu et al., 2018; Wei et al., 2018). Therefore, an evaluation of the model's performance in simulating tropospheric O3 and its precursor gases at multiple and appropriate scales is crucially needed.
Based on these concerns, this study aimed to (1) estimate the rice and wheat yield and production losses due to O3 exposure based on seasonal cumulative exposure over a threshold of 40 ppbv (AOT40) and seasonal 7 h mean O3 concentration during daylight (M7) metrics and (2) assess the influence of anthropogenic emissions from industry and transport sectors on tropospheric O3 formation.
In this study, the WRF-Chem model was used to simulate meteorological fields and air pollutant concentrations. This numerical atmospheric model simulates the transport, transformation, and fate of atmospheric pollutants and aerosols (Grell et al., 2005). O3 precursors and O3 are being simulated and evaluated fairly from various spatial resolution (approximately 90 km) globally (e.g., Abdi-Oskouei, et al., 2020).
The spatial model domain used in this study is shown in Fig. 1, where the outer domain is a coarse domain with a spatial resolution of 15 km (144 × 174 grids), and the two inner domains are fine grids with a spatial resolution of 5 km, covering the NCP (190 × 190 grids) and YRD (82 × 100 grids). The model tops of all domains were set to 50 hPa and 35 vertical layers. The simulation was performed from May 1, 2009, to October 31, 2009, and February 15, 2010, to July 15, 2010, covering the growing period of single rice NCP including BTH, double rice in the YRD, and winter wheat in both regions based on previous research (e.g., Zhao et al., 2020; Li et al., 2022b). Furthermore, due to the absence of air quality monitoring data in China prior to April 1, 2013, a simulation covering the period from April 1, 2013, to May 31, 2013, was conducted to validate the performance of the WRF-Chem model. In addition to the challenge of obtaining data from before 2013, China has implemented a clean air policy in 2013 that is aimed at reducing anthropogenic emissions (General Office of the State Council, 2013). This policy could introduce significant uncertainties in the validation process, as the model may not accurately simulate complex boundary and initial conditions over short time periods. Moreover, rainfall events in rural areas near Beijing during the summer months (June-August) are likely to amplify the effects of the policy (Wang et al., 2008; Wang et al., 2011). Therefore, we have selected the period from April 1 to May 31 as the validation timeframe in this study to minimize additional uncertainties caused by policy changes. The first month was positioned as the model spin-up and the simulation time step was set to 60 s. The model output was stored hourly for analysis.

Fig. 1. Domain configurations by Weather Research and Forecast with Chemistry (WRF-Chem) model. Domain 1 contains 144 × 174 horizontal grids with 15 km resolution, 35 vertical levels. Domain 2 (NCP) contains 190 × 190 horizontal grids, 35 vertical levels, domain 2 (YRD) contains 82 × 100 horizontal grids with 5km resolution, 35 vertical level.
The meteorological dataset used was the National Center for Environmental Prediction final analysis (NCEP FNL) operational global analysis dataset with a 0.25° × 0.25° grid every 6 h, as provided by the National Center for Atmospheric Research (NCAR) (NCAR, 2022). Table 1 lists the physical configurations used in this study. The microphysics adopt the Morrison 2-moment parametrization (Morrison et al., 2005), the Grell-3D scheme is adopted for cumulus convection (Grell and Freitas, 2014), the surface layer adopts the Revised MM6 Monin-Obukhov theory (Jiménez et al., 2012), the surface physics adopt the Noah Land-Surface Model (Tewari et al., 2004), the planetary boundary layer adopts the YSU scheme (Hong et al., 2006), long-wave radiation adopts the RRTM scheme (Mlawer et al., 1997), short-wave radiation adopts the Goddard scheme (Chou and Suarez, 1994), photolysis options adopt the Madronich Fast TUV scheme (Madronich, 1987), and deposition options adopt Wesely’s model (Wesely, 2007). For chemical mechanisms with aerosol emissions, though the WRF-Chem model allows for multiple combinations of chemical mechanisms and aerosol, in this study, the Model for Ozone and Related Chemical Tracers (MOZART) (Emmons et al., 2010) coupled with the Global Ozone Chemistry Aerosol Radiation and Transport (GOCART) was used to simulate the atmospheric chemistry and transport of trace gases and aerosols based on simulation results obtained by Tatsumi (2022).
Table 1. Physical configuration of WRF-Chem model used in this study.
;%0A%09%09%09newWindow.document.open();%0A%09%09%09newWindow.document.write('<img src=%22./Graphics/image10.jpg%22>');%0A%09%09%09newWindow.document.close();%0A%09%09) 2.2 Emission data
2.2 Emission data
The anthropogenic emission dataset used to evaluate the relationship with O3 was obtained from the Emission Database for Global Atmospheric Research (EDGAR v4.3.2). This dataset is a comprehensive database of anthropogenic emissions of greenhouse gases, air pollutants, and other substances that affect the quality of the air and the environment developed by the Joint Research Centre (JRC) of the European Comission and provides detailed information on the emissions of over 100 pollutants, including carbon dioxide (CO2), methane (CH4), nitrous oxide (N2O), sulfur dioxide (SO2), NOx, VOCs, and particulate matter (PM). The data are organized by country, region, and sector (e.g., energy, transportation, agriculture, industrial processes, and waste) and are available for various years ranging from 1970 to the present (Crippa et al., 2018). In addition, EDGAR contains no PM2.5 or PM10 emissions; therefore, the Hemisphere Transport of Air Pollution (HTAP) with 0.1° spatial resolution (Janssens-Maenhout et al., 2015) was adopted as the source of PM2.5 and PM10 in this study. EDGAR provides emissions in 2010, which covers the growing period of winter wheat. However, we need to adjust the EDGARs data for matching simulations in 2013 (the year when continuous surface O3 data are available) and 2009 (the year covering the growing period for single rice and double rice). In this study, the anthropogenic emissions were adjusted using the ratio between 2009 and 2013 from 2010 in different sectors (industry, residential, energy, and transport), as shown in Table 2 and 3, following the methods of the National Bureau of Statistics of China (2019). Fire Inventory (FINN) from the NCAR, is an inventory capable of generating 1 km-degree high resolution of emissions from open biomass burning every hour. In this study FINN v1.5 is adopted for biomass burning emissions (Wiedinmyer et al., 2011). The Model of Emissions of Gases and Aerosols from Nature (MEGAN) was built to estimate terrestrial ecosystem gases and aerosols, and exclusive input files for MEGAN were adopted to generate biogenic emissions (Guenther et al., 2012; Situ et al., 2013). The Community Atmosphere Model with Chemistry (CAM-Chem) was applied to update the boundary and initial conditions of MOZCART by thoroughly treating isoprene (C5H8) chemistry, including larger alkanes, alkenes, terpenes, and aromatics (Tilmes et al., 2015).
Table 2. Ratio for adjusting anthropogenic emissions from EDGARs v4 of 2009 to 2010.
;%0A%09%09%09newWindow.document.open();%0A%09%09%09newWindow.document.write('<img src=%22./Graphics/image11.jpg%22>');%0A%09%09%09newWindow.document.close();%0A%09%09)
Table 3. Ratio for adjusting anthropogenic emissions from EDGARs v4 of 2013 to 2010.
;%0A%09%09%09newWindow.document.open();%0A%09%09%09newWindow.document.write('<img src=%22./Graphics/image12.jpg%22>');%0A%09%09%09newWindow.document.close();%0A%09%09) 2.3 Observation data
2.3 Observation data
The surface O3 monitoring dataset was obtained from the China National Environmental Monitoring Centre (CNEMC, 2023). In this study, eight sites in the NCP and YRD were used for model validation. The actual yield and production of rice and wheat data adopted by this study were obtained from Global Agro-Ecological Zoning Version 4 (GAEZ v4) protocols (FAO, 2021) and extensively applied for analysis of rice (single rice and double rice) and wheat in China (Deng et al., 2019; Fei et al., 2020). GAEZ v4 provided 5 arc-minutes spatial resolutions raster data set globally in 2010 and were converted to the WRF-Chem model grid size.
2.4 Relative yield loss and production loss by O3 exposure metricsIn this study, AOT40 and M7 were used to evaluate rice and wheat yield reductions and production losses. The AOT40 has been extensively used in research on the effect of O3 on crop production in Europe and Asia (Mills et al., 2007; Tatsumi, 2022). Another commonly used metric, M7, is favored for the O3 evaluation of crops in the U.S. (Wang et al., 2022). M7 does not emphasize O3 concentrations of less than 40 ppbv; therefore, potentially more emphasis could be placed on higher but less biologically significant O3 concentrations (Hollaway et al., 2012), whereas AOT40 emphasizes the significance of O3 concentration. However, there is a large uncertainty in defining the threshold of O3 for crop production (Fuhrer et al., 1997; Kobayashi, 1999; Emberson et al., 2009; Mills et al., 2011); therefore, both types of widely used metrics were applied to achieve the best comprehensive prediction of rice yield losses from the exposure metrics. The AOT40 (ppmv) and M7 (ppbv) metrics are defined as follows:


where xy is the grid location, n is the number of hours during the accumulated period, [O3]i in eq. (1) is the hourly mean surface O3 concentration (ppmv). [O3] in eq. (2) is the hourly mean surface O3 concentration (ppbv) from 9:00 to 15:59 JST. The accumulated period of both O3 metrics in this study was defined based on Zhao et al. (2020) (Table 4). The relationship between the relative yield (RY) and AOT40- and M7-based exposure-response equation in China is shown in Table 4. Relative yield loss (RYL = 1.0 - RY) and crop production loss (CPL) were used to estimate the crop loss response to O3 exposure in every grid cell. The CPL was calculated as follows:

where CP is the actual production obtained from GAEZ.
Table 4. Chemistry and aerosol schemes used in this study.
;%0A%09%09%09newWindow.document.open();%0A%09%09%09newWindow.document.write('<img src=%22./Graphics/image16.jpg%22>');%0A%09%09%09newWindow.document.close();%0A%09%09)
Figure 2 shows the observed and simulated hourly mean surface O3 concentrations for May 2013. Overall, the validation results of the WRF-Chem model demonstrated a reasonable performance. The values of R2 between the simulated and observed O3 ranged between 0.02 and 0.30 in all observed points. Six of the eight sites showed statistically significant R2 values with the t-test analysis (p < 0.05). The average values of the MAPE and MBE for all sites were 48% and 2.9%, respectively. Furthermore, the WRF-Chem output underestimated surface O3 peaks and struggled to replicate the rapid fluctuations in the measured O3 values. Additionally, the simulation results slightly underestimated the average surface O3 concentrations. This is because the model resolution was slightly coarse for this application (5 km), which smoothed the values to some degree. Additionally, a fine horizontal model resolution (5 km) is recommended over a relatively coarse resolution (15 km). Table S1 displays the R2 values at 25 sites, comparing measurements with simulations at horizontal resolutions of 5 and 15 km. The 5-km simulations demonstrated higher R2 values (mean of 0.373) than the 15-km simulations (mean of 0.304) across the 25 observation sites. Although it is difficult to make sufficient comparisons because of the differences in the simulated domains, years, and sources of emissions, the accuracies of the model obtained in this study were almost identical to those obtained in previous research (Li et al., 2020a). The reproduction accuracy based on the R2, MAPE, and MBE indices was relatively fair for the NCP and YRD.

Fig. 2. Hourly variations in observed and simulated O3 concentrations from May 1 to 31 May, 2013. (a) 40.81/114.88 latitude/longitude, (b) 40.77/114.90, (c) 38.91/115.47, (d) 37.74/115.64, (e)37.74/115.69, (f) 37.76/115.70, (g) 38.32/116.87, and (h) 41.01/117.94.
The AOT40 and M7 were relatively high from central Hebei Province to the north-northeast Inner Mongolia area and showed relatively small AOT40 and M7 values around the hotspot (Fig. 3). The AOT40 and M7 levels in the winter wheat season were higher than those in the single and double rice seasons. The spatial averaged AOT40 (M7) in rice and wheat growing season were 8.3 ppmv (35.5 ppbv) and 15.7 ppmv (45.0 ppbv) at NCP and 5.7 ppmv (34.0 ppbv) and 10.0 ppmv (39.4 ppbv) at YRD, respectively (Table S2). Both AOT40 and M7 were relatively low during the rice-growing period than during the wheat-growing period, and AOT40 showed significantly lower values in the YRD than in the NCP for both crops, whereas M7 did not represent this trend but showed similar values in the NCP and YRD for both rice and wheat seasons. Feng et al. (2022) indicated that AOT40 is relatively high in the NCP region, which is a heavily industrialized and urbanized area with high air pollution levels, including ozone pollution. Tai et al. (2021) reported that the AOT40 (M7) in the rice and wheat growing seasons are 8.8 ppmv (45.0 ppbv) and 10.5 ppmv (48.0 ppbv) in East Asia, respectively, where M7 in both growing seasons are slightly higher than our estimation except for AOT40 in wheat season. In the NCP region, AOT40 in wheat season obtained by our study is in range of Hu et al. (2020) and generally consistent with that observed in Shandong by Zhu et al. (2015), and M7 in wheat season is almost the same as that observed in Shandong by Zhu et al. (2015). Moreover, in the YRD region, the AOT40 in rice and wheat season is consistent with previous studies (Aunan et al., 2000; Feng et al., 2003; Zhu et al., 2011; Zhao et al., 2018; Cao et al., 2020), and M7 in both crops season tended to be lower than that observed by Wang and Mauzerall (2004), Zhu et al. (2011), and Cao et al. (2020). Wang and Mauzerall (2004) suggested that the use of both indices helps to illustrate the range of uncertainty of the ambient O3 standard across countries. Although it is difficult to make complete comparisons due to differences in the assessment method, target year, cultivation period, regions and cultivars, the results obtained in this study showed a similar trend to that observed in previous studies. In view of the above results , both AOT40 and M7 are applied.

Fig. 3. Simulated AOT40 (top) and M7 (bottom) metrics during (a), (c) rice and (b), (d) wheat growing period.
Figure 4 and 5 show the O3-induced RYL and CPL for both crops in 2010. Table 5 regarding equations in Table 4 presents the RYL and CPL aggregates for the provinces in the research domains. In both the NCP and YRD, the negative effects of O3 on the yield and production of rice and wheat were evident. The aggregated average RYL of rice and wheat for NCP (YRD) was 7.0% (4.5%) and 34.0% (17.4%) using AOT40 and 2.3% (2.2%) and 12.0% (7.2%) using M7. By province, the O3-induced RYL in rice in NCP was relatively high in Hebei (9.2% for AOT40; 2.6% for M7), Shaanxi (6.1%; 2.1%), and Inner-Mongolia (8.1%; 2.7%). Also, the RYL for rice in YRD was high in Jiangsu (6.6% for AOT40; 2.7% for M7) and Anhui (4.9%; 2.2%). Moreover, the RYL for wheat in NCP was relatively high in Shanxi (40.4% for AOT40; 14.0% for M7), Hebei (36.4%; 11.9%), Shaanxi (30.9%; 13.0%), and Inner-Mongolia (35.2%; 11.2%). Also, RYL for wheat in YRD was high in Jiangsu (27.3% for AOT40; 11.4% for M7) and Anhui (21.2%; 9.3%).

Fig. 4. Relative yield loss according to the AOT40 (top) and M7 (bottom) metrics during (a), (c) rice and (b), (d) wheat growing period.

Fig. 5. Production loss according to the AOT40 (top) and M7 (bottom) metrics during (a), (c) rice and (b), (d) wheat growing period.
The aggregated rice and wheat production losses in the NCP and YRD were 2,345 kt and 13,946 kt, respectively, using AOT40, and 999 kt and 3,753 kt using M7, respectively. Regionally, rice production loss reached 1,113 kt (496 kt) for AOT40 (M7) in Anhui, 1,071 kt (421 kt) for AOT40 (M7) in Jiangsu, and 115 kt (61 kt) for AOT40 (M7) in Zhejiang, while the production loss of wheat was 5,955 kt (1,256 kt) for AOT40 (M7) in Hebei, 3,019 kt (1,003 kt) for AOT40 (M7) in Jiangsu, and 2,110 kt (762 kt) for AOT40 (M7) in Anhui, respectively. Overall, rice production loss was significantly higher across the YRD than across the NCP, and that of wheat was not significantly different between the NCP and YRD. It is difficult to make a simple comparison because of the differences in the years covered, target area, and calculation methods. It is important to note that the two metrics, AOT40 and M7, measure the different aspects of O3 exposure. AOT40 measures the accumulated exposure to O3 over a certain threshold during daylight hours over a period, whereas M7 measures the maximum 7-hour average O3 concentration during the day. Therefore, the difference in RYL between the two metrics for rice may be because rice is more sensitive to short-term exposure to high O3 concentrations than to long-term exposure to moderate O3 concentrations. In contrast, wheat is more susceptible to long-term exposure to moderate O3 concentrations; therefore, the RYL for wheat due to M7 is higher than that of AOT40.
3.4 Uncertainties of yields and production lossTable S3 showed the summary of the RYL of rice and wheat by AOT40 and M7 and comparison with the results of previous studies. In the YRD, the RYL by AOT40 (4.5% for rice and 17.4% for wheat) and M7 (2.2% for rice and 7.2% for wheat) is generally consistent with the ranges reported in previous studies (Cao et al., 2020; Liu et al., 2009; Zhao et al., 2018) except for some cases. On a national scale (NCP+YRD), our estimation of the RYL for rice by AOT40 (5.9%) and M7 (2.2%) showed no significant difference to that previously reported by Van Dingenen et al. (2009) and Tai et al. (2021). However, there is noticeable discrepancy in the RYL figures; our findings of RYL for wheat by AOT40 (27.1%) exceeds that of Van Dingenen et al. (2009) and Tai et al. (2021). Also, the RYL for wheat by M7 (9.6%) is consistent with that by Van Dingenen et al. (2009), but greater than that by Tai et al. (2021). Furthermore, our results of the RYL for wheat in Shandong (29.2% for AOT40 and 11.0% in Table 5) exhibit a divergent trend compared to the findings of Zhu et al. (2015), who reported 13.2-23.3% for AOT40 and 5.5% for M7. Moreover, the RYL values over NCP for wheat by AOT40 (34.0%) is consistent that by Hu et al. (2020). These uncertainties could be a result of the interpolation method from large scale to fine scale, and it could also result from the susceptibility of wheat to O3 (Holland et al., 2002).
Table 5. Estimated regional relative yield loss (%) and production loss (tons) of rice and wheat due to O3 exposure according to the AOT40 and M7 metrics.
;%0A%09%09%09newWindow.document.open();%0A%09%09%09newWindow.document.write('<img src=%22./Graphics/image22.jpg%22>');%0A%09%09%09newWindow.document.close();%0A%09%09)
O3 is synthesized through photolytic interactions involving NOx, CO, NMVOCs, and CH4 emissions. However, O3 concentrations predicted by the Air Quaity Model indicates uncertainty, which depends on chemical mechanisms such as the intricate interplay with NOx and the degradation chemistry of NMVOCs (e.g., Kitayama et al., 2019). The estimated rice and wheat damage was thus affected by several uncertainties, including those related to growing season, emission inventories, and concentraztion response relationships that predict yield reductions at different O3 exposures (Mills et al., 2007). Despite these inherent uncertainties, this study provides invaluable insights for regulatory stakeholders who aim at developing and implementing emission reduction strategies that target O3 precursors to enhance the predictability of future agricultural yields. Additionally, the robustness of the findings will be enhanced by expanding the dataset to include more recent data and a wider array of sources, which offers a comprehensive understanding of the interplay between aerosol emissions and O3 concentrations. Such a holistic approach will allow for a more detailed evaluation of the combined effects of O3 concentrations, meteorological factors, and climate change on localized agricultural productivity. Hence, it is important to understand how the strength of evidence and uncertainties influence grain production.
3.5 Anthropogenic pollutant 3.5.1 Effect of meteorology on O3 mixing ratioThe results in sections 3.2 and 3.3 indicate that surface O3 impacts rice and wheat production at the provincial level, highlighting the substance of moderating surface O3. In response to the clean air policy enacted by the Chinese government in 2013, adjustments in coal and petroleum consumption have been made, resulting in changes to anthropogenic emissions. It is well-established that O3 concentrations are correlated with a range of complex precursor gases. Below, we discuss the response of O3 concentrations to a reduction in anthropogenic emissions, the influence of meteorological factors, and the chemical interplay between O3, NOx, and VOCs.
Figure 6a and 6b show the average surface O3 mixing ratios for the NCP in May 2010 and 2013, respectively. The O3 mixing ratio is 0.05-0.06 ppmv over BTH (black box) in 2010, while it is 0.04-0.05 ppmv in 2013. For the inner Mongolia plateau (crossed by a black line), the O3 mixing ratio is 0.05-0.07 ppmv in 2010, while the O3 mixing ratio is 0.045-0.055 ppmv in 2013. In addition, for the Loess Plateau, the O3 mixing ratio in 2010 was higher than in 2013. To understand the reasons for the O3 gap in the NCP between 2010 and 2013, the effects of meteorological factors and anthropogenic emissions were investigated.
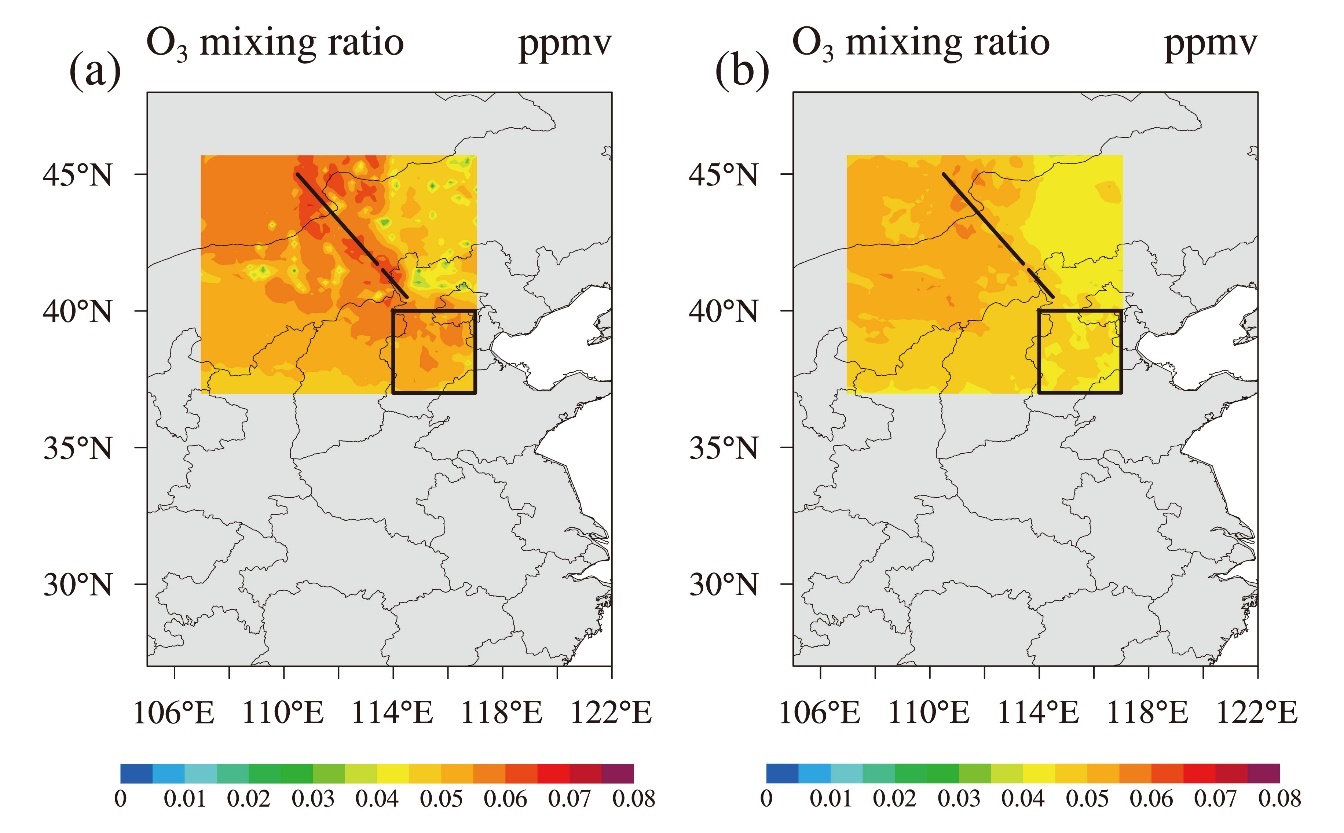
Fig. 6. Averaged O3 concentrations 2 m above the ground in May (a) 2010 and (b) 2013.
Figures S1 and 6 indicated that the wind field affects the distribution of the mixing ratio in the suburban and rough-plain rural areas. The convergence of winds from the southwest and northeast (black line) formed O3 clutches (Fig. 6(a)) emitted from city sources in 2010. In contrast, the prevailing southwesterly winds did not converge with the O3 mixing ratio (Fig. 6(b)). Moreover, in the BTH region below 100 m elevation (black box), although the wind conditions with southwesterly winds were almost identical in 2010 and 2013, the O3 mixing ratio in 2010 was higher than that in 2013 (Fig. 6). These results are consistent with those of Castell et al. (2008) and Song et al. (2011). They pointed out that the O3 mixing ratio shows a better correlation with meteorological parameters, such as convection mixing processes, fumigation, and breezes, in rural areas.
The above investigation showed that wind affects the O3 mixing ratio distribution regionally in unpopulated or rural areas. However, in anthropogenic emission sources or urban areas, the wind is not substantially affected by O3 formation. This investigation was simple for meteorological parameters, only wind and terrain height; meanwhile, for a period, only may be counted. Other meteorological parameters such as PBL and other periods, such as winter and summer monsoon, were not investigated; therefore, further investigation is needed.
3.5.2 Effect of anthropogenic emissions on O3 mixing ratioThe O3 formation mechanism is linked to anthropogenic emissions. For instance, O3 precursors such as secondary organic aerosols (SOA), which are formed from VOCs such as monoterpenes and toluene by the oxidation of photochemical reactions in the atmosphere, and N2O5, NO2, and NO3, highlight the role of anthropogenic emissions in O3 formation (Jacob, 2000; Chung and Seinfeld, 2002). These relationships are known as the photochemical mechanism O3-NOx-VOCs reactions; tropospheric O3 formation is driven by two primary emitted precursors, VOCs and NOx, through complex photochemistry (Sillman, 2002; EPA, 2023). The O3-NOx-VOCs reaction is recognized as “NOx limited” or “VOCs limited” depending on whether NOx or VOCs is limiting O3 formation. In the case of “NOx limited,” relevant sources of hydroxide (OH) are relatively high, and NOx is relatively low; O3 is most efficiently reduced by reducing NOx rather than reducing VOCs emissions. In the case of “VOCs limited” where the OH rate is relatively lower than NOx, the reducing VOCs results in better limitation of O3. In addition, regions between the “NOx limited” regime and the “VOCs limited” regime is recognized as NOx-VOCs transitional region; in this case, O3 is insensitive to either NOx reduction or VOCs reduction (Sillman, 1999; Sillman., 2002; Cheng et al., 2019; Liu and Shi, 2021). In this study, to quantify and visualize the “VOCs limited” and “NOx limited” regimes, the indicator “HCHO/NOy” was applied for investigating the effect of changing anthropogenic emissions for the O3 gap between May 2010 and May 2013 in NCP. Based on Ye et al. (2016), we set the threshold value of VOCs-NOx to (0.38, 0.6). Namely, if HCHO/NOy is less than 0.38, the region is “VOCs limited”; if it is between 0.38 and 0.6, the region is a transitional area, and if it is greater than 0.6, the region is “NOx limited.”
The NCP was VOC-limited in 2010 (Fig. 7(a)). In this regime, the rate of NOx production is relatively high and the rate of OH production is relatively low; therefore, reducing VOCs should reduce the O3 mixing ratio better than reducing NOx (EPA, 2023). In addition, HCHO/NOy exhibited different trends in urban and rural areas. The HCHO/NOy values range from 0.2 to 0.3 in the BTH (black box area). In contrast, in the western part of the NCP (under the redline), including the northern part of Shanxi and Xian, the values were 0.3-0.6. Moreover, the values were commonly < 0.2 in borders between Hebei-Shanxi, Hebei-Shandong, Hebei-Beijing, and Inner Mongolia which are non-anthropogenic emission sources in rural areas. This indicates that the NOy production rate in rural areas is higher than that in urban areas, and the rate of VOC production in urban areas is higher than that in rural areas. Moreover, meteorological factors contributed to the lower HCHO/NOy values in rural areas than in urban areas. Richmond-Bryant et al. (2018) indicated that the NOx gradient decreased when the wind speed was less than 5 m/s and increased when the wind speed was 5 m/s. In addition, the NOx concentration is contributed by anthropogenic emissions and fresh emissions, such as lightning and soil, etc (EPA, 2023). Regarding emissions sources, urban areas contribute 29% of NOx less than 71% of emissions from rural areas nationwide (Richmond-Bryant et al., 2018). Therefore, in rural areas, the rate of NOx production is higher than that in urban areas. Moreover, VOC emissions in urban regions are higher in urban areas than those in rural areas (Roba et al., 2014; Kumar et al., 2018) which indicates that the rate of OH production is higher in urban areas than in rural areas. Based on the above insights, in this study, the OH production rate was higher in the urban areas (black box and red line). Fig. S1 shows that the southwest wind with a speed > 5 m/s occurs in urban areas (black box and red lines in Fig. 7), and NOx should increase as it moves far from the emission center when the wind speed is > 5 m/s. In contrast, the west-south wind should decrease the NOx as the distance; however, the wind speed is more important, finally in downwind (north NCP) rural areas the rate of NOx production is higher than in urban areas. In addition to the influence of wind, NOx emissions in rural areas (indicated above the black box and red line in Fig. 7) also contributed to the production of NOx; therefore, in rural areas the NOx production rate was relatively higher. Finally, the HCHO/NOy ratio is lower in rural areas than in urban areas.
For 2013, HCHO/NOy is greater than 0.6 which is the “NOx limited” regime (Fig. 7b). In southern Hebei, this value was greater than 0.9. Similar to 2010, different ranges were presented for urban and rural areas. In urban areas such as BTH, Shanxi, and the northern part of Shandong, it is over 0.9, and it is 0.3-0.8 in rural areas including borders between Hebei-Shanxi, Hebei-Shandong, Hebei-Beijing, etc. and Inner Mongolia. “NOx limited” for 2013 in NCP can be explained by (1) in urban regions, primary emission sources “transportation” for NOx production (50%) (EPA, 2023) were reduced. In Hebei province, the automobile and other mobile belonging to “transportation” were reduced by 11.8%, and secondary emissions sources “energy/energy-industry”, such as electricity plants (20%) (Srivastava et al., 2005; EPA, 2023) for NOx production (40%), was reduced by 20.8%. Therefore, the NOx production rate decreased, and finally became lower than the rate of OH production. This finding is consistent with those reported by Jacob et al. (1995). (2) For VOCs, although “industry” and “transportation” both primarily contribute to the emissions in urban areas, “industry,” especially solvent use, contribute more significantly than mobile (EPA, 2023). In 2013, “industry” solvent use increased by 48.5% (emi_3 in Table 3). Therefore, the OH production rate increased.

Fig. 7. Averaged ratios of HCHO to NOy (= NO + NO2 +NO3 + PAN +N2O5 +HNO3) in May for (a) 2010 and (b) 2013.
O3 production is initiated by the reactivity of VOCs with OH, but also O3-NOx-VOCs sensitivity conditions are associated with the ratio of reactivity-weighted VOCs to NOx (Sillman, 2002). Therefore, it is necessary to understand the fractions of each VOCs species. Focusing on BTH, which is an important area for rice and wheat production, high O3 concentrations (> 0.08 ppmv) and over the health standard level of O3 (> 0.125 ppmv) were observed in May 2010. Most contributing VOCs in the VOCs regime for 2010 and 2013, which is estimated using the reactivity index, and is determined from the VOC concentration and the reaction rate constant with OH radicals, were CH3OH (26.0%, 36.6%), C2H6 (17.9%, 17.7%), C4H8O (16.9%, 10.9%), HCHO (11.3%,11.8%), CH3OOH (5.9%,11.1%), C3H8 (4.6%, 1.6%), C6H12O6 (6.6%,1.2%), C2H4 (3.0%,1.8%), C2H5OH (1.4%, 0.6%) (Table 6).
Table 6. Contributions of 25 VOCs for O3 formation in May in Hebei province in 2010 and 2013.
;%0A%09%09%09newWindow.document.open();%0A%09%09%09newWindow.document.write('<img src=%22./Graphics/image25.jpg%22>');%0A%09%09%09newWindow.document.close();%0A%09%09)
A comparison of VOCs concentrations in May 2010 and 2013 shows that in the urban areas of Hebei, the change in anthropogenic emissions significantly reduced C2H6, C4H8O, C3H8, C6H12O6, C2H4, and C2H5OH (Fig. S2). The primary anthropogenic emission sources of these VOCs were different: C2H6, C3H8, and C6H12O6 were mainly emitted from the transportation sector, whereas C4H8O, C2H4, and C2H5OH were emitted from the residential and industrial sectors. For VOCs emitted mainly from the transportation sectors, the reduction is comprehensible because the emission sources were reduced; however, for VOCs emitted mainly from the industrial and residential sectors, emissions increased (Table 3). This difference indicates that (1) for these low fraction VOCs, C2H4, and C2H5OH, as proposed by Franco et al. (2022), EDGAR inventories underestimated the emissions from industry sectors; (2) for large fraction VOCs, C4H8O, although the emissions from industry sectors increase, however, regarding the “NOx limited” regime in 2013, the OH production rate is relatively high, and C4H8O is mainly reactive with OH radicals; therefore, more C4H8O was consumed. In addition, CH2O is mainly formed as a secondary product during the oxidation of highly reactive VOCs (Parrish et al., 2012); therefore, the reduction in anthropogenic emissions does not have a significant effect on CH2O. For CH3OH, production was not reduced by the reduction in anthropogenic emissions; in contrast, in the north of the NCP, CH3OH increased. According to Emmons et al. (2010), many reactivities are required to produce and consume CH2O; therefore, CH2O is less affected by the reduction of anthropogenic emissions. For methanol (CH3OH), the VOC contributing VOCs in both May 2010 and May 2013, the reduction in anthropogenic emissions was insufficient. This could be explained by the fact that (1) CH3OH is produced from natural gases and (2) CH3OH is produced from coal consumption (Qin et al., 2016); in this study, the coal consumption of Hebei was limited; however, in other provinces such as Shanxi and Tianjin, coal consumption increased, as shown in Table 3; the west south wind breezes these chemicals downwind and finally forms the accumulation north of the NCP. For limiting methanol, a nationwide policy of coal consumption limitation such as CO2 capture and storage (CCS) (Freund, 2013) should be better than a simple provincewide coal consumption limitation. In addition, CH3OOH levels increased with increasing residential emissions. This suggests that to reduce CH3OOH, limiting straw burning in China, especially during the harvesting season, is imperative. Furthermore, there are large uncertainties regarding C5H8, one of the most contributing VOCS to O3 formation potential (Mo et al., 2018; Tatsumi, 2022). In this study, C5H8 was found to contribute less than 1% of the O3 formation potential in May; meanwhile, the concentration (Fig. S2) shows that in 2013, the total C5H8 production over the northern NCP increased. These uncertainties are (1) mentioned by Ma et al. (2023), who found that in May, there are huge differences between using box model estimates and using emission inventories to simulate C5H8; and (2) associated with various factors, such as photosynthetically active radiation and temperature (Situ et al., 2014); therefore, the uncertainty evaluation of C5H8 requires further exploration.
The following can be inferred from this study: (1) the policy of reducing coal combustion emissions in electric power plants reduces the hourly O3 production in May relatively; therefore, this policy should be promoted not only in Beijing and its surrounding regions but also nationwide, especially in the urban areas. (2) The policy of reducing automobiles and other transport events also reduced O3 production. However, it should be noted that neither coal combustion nor transportation can be completely eliminated. Ecofriendly techniques have been suggested to absorb pollutants. For instance, CO2 capture and storage (CCS) (Freund, 2013) and carbon materials-TiO2 (Guo et al., 2022) have been recommended for moderating carbonyl VOCs. (3) For CH2O, as a secondary product of VOC oxidation, the reduction of anthropogenic emissions does not work effectively; therefore, methods such as advanced oxidation processes (AOPs) for limiting CH2O (Guimarães et al., 2012) have been suggested. (4) Although there are uncertainties about the meteorological correlation with O3 production, in this investigation, the May wind breezing downwind contributed to a reduction in the NOx production rate in rural areas. This was suggested by Tatsumi (2022), using an automobile machine to plant or take care of plants before strong winds occur. (5) The emission sources for NOx and VOCs, besides anthropogenic emissions such as lightning, soil, biogenic emissions, and regional transport, remain uncertain and are likely to affect-O3-NOx-VOCs sensitivity. Therefore, biogenic emissions, etc. should be taken care of as well. (6) The significant reduction in C2H6, C4H8O, C3H8, C6H12O6, C2H4, and C2H5OH levels due to the policy suggests that the effect of reducing these precursor gases to specific levels by the model can be anticipated in future studies.
This study has the following limitations: (1) only May was investigated in this study; the meteorological conditions should be different in other months during the crop-growing period; (2) the meteorological factors included in this study are simple, and other factors such as plant boundary layers might affect O3 formation as well. (3) Although, in this study, EDGARs produced appropriate anthropogenic emissions in the energy, residential, and transport sectors, uncertainties remain for VOCs emitted from the industrial sectors. (4) The emission sources and reactivities of VOCs are complex; therefore, the estimation of specific VOCs such as C5H8 may not be sufficient.
The NCP and YRD are the major grain production areas in China. In East Asia, tropospheric O3 concentrations are increasing in tandem with rising emissions of NOx and VOCs, and there are concerns regarding the impact of these emissions on crops. China is focusing its air pollution control efforts on reducing the emissions of NOx, VOCs, and O3 precursors. However, the quantitative impact of anthropogenic emissions on tropospheric O3 (O3-VOC-NOx) has not yet been thoroughly studied. In this study, we investigated the impact of VOCs and NOx on surface O3 formation in the NCP and YRD in China using emission inventories and the WRF-Chem model. Moreover, the cumulative O3 exposure (AOT40) with a threshold value of 40 ppb and a 7-hour average O3 mixing ratio (M7) was used to evaluate the rate of rice and wheat yield and decline in these areas based on the surface O3 concentration distribution obtained by simulation. The results showed that O3-induced damages were approximately 2,345 kt (AOT40) and 999 kt (M7) for rice and 13,947 kt (AOT40) and 3,753 kt (M7) for wheat on a production basis, respectively. Relative yield losses were 5.9 % (AOT40), 2.2 % (M7) for rice and 27.1 % (AOT40) and 9.6 % (M7) for wheat, respectively.
According to an analysis using the effect of anthropogenic emissions on the O3 mixing ratio, (1) policies to reduce coal combustion emissions from power plants and other sources will reduce hourly O3 generation in May; therefore, it was concluded that this policy should be promoted not only in Beijing and surrounding areas but also throughout the country, especially in urban areas, and (2) policies that reduce automobile and other transportation events will reduce O3 emissions. The findings of this study can be used to develop more effective and sustainable cereal cultivation strategies in response to O3 impacts. Future modeling work is needed to improve the accuracy of yield loss predictions by developing exposure-response relationships with less uncertainty and effectively reducing O3 concentrations so that VOC and NOx emissions can be better controlled.
This work was supported by the Japan Science and Technology Agency (PRESTO Grant Number JPMJPR16O3) and by the Japan Society for the Promotion of Science (KAKENHI Grant Numbers 16K18778 and 19K15944).