Crop phenology data extraction from research papers using a large language model
Article ID: D-24-00042

Details
Article ID: D-24-00042
Field experiment data or crop observations at sites reported in agronomic literature are of high quality and have been considered as a potential source of information for the development of a global grid crop dataset. However, extracting data on a crop variable of interest from the text and tables of many papers is a time-consuming, painstaking task for dataset developers. Recent advances in large language models (LLMs) and resulting tools are expected to provide a promising solution. This study presents a computational method for extracting data from research papers using an LLM-based online tool, ChatPDF. The Python program we developed is applied to the 164 papers to extract crop phenology data of maize, soybean, wheat and rice for demonstration purposes. The results show that the LLM-based data extraction method can dramatically reduce the burden of data extraction in human curation, but needs improvement to become a reliable alternative that can replace manual data extraction. In particular, innovations are needed to increase the capture rate by avoiding data omissions and to reduce errors by correctly inferring longitudes, latitudes and harvesting years. The LLM-based data extraction is currently in its infancy and deserves future research for large-scale implementation.
Identifying where, when, how and which crop is grown is key to many large-scale agricultural studies (Kim et al., 2021; You and Sun, 2022). Such studies include crop condition monitoring (Becker-Reshef et al., 2020), pre-harvest yield forecasting (Anderson et al., 2024), climate risk assessment (Marcos-Garcia et al., 2024) and climate change adaptation planning (Rosa et al., 2020). Global grid crop datasets (ex. Iizumi and Sakai, 2020; Ray et al., 2022; Kebede et al., 2024) have contributed to providing such information in a spatially explicit manner. Analyses at the global scale or in developing regions of the world have particularly benefited from such datasets.
Developers use various sources of information to develop grid datasets, such as agricultural censuses, satellite imagery, process model simulations, machine learning techniques and site crop observations. Among others, site crop observations reported in research papers are of high quality, which is a relative advantage over other sources of information. It has been shown that large samples of site crop observations can play a central role in the development of a grid dataset. An example of this case can be seen in Mori et al. (2023), who develop the global crop calendars for 2000 based on 7,530 unique samples from 319 papers and field experiment reports. However, manually extracting data from papers is a time-consuming, painful task that hinders the developers in updating the calendars and expanding them to many crops. Innovative approaches need to be developed to overcome this limitation.
Recent advances in large language models (LLMs), such as the Generative Pre-trained Transformer (GPT), allow dataset developers to access related online tools. Such tools include ChatGPT and ChatPDF, which are based on OpenAI GPT-3.5 or later (Brown et al., 2020; Ouyang et al., 2022). This type of technology has already been used to screen many papers for systematic literature reviews and meta-analyses (Ricciardi et al., 2020; Gartlehner et al., 2024; Guo et al., 2024). There have been increasing attempts to apply the technology to data extraction from papers and the resulting development of datasets. A recent study in material science demonstrates the development of a critical cooling rate dataset for metallic glasses using multiple LLMs that is more than twice the size of previous human-curated datasets (Polak et al., 2024). Therefore, the application of LLMs to the extraction of agricultural data from papers is worth exploring in order to enhance the collection of site crop observations without the tedious task of human curation.
Here we present a computational method for semi-automated data extraction based on an LLM-based tool, ChatPDF, which is capable of processing large numbers of papers and reducing the burden of human curation for dataset developers. The method is applied to 164 agronomic papers reporting crop phenology data of maize, soybean, wheat and rice for demonstration purposes. The performance of the LLM-based data extraction method is assessed by comparison with the manual data extraction. Finally, we discussed the observed behavioral characteristics of ChatPDF and the methodological bottlenecks that need to be considered in the future research.
ChatPDF (ChatPDF GmbH, Laboe, Germany; https://www.chatpdf.com/) is an interactive tool that allows users to upload PDF (Portable Document Format) files and ask questions about their content or receive summaries. It enables users to extract information from the text and tables within the PDF files, making it particularly useful for processing large numbers of PDF files that would be too time-consuming for human curation. By asking specific questions, users can quickly access the information or data they need. In this study, we asked ChatPDF for the dates of occurrence of specific phenological events for the target crops and geographic information on the site locations where crop observations were done. To do this, we developed a Python program using the ChatPDF API (Application Programing Interface) to process many papers in PDF format sequentially in a semi-automated manner (Fig. 1). The example code is available in Supplementary Material File 1.
The computer program was applied to the target papers that contain test data (Section 2.2) and revised according to the results of the performance metrics (Section 2.3) and expert judges using knowledge of agronomic literature and programing. This process was repeated three times to see if the revised program performs better than before. The program was modified through trial and error, aiming to extract as much as possible data values for crop phenology and geographical variables from the given papers. In short, the first program tried to extract the geographic variables and all of the phenology variables at once regardless of a phenological variable of interest is common across the crops (sowing, emergence, maturity, and harvesting) or crop-specific (silking, transplanting, heading, and flowering). The second program was modified to conduct the data extraction in a more crop-specific manner, but it was found that the geographic variables could still not be accurately collected. The third program attempted to improve the extraction of the geographic variables by repeating the location questions. Each time, the data extracted using ChatPDF were compared with the manually collected data, keeping the samples of the manually collected data the same. The ChatPDF-extracted data were manually converted from text to tabular form. The units of the ChatPDF-extracted data were manually converted when necessary for consistent comparison. For instance, longitude values in the -180° to +180° coordinate were converted to follow the 0° to 360° coordinate. Dates in days after sowing (DAS) were aligned to be those in the day of the year (DOY). This manual conversion of the ChatPDF-extracted data required the analysts heavy workload, which limited our trial-and-error attempts to modifying the program to three times.

Fig. 1.Schematic illustrating the design of this study.
We applied the Python program we developed to the 164 papers to extract 2,664 unique values of crop phenology data. These papers were a subset of the 319 documents listed in Mori et al. (2023) (Fig. 1). The list of the papers we tested here is available in Supplementary Material File 2. The crops studied in Mori et al. (2023) included maize, soybean, spring wheat, winter wheat, single-season rice, dry-season rice and wet-season rice. Dates of sowing, emergence, maturity and harvesting were reported for all crops mentioned above. Some crop-specific phenological dates were also reported, i.e., silking for maize, flowering for soybean, heading and flowering for wheat and transplanting, heading and flowering for rice. We extracted these data using ChatPDF. Of the 319 documents listed in Supplementary Material File 1 of Mori et al. (2023), we were able to retrieve the 164 papers published in peer-reviewed journals. Many of the field experimental reports in the list of Mori et al. (2023) were no longer found in the Internet. However, we believe that the papers used in this study are a good representation of the data reported in Mori et al. (2023) and do not influence our conclusions about the performance of the ChatPDF-based data extraction method. The manually collected data reported in Supplementary Material File 2 of Mori et al. (2023) were compared with the data extracted using ChatPDF to calculate the performance metrics.
2.3. Performance metricsTo assess the performance of the ChatPDF-based data extraction method, we used the three metrics: capture rate, mean absolute error and hallucination rate. The capture rate is the proportion of the number of cases in which ChatPDF extracted a numeric value for a given crop and phenological event, expressed as a percentage of the total number of cases in which a numeric value was extracted manually (i.e., capture rate=A/N1; Fig. 2). The mean absolute error (MAE) measures the average discrepancy between the values extracted manually and those extracted using ChatPDF in all cases where numeric values were obtained for both of the data extraction methods (i.e., MAE can only be calculated for A; Fig. 2). The hallucination rate is the percentage of cases where no data value was manually extracted from cases where ChatPDF extracted a numeric value (i.e., hallucination rate=C/M1; Fig. 2). These metrics were calculated for each crop and phenological variables (e.g., emergence). We assumed that the manually extracted data were correct references, i.e., there was no human error in the manual data extraction.

Fig. 2.Contingency table used to calculate the performance metrics.
There were some improvements in performance in the third trial of the computational program, particularly for capture rate, compared to the first and second trials. However, the improvements were not systematic across the phenological and geographic variables and across the performance statistics, as exemplified by the decrease in the capture rate for the heading date from the first to the latter trials (Fig. 3). In the third trial, the increase in the capture rate was most pronounced for longitude, latitude, sowing year and harvesting year. However, an increase in hallucination rate was also found for the harvesting year in the third trial. This increase in hallucination rate was notable for the soybean and spring wheat harvesting years (Supplementary Material File 3). Although both a larger and a smaller MAE value were observed in the third trial than in the previous trials, the overall MAE values were at a low level, except for the longitude, latitude, and elevation.
If we focused on the results of the third trial, the multi-crop average capture rate was as high as 94.3-95.4% for the sowing and harvesting years, followed by 20.5-66.2% for the geographic variables and 1.5-43.9% for the phenological variables (Fig. 3). Despite the relatively high capture rate in the geographic variables, there was a large quantitative difference with the manually extracted data for the longitude and latitude, as indicated by a multi-crop average MAE value of 3.0° (~334 km at the equator) and 1.5°, respectively. The MAE value was 0.1 years for both of the sowing and harvesting years, with a case of 1.1-1.2 years for the dry-season rice sowing and harvesting years (Supplementary Material File 3). For the phenological variables, the average MAE value ranged from 0.0 to 0.8 days, with the largest case of 2.5 days for the winter wheat emergence date. The multi-crop average hallucination rate was as low as 0.0-1.4%, with an exception of 51.0% for the harvesting year. The high hallucination rate was particularly pronounced for the soybean (93.9%) and spring wheat (66.7%) harvesting years.
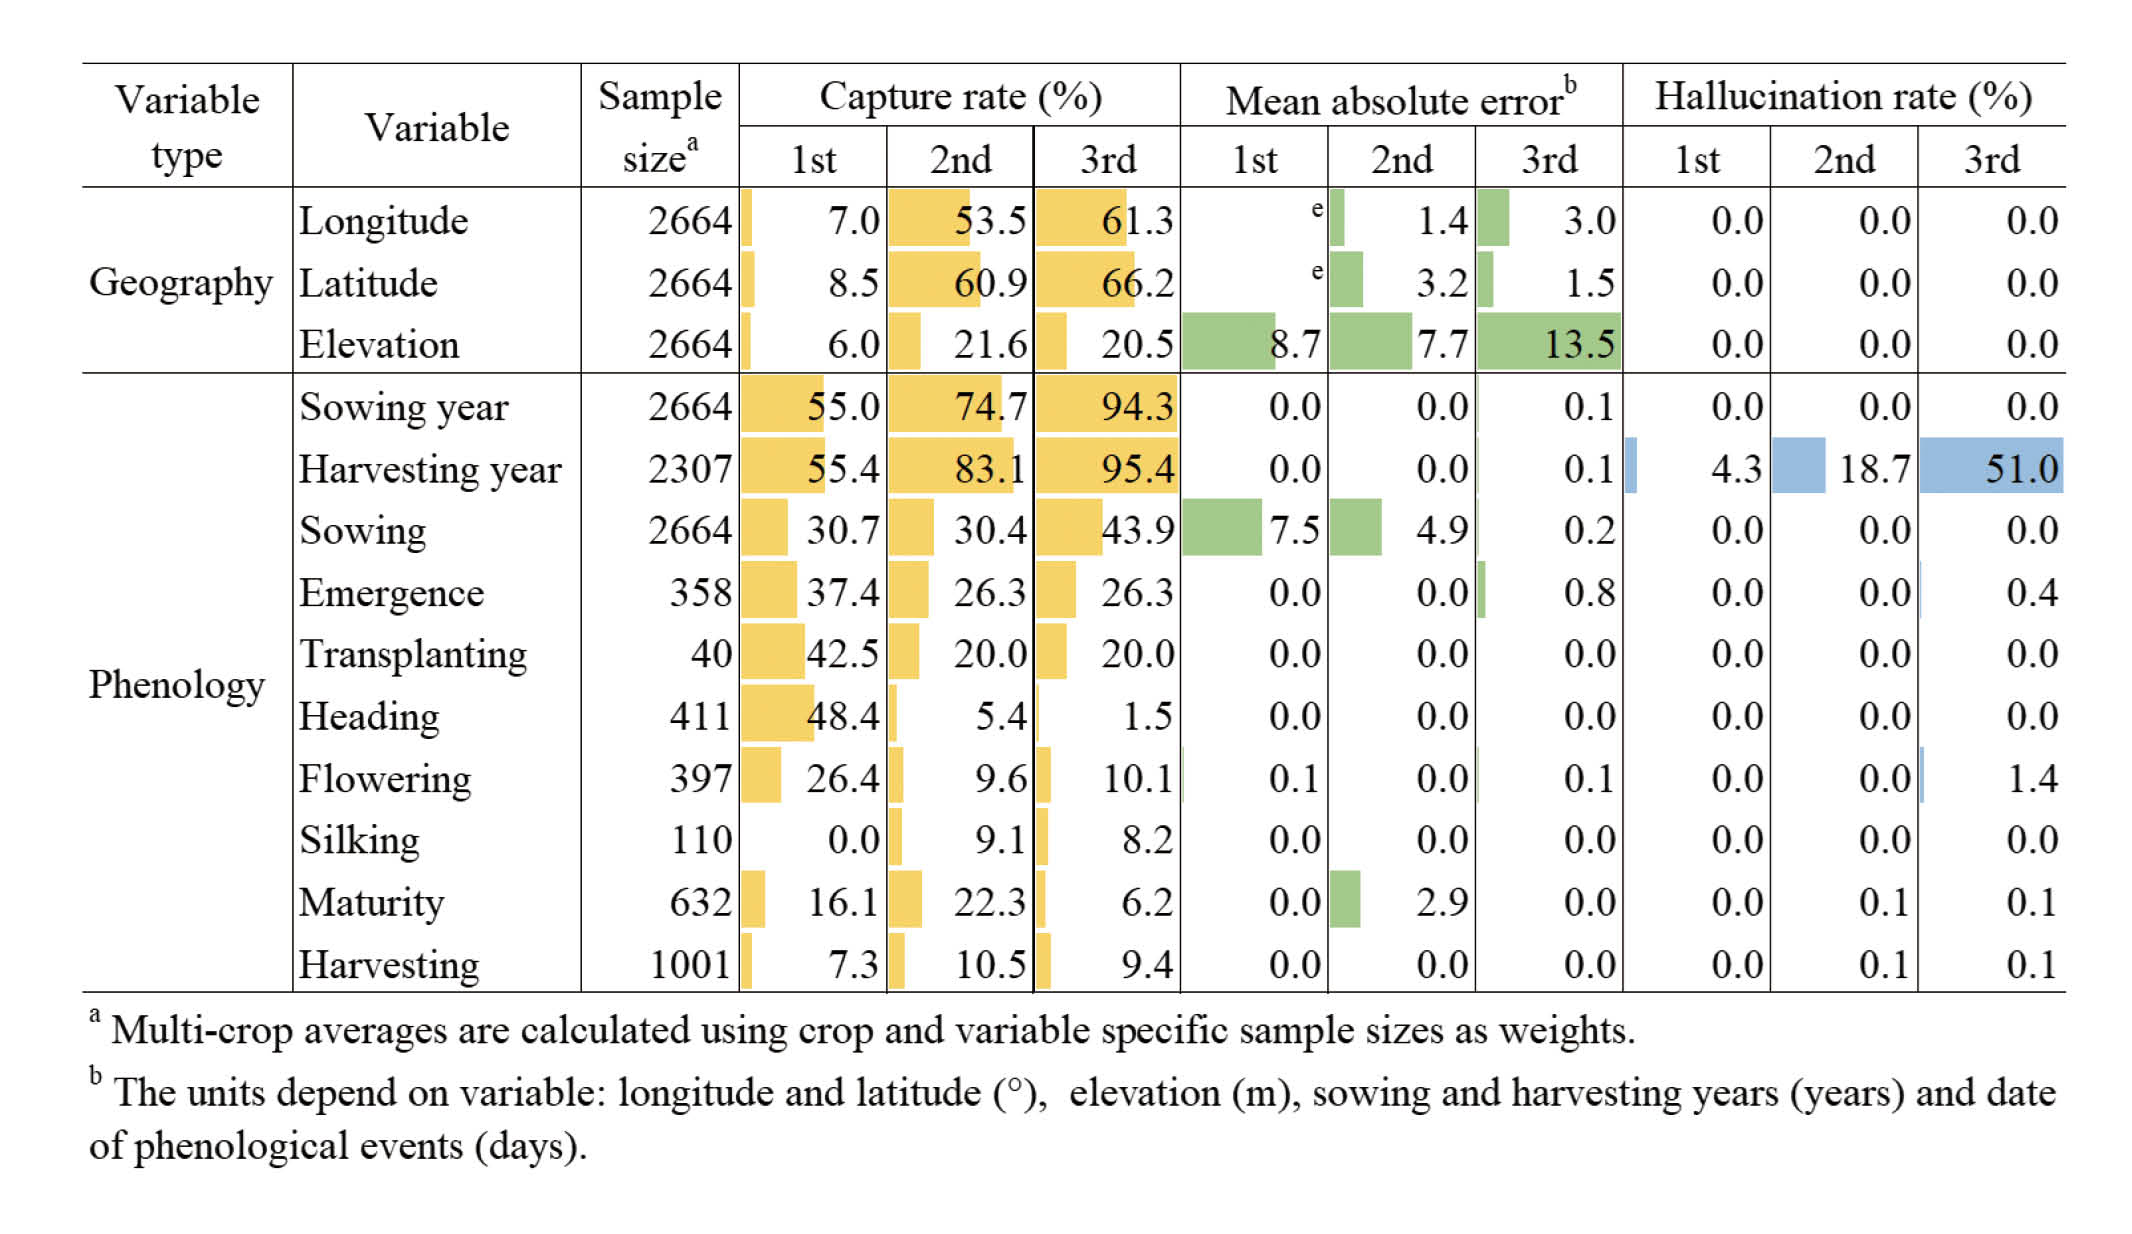
Fig. 3.Changes in the performance of the ChatPDF-based data extraction method due to the modification of the computational program. Data bars showing multi-crop averages of capture rate, mean absolute error and hallucination rate for the geographic and phenological variables of maize, soybean, wheat and rice.
The results indicate that the ChatPDF-based data extraction method has potential, but needs further improvement to replace the manual data extraction. Particularly, the capture rate must be increased by avoiding the omission of data in a paper during data extraction. Data values extracted using ChatPDF are accurate in most cases. The only exceptions are the longitude, latitude and harvesting year, and this deficiency needs to be addressed. The hallucination rate seems to be satisfactory low in most cases. But an exceptionally high hallucination rate in the harvesting years needs to be resolved. Although not an exhaustive list, the following are our observations of ChatPDF’s behavioral characteristics that will help to overcome these deficiencies.
4.1. Errors in the extracted phenology dataThe capture rate is found to be lower for the dates of phenological events than for the geographic variables and the sowing and harvesting years. This would relate to the ambiguity of the terminology used to describe crop phenological events in the papers. For example, “planting” is used as often as “sowing” in agronomic literature. In some papers on rice, “planting” is sometimes used interchangeably with “transplanting”. Text such as “the crop was harvested at physiological maturity” seems to compromise ChatPDF’s ability to extract the correct maturity or harvesting date. The reporting of multiple crops or multiple experiments of a crop in a single paper and the use of DAS units rather than DOY units, which are not rare in agronomic literature, also make it difficult for CharPDF to correctly extract phenological data for the target crops.
The duration of summer crops (maize, rice, spring wheat, and soybean) in the low latitudes and southern hemisphere and that of winter crops (winter wheat) in the northern hemispheres often span two calendar years and is indicated, for instance, as the 2019/2020 or 2019/20 season. This is likely to confuse ChatPDF when extracting harvesting years, and ChatPDF mixes up the sowing year and harvesting year in extreme cases. This explains the large MAE and hallucination rate in the harvesting year. This is particularly the case for the soybean, single-season rice and spring wheat in Brazil and Argentina. The MAE values for the dates of phenological events shown in this study tended to be non-zero when many of the data samples were sourced from these countries. Feeding ChatPDF with this prior information may be worth investigating in the future research.
The performance of the LLM-based crop phenology data extraction presented in this study seems to be worse for the capture rate but better for the hallucination rate when compared to an existing use case in the field of materials science that is based on LLMs different from ChatPDF. Polak et al. (2024) reports 90% precision and 96% recall when extracting critical cooling rate data values for metallic glasses. The performance reported in Polak et al. (2024) can be interpreted as a 96% capture rate and a 10% hallucination rate (by definition, the recall is equal to the capture rate, and the precision is equal to 100 minus the hallucination rate). On a multi-crop average basis, the capture rates for the sowing year (94.3%) and harvesting year (95.4%) are as high as those reported in Polak et al. (2024), while the capture rates for other phenological variables (1.5-43.9%) and the geographic variables (20.5-66.2%) are substantially low. For the hallucination rate, our results (0.0-1.4%) are much better than those of Polak et al. (2024) (10%), except for the high hallucination rate for the harvesting year (51.0%).
4.2. Error in the extracted longitude and longitudeThe reasons for the large discrepancy in longitude and latitude that occurs need to be addressed. This is important because the phenological data extracted using ChatPDF is linked to climate data. Although errors in the elevation data extracted using ChatPDF also exist, errors in the longitude and latitude data are of priority because reliable elevation data can be derived from an existing digital elevation model (DEM) data once correct location is determined. We find that ChatPDF accurately extracts longitude, latitude and elevation information when these values are explicitly reported in a paper. However, ChatPDF returns longitude and latitude information probably via OpenAI ChatGPT when no information is available in a given paper. In the manual data extraction performed in Mori et al. (2023), the analysts infer it using Google Map (https://www.google.co.jp/maps/?hl=ja) with the name of experimental station, if the geographic information is not reported. This explains some, but not all, of the difference between the two data extraction methods, which require a more accurate way of inferring site locations. Apart from collecting crop phenology information, the development of a computer program that specializes in collecting site location information based on generative AI (artificial intelligence) tools that have a strong focus on geographical information could be the way forward in the future.
4.3. Bottlenecks towards improvementsProcessing the 164 papers takes two working days using a standard personal computer and network environment. Although there are no exact records of the paper processing speed using the manual data extraction method, it is thought that the LLM-based data extraction method is at least three times faster than the manual data extraction. More importantly, the first problem is to find the papers that report crop phenology data among many agronomic papers. If the paper an analyst has read does not report any phenology data, it is too tedious for the analyst. However, the LLM-based data extraction method can continue processing many papers, regardless of whether the papers report crop phenology data or not. This advantage of the LLM-based data extraction method becomes clear when it is combined with API services provided by major publishers to allow paid users to access the text data of papers (e.g., https://www.elsevier.com/about/open-science/research-data/text-and-data-mining). Therefore, it is definitely promising to process large numbers of papers without any painful task of human curation.
Apart from the accuracy of the data extraction, there are currently two bottlenecks to improving the ChatPDF-based data extraction method. Most importantly, the process of coding the program, evaluating performance statistics and modifying the program (Fig. 1) needs to be iterated many times in order to develop a computational program that performs better. As the output of ChatPDF is text, it needs to be converted to tabular form before the calculation of the performance statistics. At the moment of writing, this text-to-tabular conversion is done manually and is a time-consuming, painstaking task. For this reason, we limit our iteration to only three times. At the moment of writing, this makes it difficult for us to understand the possible causes for the occurrence of non-systematic changes in the data extraction performance of the program we developed (e.g., the decrease in the capture rate for the heading date after the program modifications). If the cost can be afforded, this text-to-tabular conversion task could be done with OpenAI ChatGPT. Last, ChatPDF allows users to use it for free with 50 queries per day. At the same time, ChatPDF returns an error if the number of questions per unit time exceeds the limit. For asking more queries with certain time interval in an automated manner, a paid plan is required. As asking ChatPDF questions for the same phenology variable or site location in a different phrase increases the chances of successful data extraction, it is important to relax the limit on the number of queries.
4.4. CaveatsThere are some caveats to this study. The version of ChatPDF used here is unable to read images in PDF files, including figures and images composed of scanned text. This limitation increases the omission of data, as crop phenological data are often presented in an illustration (Boonjung and Fukai, 1996). As other tools, such as ChatGPT-4, can read figures, the limitation of ChatPDF may be resolved in the future. Our results are based on the current version of ChatPDF, which is based on OpenAI GPT-3.5 model. Updates to an underlying GPT model in ChatGPT may change the data extraction performance from that shown here.
T.I. was supported by the Environment Research and Technology Development Fund (JPMEERF23S21120) of the Environmental Restoration and Conservation Agency provided by the Ministry of the Environment of Japan; and Grants-in-Aid for Scientific Research were received from the Japan Society for the Promotion of Science (22H00577 and 23H00351).