Abstract
Background: Due to the limitation of spatial resolution, cardiac nuclear medicine images have not been applied to feature-tracking method to automatic extraction of myocardial contours. We have successfully applied the feature-tracking method to high-resolution cine 13N-ammonia positron emission tomography (PET) images to calculate the regional myocardial strains. Here, we investigate the potential of 13N-ammonia PET-derived strain to detect ischemia-related wall motion abnormality.
Methods: Data of adenosine-stress/rest 13N-ammonia PET for 95 coronary artery disease patients was retrospectively analyzed. Using an original algorithm dedicated to 13N-ammonia PET, the longitudinal strain (LS) corresponding to the three main coronary artery territories [right coronary artery: RCA, left anterior descending artery (LAD), and left circumflex coronary artery (LCX)] was calculated from semi-automatic endocardial contours extraction on cine 13N-ammonia PET images of the left ventricular long-axis. The presence of ischemia in three main territories was determined from rest and stress-perfusion images.
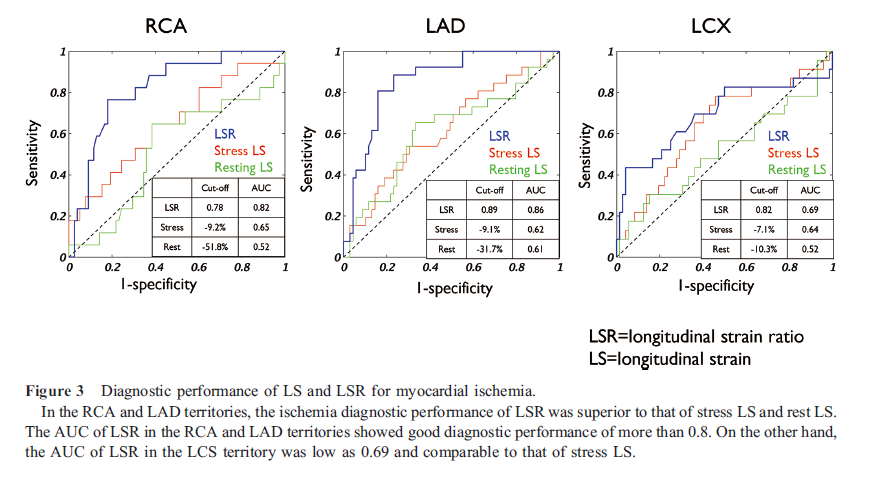
Results: In all three coronary territories, LS at stress was significantly smaller at rest in the ischemic region RCA: -19.2±8.0% vs. -22.7±6.1%, LAD: -19.0±6.9% vs. -24.4±6.4%, LCX: -20.5%±7.6% vs. -22.6±6.9%). In contrast, in the non-ischemic region, there was no significant difference between the LS at stress and at rest. Receiver-operating-characteristic analysis revealed that using the optimal cutoff of the LS ratio of stress to rest, ischemia could be diagnosed with area under the curve of 0.82 in the RCA, 0.86 in the LAD, and 0.69 in the LCX.
Conclusions: Myocardial strain derived from endocardial feature-tracking of 13N-ammonia PET cine imaging is reduced in the ischemia induced by adenosine-stress. The LS ratio of stress to rest may detect wall motion abnormality related to ischemia.
Due to the limitation of spatial resolution, cardiac nuclear medicine images have not been applied to feature-tracking method to automatic extraction of myocardial contours. Therefore, in myocardial single photon emission computed tomography (SPECT), electrocardiography (ECG)-gated images and the Quantitative gated SPECT algorithm are used to measure ventricular volume and function (1). Recent positron emission tomography-computed tomography (PET-CT) scanner equipped with time-of-flight correction has achieved high spatial resolution with excellent detector sensitivity. Myocardial 13N-ammonia PET enabled the delineation of papillary muscles, which are characteristic of left ventricular structures (2). The feature-tracking method utilized in cardiac cine magnetic resonance imaging (MRI) has the advantage of allowing semi-automatic calculation of reginal myocardial strain and retrospective analysis without the need for special scanning (3). We have successfully applied the feature-tracking method to high-resolution cine 13N-ammonia PET images to calculate the regional myocardial strains (4). Here, we investigate the potential of 13N-ammonia PET-derived strain to detect ischemia-related wall motion abnormality.
Materials and methods
Patients
This retrospective study evaluated 95 patients who, as part of a previous study (January 2017 to January 2019), underwent resting/stressed myocardial 13N-ammonia PET because of known or suspected coronary artery disease. This study was approved by the appropriate institutional review board, and the requirement for written informed consent was waived. None of the patients had congenital heart disease, heart failure, or a transplanted heart. Cardiovascular risk factors were retrieved from the patients’ medical records at the time of the 13N-ammonia PET. Patient characteristics were summarized in Table 1.
13N-ammonia PET
After the necessary preparations (2), patients were positioned in a three-dimensional PET system (Biograph mCT; Siemens Healthcare, Erlangen, Germany). Repeatedly upgraded Syngo VA30A_HF07 software was used for dose correction (i.e., difference in residual 13N-ammonia activity between resting and stressed images). Sequential computed tomography scans (120 kV, 20 mAs, and 3-mm slice 3 collimation) were acquired for attenuation correction. Immediately after intravenous administration of 13N-ammonia (approximately 185 MBq, 5 mCi), ECG-gated image acquisition was performed (10 min at 16 frames/cardiac cycle using the parallel list mode). After PET myocardial perfusion imaging was performed at rest, the adenosine stress test was performed (0.12 mg/kg/min for 6 min). At 3 min after the vasodilator administration, 13N-ammonia was infused (approximately 555 MBq, 15 mCi) and myocardial perfusion imaging was performed.
Images were reconstructed using Fourier re-binning and filtered back-projection with a 12-mm three-dimensional Hann window for the ramp filter. The reconstructed images were automatically re-orientated to the 16 short-axis, 8 vertical long-axis, and 8 horizontal long-axis cine images. The pixel size of the cine images was 3.2 × 3.2 mm, and the matrix size was 128 × 128, with a 3.0-mm slice thickness. The list mode 13N-ammonia PET data from 2 to 10 min were replayed to reconstruct the ECG-gated images with 16 frames/cardiac cycle. The reconstructed image data with ordered-subsets expectation maximization, point-spread function, and time-of-flight corrections in 13N-ammonia PET, with 21 subsets and four iterations were transferred to a dedicated software (Syngo MI Cardiology; Siemens Healthcare, Erlangen, Germany).
Ischemia assessment via static imaging
The ischemic statuses in the right coronary artery (RCA), left anterior descending artery (LAD), and left circumflex coronary artery (LCX) territories were evaluated based on visual defect scores. The observers had access to polar maps plus 16 short-axis slices, 8 vertical long-axis slices, and 8 horizontal long-axis slices. Severity was determined using a 17-segment model and a semi-quantitative scoring system (0=normal, 1=mildly abnormal, 2=moderately abnormal, 3=severely abnormal, and 4=completely defective) (5). Myocardial ischemia was defined on the basis of summed difference score more than 2 in one territory (6).
Strain analysis based on feature-tracking
Regional myocardial strain was semi-automatically calculated based on using feature-tracking technique (7). All image processing algorithms for stressed and resting PET data were implemented using MATLAB R2020a (version 9.8; Mathworks Inc., Natick, MA). The 4th slice, the center of the 8 vertical long-axis and 8 horizontal long-axis images, was selected for the longitudinal strain (LS) calculation. The regional endocardial border was manually defined at end-diastole on the cine images that were displayed in gray color (gamma=1.3) with a standardized uptake value of 10‒100% (Figure 1A). Endocardium points were evenly spaced based on the line length and automatically tracked during a cardiac cycle, using a local template-matching technique based on normalized correlation coefficient values. The initial size for the template image was set to 24×24 pixels and the search area was set to 32×32 pixels. However, the template size and search area were updated to ensure successful tracking if the endocardium was not well tracked (Figure 1B). The LV endocardial regions were automatically segmented as lines with spline interpolation of the points tracked over a cardiac cycle. Finally, the largest absolute value on the strain curve was defined as LS and was used as the representative value of the patient (Figure 1C). RCA territory was defined as the inferior wall of the vertical long-axis images. LAD territory was defined as the anterior wall to apex of the vertical long-axis images and the septum to apex of the horizontal long-axis images. LCX territory was defined as the lateral wall of the horizontal long-axis images. LS in the LAD was the average of the LS in the two regions (Figure 1A). In addition, stress LS to rest LS ratio (LSR) was calculated as an ischemic parameter.

Intra-observer and inter-observer reproducibility
In the first step of the LS measurement, the reproducibility was examined to manually determine the endocardial boundary. A single observer performed all stressed and resting analyses for 30 randomly selected patients and then blindly repeated the analyses at least 1 month later. Inter-observer reproducibility was evaluated based on stressed and resting measurements for the same 30 patients, which were performed by a second observer who was blinded to the clinical and experimental data. The intra-observer and inter-observer reproducibility of the strain measurements was evaluated using Bland-Altman analyses and the intraclass correlation coefficient (ICC) with one-way random or two-way 5 random single measures. The ICC values were defined as excellent (≥0.75), good (0.60–0.74), moderate (0.40–0.59), or poor (≤0.39).
Statistical analysis
All statistical analyses were performed using GraphPad Prism (version 8.1.2 for Mac OS; GraphPad Software, La Jolla, CA). Differences were considered statistically significant at p-values of <0.05. The Shapiro–Wilk test was used to evaluate the normality of data distribution and mean and standard deviations were calculated. LS and LSR were analyzed using the Wilcoxon rank sum test according to ischemic status (SSS ≥4 vs. <4). Stressed and resting LSs were compared using the paired t-test or Wilcoxon signed-rank test.
Results
Comparison of LS and LSR between ischemia and non-ischemia
There were 17, 26, and 23 patients with ischemia in the RCA, LAD, and LCX territories, respectively. In the ischemic region of all three coronary territories, stress LS was significantly smaller than rest LS (RCA: -19.2±8.0% vs. -24.2±10.1%, p=0.0002, LAD: -19.0±6.9% vs. -24.4±6.4%, p<0.0001, LCX: -20.5%±7.6% vs. -22.6±6.9%, p=0.02). In contrast, in the non-ischemic region, there was no significant difference between stress LS and rest LS (RCA: -22.7±6.1% vs. -23.2±6.0%, p=0.23, LAD: -22.0±6.3% vs. -22.4±6.0%, p=0.38, LCX: -23.6±5.8% vs. -23.6±5/6%, p=0.98). LSR was significantly lower for ischemia than non-ischemia in all three coronary territories (RCA: 0.81±0.13 vs. 0.99±0.16, p<0.0001, LAD: 0.78±0.18 vs. 0.99±0.14, p<0.0001, LCX: 0.90±0.21 vs. 1.00±0.11, p=0.004) (Figure 2).
In the RCA territory, stress LS was significantly smaller in the ischemic region than in the non-ischemic region (-19.2±8.0% vs. -24.2±10.1%, p=0.05). In the LAD and LCX territories, stress LS tended to be smaller in the ischemic region than non-ischemic region, but there was no significant difference. In all three territories, there was no significant difference in rest LS between ischemic and non-ischemic regions (Figure 2).
Diagnostic performance of LSR for ischemia
Receiver operating characteristic analysis revealed that using the optimal cutoff of the LSR 0.78, ischemia could be diagnosed with area under the curve (AUC) of 0.82, a sensitivity of 47%, and a specificity of 91% in the RCA. The optimal cutoff of the LSR 0.89 and 0.82, ischemia could be diagnosed with AUC of 0.86, a sensitivity of 81%, and a specificity of 84% in the LAD, and with AUC of 0.69, a sensitivity of 43%, and a specificity of 96% in the LCX (Figure 3). A typical ischemic case is presented in Figure 4.
Intra- and inter-observer reproducibility
The ICCs for all LS measurements were greater than 0.97, with excellent reproducibility (Table 2).
Discussion
This study proposes a new functional assessment to calculate myocardial strain by applying feature-tracking technique to myocardial 13N-ammonia PET. The calculated strain is decreased in ischemic area during adenosine loading, whereas it is unchanged in non-ischemic area, suggesting that it reflects a reduction in wall motion during ischemia induction. Cine-tagging MRI has reported a decrease in subendocardial strain in ischemic area during adenosine loading (8). The decrease in endocardial contour strain during adenosine loading by PET is consistent with previous cine-tagging MRI results. Transient ischemic dilatation, a known finding in coronary multi-vessel’s disease on SPECT, reflects an increase in left ventricular volume under stress condition. The decrease in LS in ischemic area is proportional to the prolongation of endocardial contours, which may be a factor in the phenomenon of transient ischemic dilatation. The LSR, which indicates these adenosine-loading strain changes, is useful information for diagnosing ischemic area. The ischemia diagnostic performance of LSR was best in the LAD territory and slightly lower in the RCA and LCX territories. This may be because only the LAD territory used the average of two different cine image strains, whereas the RCA and LCX territories used a single cine image strain. It is also possible that the liver accumulation affected the blurring of the contour of the left ventricular posterior wall.
This original algorithm uses the traditional template-matching technique among feature-tracking methods. It is a simple process in which strains can be calculated in about 10 seconds by inputting cine PET images into offline software, and no special post-processing is required. The initial operation requires manual setting of the endocardial contours, but after that, all analysis is automatic. Consequently, the reproducibility of the strain measurements was excellent. Time resolution is an important factor in strain analysis, and the 16 frames/cycle time resolution is inferior to echocardiography, making strain rate evaluation difficult. However, PET strain has been proven to have a significant correlation with cine MRI strain with comparable temporal resolution of 20 frames/cycle (9). In terms of objectivity and reproducibility, it is considered to be no less than echocardiography. In addition, the right ventricular strain is calculated from this algorithm, challenging the evaluation of right ventricular function (10). One limitation of this algorithm is that in the broad infarcts, 13N-ammonia accumulation becomes deficient and the contour disappears. In such cases, it is necessary to fist manually set points at both ends of defect area and have the contour of the defect area estimated. Since PET images have less background noise than SPECT images, this algorithm can track wall motion if the uptake is more than 30%. This suggest small infarct can be analyzed without contour extraction errors. The greatest advantage of the PET scan is that adenosine-stress protocol has been established and both myocardial blood flow and motion can be quantitatively evaluated under stress and resting conditions. Cardiac MRI is not widely used due to the complexity of stress data collection. Echocardiography has limitations in assessing myocardial blood flow and objectively. Myocardial flow reserve obtained from 13N-ammonia PET is a powerful prognostic indicator of coronary artery disease. The combination of PET-derived strain and myocardial flow reserve as new functional indicators can contribute to new treatment strategies for coronary artery disease. Since the coronary territory in this study was determined on the two long axis images without coronary angiography, the actual coronary culprit lesion and coronary territory in this study may be different. This limitation is especially likely to be the case in the RCA and LCX territories.
Conclusion
We applied myocardial feature-tracking to high-resolution cine imaging of 13N-ammonia PET and revealed the clinical value of regional strain by PET. LSR, the strain ratio of adenosine-stress to rest, is decreased in the ischemic area and may detect wall motion abnormality related to ischemia.
Acknowledgments
None.
Sources of funding
This work was supported by JSPS KAKENHI Grant Number 22K07806.
Conflicts of interest
All authors have no conflicts of interest to declare.
References
1. Germano G, Erel J, Kiat H, Kavanagh PB, Berman DS. Quantitative LVEF and qualitative regional function from gated thallium-201 perfusion SPECT. J Nucl Med 1997; 38: 749–54.
2. Nakao R, Nagao M, Yamamoto A, Fukushima K, Watanabe E, Sakai S, et al. Papillary muscle ischemia on high-resolution cine imaging of nitrogen-13 ammonia positron emission tomography: Association with myocardial flow reserve and prognosis in coronary artery disease. J Nucl Cardiol 2020; 29: 292–303.
3. Ishizaki U, Nagao M, Shiina Y, Inai K, Mori H, Takahashi T, et al. Global strain and dyssynchrony of the single ventricle predict adverse cardiac events after the Fontan procedure: Analysis using feature-tracking cine magnetic resonance imaging. J Cardiol 2019; 73: 163–70.
4. Kawakubo M, Nagao M, Yamamoto A, Nakao R, Matsuo Y, Fukushima K, et al. 13N-ammonia positron emission tomography-derived endocardial strain for the assessment of ischemia using feature-tracking in high-resolution cine imaging. J Nucl Cardiol 2022; 29: 2103–14.
5. Cerqueira MD, Weissman, NJ, Dilsizian V, Jacobs AK, Kaul S, Laskey WK, et al. Standardized myocardial segmentation and nomenclature for tomographic imaging of the heart. J Cardiovasc Magn Reson 2002; 4: 203–10.
6. Yoshinaga K, Chow BJW, Williams K, Chen L, deKemp RA, Garrard L, et al. What is the prognostic value of myocardial perfusion imaging using rubidium-82 positron emission tomography? J Am Coll Cardiol 2006; 48: 1029–39.
7. Yamasaki Y, Abe K, Kamitani T, Hosokawa K, Kawakubo M, Sagiyama K, et al. Balloon pulmonary angioplasty improves right atrial reservoir and conduit functions in chronic thromboembolic pulmonary hypertension. Eur Heart J Cardiovasc Imaging 2020; 21: 855–62.
8. Kido T, Nagao M, Kido T, Kurata A, Miyagawa M, Ogimoto A, et al. Stress/rest circumferential strain in non-ischemia, ischemia, and infarction—quantification by 3 Tesla tagged magnetic resonance imaging. Circ J 2013; 77: 1235–41.
9. Kawakubo M, Nagao M, Kikuchi N, Yamamoto A, Nakao R, Matsuo Y, et al. 13N-ammonia positron emission tomography-derived left-ventricular strain in patients after heart transplantation validated using cardiovascular magnetic resonance feature tracking as reference. Ann Nucl Med 2022; 36: 70–81.
10. Kawakubo M, Nagao M, Yamamoto A, Nakao R, Matsuo Y, Kaneko K, et al. 13N-ammonia PET-derived right ventricular longitudinal strain and myocardial flow reserve in right coronary artery disease. Eur J Nucl Med Mol Imaging 2022; 49: 1870–80.