Abstract
Understanding the phylogenetic relationship between Hokkaido Ainu and Ryukyu islanders has been of great interest in human genetics, archaeology, and anthropology. We examined short tandem repeat (STR) polymorphisms on autosomes and Y-chromosomes for Ainu, and compared this with data from Ryukyu islanders. A statistical test for nine autosomal (A-STR) loci gave no indication that the Ainu had experienced any bottleneck effect(s). The genetic distances (Rst) based on the A-STR data consistently showed substantial differentiation between the Ainu and all other populations. The haplotype analysis based on Y-chromosomal (Y-STR) data revealed 10 distinct haplotypes found in 19 Ainu males; 7 out of 10 were Ainu-specific haplotypes, whereas two haplotypes were shared with two males from main-island Okinawa and Miyako island, respectively, indicating a strong, close relationship between the Ainu and the Ryukyu islanders. The time to the most recent common ancestor of the Y-lineages obtained in the Ainu and the Ryukyu islanders was estimated to be 37745 years ago. Overall, the A-STR showed uniqueness of the Ainu, and the Y-STR haplotypes revealed strong evidence for a link between the two indigenous populations of the Hokkaido and the Ryukyu islands.
Introduction
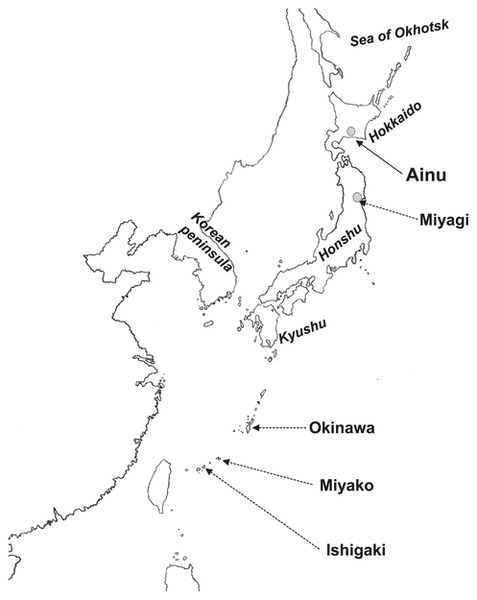
The dual-structure model of Japanese population history claims that the immigrant Yayoi came from somewhere in the East Asia continent to the northern part of Kyushu island between 2000 and several hundred years ago (Figure 1) and admixed with the indigenous Jomon; less admixture occurred between the Jomon and the Yayoi people on Hokkaido and Ryukyu than occurred on the Japanese main island, Honshu (Hanihara, 1991). If this model is true, there should be evidence of a genetic link between remnant populations in Hokkaido and in the Ryukyu island chain including main-island Okinawa and other islands.
Many morphological studies have described a number of similarities between the Ainu and the Ryukyu islanders (Hanihara, 1974; Matsumura, 1994; Fukumine et al., 2006; Haneji et al., 2007). Genetic studies, however, have not always supported the common origin of the Hokkaido Ainu and the Ryukyu islanders. A population tree based on classical markers has shown a close link between Ainu and people from main-island Okinawa (Omoto and Saitou, 1997), while both population trees and gene genealogies based on the hypervariable (HV) region sequences of mitochondrial genome (mtDNA) have not shown any evidence of this close relationship (Horai et al., 1996; Tajima et al., 2004); rather, the Ainu had a relatively closer affinity with the Okhotsk people who lived around the Okhotsk Sea (Figure 1) during the 5th–13th centuries (Sato et al., 2007). Y-chromosomal Alu element present/absent polymorphisms (YAP+/−) (Hammer, 1994) have provided good information about a link between the Ainu and the Ryukyu islanders: the frequency of YAP(+) (Alu present) is very high in the Ainu and main-island Okinawa, lower in Honshu and lowest in Kyushu (Hammer and Horai, 1995; Tajima et al., 2004; Hammer et al., 2006). This result has been confirmed by more intensive study on the Ryukyu islanders; the highest frequency of YAP(+) was found on Miyako island, part of the Sakishima islands in the western part of the Ryukyu island chain, which should have experienced less gene flow from Honshu (Matsukusa et al., 2010). Frequency distributions of Y-haplogroups, defined by a combination of biallelic markers involving YAP and single nucleotide polymorphisms (SNPs) on the Y-chromosome, have shown a close relationship not only between the Ainu and the Ryukyu islanders but also between the Ainu and other ethnic groups from Northeast Asia (Tajima et al., 2004; Hammer et al., 2006). Principal component analysis based on HLA class II have also supported a hypothesis that the Ainu are the direct descendants of the Upper Paleolithic population in Northeast Asia (Bannai et al., 1996).
These discrepancies apparent in autosomal, Y-chromosomal and mtDNA data can be explained by (1) different mutation rates of the markers exhibiting different time scales, and/or (2) the nature of the population structure of the Ainu, including the effect of sex-biased migration (Seielstad et al., 1998; Oota et al., 2001; Matsukusa et al., 2010; Oota and Stoneking, 2011). To resolve this problem, we used short tandem repeat (STR) polymorphisms in this study. Autosomal STR (A-STR) and Y-chromosomal STR (Y-STR) have been used in forensic settings (Kurosaki et al., 1996; Hashiyada et al., 2003, 2008; Kurihara et al., 2004; Kayser and de Knijff, 2011) as well as in anthropological studies (Kayser et al., 2003; Li et al., 2006; Matsukusa et al., 2010). Because Y-STRs have average mutation rates that are 4.53 × 10⁴-fold higher (Kayser et al., 2000) than that of the mtDNA HV region (7.00 × 10⁻⁸/site/year) (Horai et al., 1995), we can detect more recent within- and between-population structure, and estimate the fine range of divergence time between the haploid lineages in local population history. Here we report A-STR and Y-STR data from Ainu, and show that the Ainu have shared a common ancestor with the Ryukyu islanders since the middle of the last glacial period.
Materials and Methods
Population samples
The Asian Archival DNA Repository Consortium provided DNA samples from 49 Ainu individuals collected in the Hidaka district, Hokkaido (Figure 1), by one of us (Prof. EM Dr. Keiichi Omoto) in early 1980s. These are a subset of the same individuals examined in Bannai et al. (1996), Horai et al. (1996), and Tajima et al. (2004). We used these data from 46 individuals in this study as we failed to type three of the 49 individuals owing to potential DNA damage. To compare the Ainu and the Ryukyu islanders, we reanalyzed the A-and Y-STR data published in Matsukusa et al. (2010). The Ryukyu islanders consist of people from main-island Okinawa, the Miyako and the Ishigaki islands (Figure 1). In addition, we used Japanese A-STR data from Miyagi prefecture (Hashiyada et al., 2003, 2008) (Figure 1), the eastern part of main-island Japan, and from Indonesia and Bangladesh (Dobashi et al., 2005) as outgroup populations in the analyses. This research was approved by the ethical committees at University of Tokyo, University of Ryukyus, the Institute of Statistical Mathematics, and Kitasato University School of Medicine.
STR polymorphism typing
A-STR loci (D3S1358, vWA, FGA, D8S1179, D21S11, D18S51, D5S818, D13S317, and D7S820) were genotyped using AmpFLSTR Profiler Plus PCR Amplification Kit (Applied Biosystems, Foster City, CA, USA). Y-STR loci (DYS19, DYS389I, DYS389II, DYS390, DYS391, DYS392, DYS393, DYS385a, DYS385b) (Kayser et al., 1997) were genotyped using the primers described in Matsukusa et al. (2010). The PCRs were carried out using 2–4 ng of DNA in a 15 μl reaction volume. Genotypes were determined by fragment analysis on an ABI3130xl (Applied Biosystems).
Computational analyses
Within-population diversity based on A-STR was calculated using the program Arlequin 3.5.1.2 (http://cmpg.unibe.ch/software/arlequin35/) (Excoffier and Lischer, 2010). Gene diversity (heterozygosity) was estimated by the formula of Nei (1987: p. 180). To detect significant departure from Hardy–Weinberg equilibrium, Fisher’s exact test was done using the Markov Chain Monte Carlo (MCMC) method for all loci (Guo and Thompson, 1992). G-W statistics (Garza and Williamson, 2001) were calculated following the Garza–Williamson (2001) method modified by Excoffier et al. (2005); a value close to “1” represents a “stationary” population size for this particular statistic. The pairwise Rst measure of between-population diversity (Slatkin, 1995) was calculated with 1000 permutations using Arlequin 3.5.1.2 (Excoffier and Lischer, 2010). A phylogenetic network based on Y-STR was constructed by the median-joining method (Bandelt et al., 1999) using the program Network 4.5.1.6 (http://www.fluxus-engineering.com/netwinfo.htm).
We estimated the time to the most recent common ancestor (TMRCA) in Y-STR haplotypes found in the Ainu and the Ryukyu islanders using the program Bayesian Analysis of Trees With Internal Node Generation (BATWING) (Wilson and Rannala, 2003). We investigated the coalescences of all the individuals from the Ainu and from main-island Okinawa, and the Miyako and the Ishigaki islanders. BATWING generated posterior distributions of mutations rates (μ), effective population size (Ne), and TMRCA (scaled using Ne) by Bayesian analysis with coalescent simulations, assuming a constant population size model. Prior distributions were specified as a gamma with a mean of 0.00268 (per locus per generation) for the STR mutation rate and as a log normal with a mean of 4915 for the population size. In each BATWING run, a total of 105 samples were taken after discarding the first 103 samples as “burn-in.” Using the remaining samples, we calculated a median value and 95% credible interval for each posterior distribution of μ, Ne, and TMRCA, respectively. Coalescent dates were translated to chronological time using a 25-year mean inter-generation interval.
Results
Autosomal STR diversity in Ainu
We genotyped nine A-STR loci for 49 Ainu individuals shown in Table 1, calculated heterozygosities, and compared 46 of them with populations in the Japanese archipelago (JPN-A) (Table 2). The average heterozygosity of Ainu (0.755 ± 0.398) was not significantly different from those of non-Ainu JPN-A populations (Miyako: 0.805 ± 0.424; Ishigaki: 0.811 ± 0.427; main-island Okinawa: 0.816 ± 0.430; main-island Japanese: 0.801 ± 0.415). The underlined P-values represent significant departure (<0.01) from the Hardy–Weinberg equilibrium. A few underlined values were observed in Miyako, Ishigaki, and main-island Okinawa, but this could be due to the small sample sizes in these groups. There were no significant departures in the Ainu and main-island Japanese. No evidence of serious bottleneck effect(s) on these populations was also supported by the G–W statistics: rather, the population size of Ainu has likely remained stationary over time.
Table 1
Genotypes of autosomal 9 STR loci in 49 Ainu
|
D3S1358 |
vWA |
FGA |
D8S1179 |
D21S11 |
D18S51 |
D5S818 |
D13S317 |
D7S820 |
| Sample ID |
| AN001 |
16 |
14 |
23 |
12 |
30 |
13 |
11 |
8 |
10 |
|
17 |
15 |
25 |
12 |
32.2 |
14 |
14 |
8 |
10 |
| AN002 |
15 |
14 |
20 |
11 |
30 |
22 |
12 |
12 |
8 |
|
18 |
14 |
23 |
15 |
30 |
22 |
13 |
13 |
8 |
| AN003 |
16 |
14 |
20 |
14 |
30 |
14 |
11 |
11 |
12 |
|
17 |
14 |
22 |
16 |
31 |
14 |
13 |
12 |
13 |
| AN004 |
15 |
14 |
19 |
14 |
? |
11 |
12 |
? |
8 |
|
16 |
15 |
19 |
14 |
? |
11 |
12 |
? |
8 |
| AN005 |
16 |
14 |
20 |
14 |
30 |
13 |
11 |
11 |
12 |
|
16 |
14 |
24 |
14 |
34.2 |
13 |
12 |
12 |
14 |
| AN006 |
15 |
15 |
19 |
15 |
29 |
18 |
12 |
12 |
11 |
|
16 |
18 |
25 |
16 |
31 |
22 |
12 |
14 |
12 |
| AN007 |
17 |
14 |
23 |
11 |
29 |
14 |
12 |
11 |
10 |
|
18 |
14 |
23 |
14 |
29 |
15 |
13 |
12 |
13 |
| AN008 |
15 |
14 |
25 |
13 |
29 |
14 |
11 |
8 |
10 |
|
16 |
19 |
25 |
14 |
31 |
14 |
12 |
8 |
10 |
| AN009 |
15 |
14 |
25 |
14 |
29 |
14 |
11 |
8 |
10 |
|
16 |
14 |
25 |
14 |
32.2 |
14 |
11 |
8 |
12 |
| AN010 |
15 |
15 |
19 |
12 |
30 |
13 |
11 |
8 |
8 |
|
16 |
17 |
23 |
13 |
30 |
18 |
13 |
11 |
10 |
| AN011 |
16 |
17 |
25 |
13 |
29 |
13 |
10 |
8 |
11 |
|
16 |
18 |
25 |
13 |
30 |
14 |
12 |
12 |
12 |
| AN013 |
15 |
14 |
23 |
12 |
30 |
14 |
10 |
8 |
10 |
|
17 |
15 |
25 |
13 |
32.2 |
18 |
11 |
8 |
12 |
| AN014 |
15 |
14 |
21 |
13 |
29 |
13 |
12 |
10 |
10 |
|
18 |
16 |
23 |
14 |
30 |
14 |
13 |
12 |
12 |
| AN016 |
16 |
14 |
23 |
15 |
30 |
13 |
11 |
12 |
10 |
|
18 |
16 |
23 |
15 |
30 |
14 |
12 |
14 |
11 |
| AN017 |
15 |
16 |
23 |
13 |
29 |
13 |
11 |
12 |
10 |
|
15 |
19 |
23 |
13 |
29 |
14 |
12 |
13 |
12 |
| AN018 |
16 |
14 |
18 |
14 |
29 |
14 |
13 |
11 |
8 |
|
17 |
18 |
23 |
14 |
32.2 |
19 |
14 |
14 |
10 |
| AN019 |
15 |
14 |
24 |
10 |
30 |
15 |
10 |
10 |
10 |
|
15 |
17 |
25 |
13 |
30 |
18 |
12 |
10 |
12 |
| AN020 |
15 |
14 |
19 |
13 |
30 |
14 |
13 |
8 |
10 |
|
18 |
19 |
21 |
13 |
32.2 |
19 |
13 |
13 |
13 |
| AN021 |
15 |
16 |
19 |
14 |
29 |
14 |
11 |
12 |
12 |
|
18 |
18 |
24 |
14 |
31 |
14 |
11 |
12 |
12 |
| AN022 |
15 |
14 |
23 |
11 |
28 |
13 |
9 |
8 |
10 |
|
17 |
16 |
26 |
13 |
30 |
15 |
12 |
11 |
11 |
| AN023 |
15 |
16 |
23 |
13 |
28.2 |
14 |
11 |
10 |
11 |
|
15 |
17 |
26 |
13 |
30 |
14 |
13 |
11 |
12 |
| AN024 |
15 |
14 |
20 |
12 |
29 |
15 |
11 |
9 |
10 |
|
17 |
17 |
23 |
14 |
30 |
16 |
11 |
10 |
12 |
| AN025 |
15 |
14 |
23 |
12 |
29 |
14 |
10 |
12 |
11 |
|
17 |
17 |
26 |
14 |
29 |
16 |
14 |
12 |
12 |
| AN026 |
15 |
14 |
20 |
12 |
31 |
15 |
10 |
11 |
10 |
|
16 |
16 |
23 |
17 |
33.2 |
16 |
12 |
12 |
10 |
| AN027 |
16 |
14 |
24 |
13 |
29 |
14 |
11 |
8 |
8 |
|
17 |
16 |
25 |
14 |
30 |
15 |
13 |
13 |
14 |
| AN028 |
16 |
14 |
19 |
13 |
29 |
14 |
11 |
13 |
8 |
|
17 |
14 |
23 |
14 |
29 |
14 |
11 |
14 |
8 |
| AN029 |
15 |
14 |
21 |
10 |
29 |
14 |
11 |
11 |
9 |
|
17 |
17 |
22 |
10 |
29 |
14 |
14 |
12 |
12 |
| AN030 |
16 |
14 |
20 |
11 |
29 |
14 |
11 |
11 |
10 |
|
16 |
14 |
23 |
14 |
30 |
15 |
12 |
11 |
10 |
| AN031 |
16 |
17 |
23 |
12 |
29 |
13 |
11 |
11 |
11 |
|
18 |
20 |
26 |
13 |
30 |
13 |
12 |
11 |
12 |
| AN032 |
15 |
14 |
25 |
12 |
29 |
14 |
10 |
12 |
10 |
|
17 |
16 |
25 |
14 |
29 |
16 |
10 |
13 |
12 |
| AN033 |
15 |
14 |
19 |
11 |
29 |
14 |
10 |
10 |
10 |
|
17 |
18 |
23 |
13 |
32.2 |
16 |
10 |
14 |
11 |
| AN034 |
15 |
14 |
24 |
10 |
29 |
22 |
11 |
12 |
8 |
|
15 |
19 |
26 |
14 |
30 |
23 |
13 |
13 |
12 |
| AN035 |
15 |
14 |
21 |
12 |
28 |
15 |
11 |
12 |
10 |
|
16 |
17 |
22 |
14 |
31 |
16 |
11 |
12 |
11 |
| AN036 |
15 |
14 |
23 |
14 |
29 |
14 |
10 |
12 |
8 |
|
15 |
15 |
24 |
14 |
29 |
14 |
14 |
12 |
11 |
| AN101 |
16 |
14 |
23 |
14 |
29 |
14 |
12 |
11 |
11 |
|
17 |
14 |
23 |
14 |
29 |
15 |
13 |
12 |
13 |
| AN102 |
15 |
17 |
20 |
13 |
28.2 |
14 |
11 |
8 |
10 |
|
18 |
18 |
23 |
15 |
31 |
18 |
13 |
14 |
13 |
| AN103 |
15 |
14 |
23 |
13 |
29 |
14 |
9 |
9 |
11 |
|
15 |
18 |
25 |
14 |
29 |
14 |
14 |
11 |
12 |
| AN104 |
15 |
14 |
23 |
13 |
28 |
13 |
10 |
11 |
10 |
|
16 |
17 |
26 |
14 |
31 |
14 |
12 |
11 |
11 |
| AN105 |
15 |
14 |
19 |
13 |
29 |
13 |
10 |
11 |
12 |
|
17 |
14 |
23 |
14 |
30 |
14 |
13 |
12 |
12 |
| AN106 |
15 |
14 |
23 |
12 |
29 |
14 |
10 |
11 |
12 |
|
17 |
18 |
25 |
13 |
29 |
14 |
14 |
12 |
12 |
| AN107 |
15 |
14 |
24 |
12 |
29 |
14 |
10 |
8 |
10 |
|
15 |
18 |
25 |
13 |
30 |
15 |
12 |
10 |
12 |
| AN108 |
15 |
14 |
19 |
13 |
29 |
13 |
9 |
8 |
10 |
|
17 |
19 |
22 |
14 |
30 |
13.2 |
13 |
9 |
13 |
| AN109 |
15 |
14 |
19 |
13 |
29 |
? |
9 |
8 |
? |
|
18 |
20 |
19 |
14 |
30 |
? |
11 |
14 |
? |
| AN110 |
15 |
14 |
20 |
13 |
27 |
13 |
11 |
8 |
10 |
|
16 |
17 |
25 |
13 |
30 |
18 |
13 |
12 |
12 |
| AN111 |
16 |
14 |
23 |
11 |
30 |
14 |
11 |
9 |
10 |
|
17 |
17 |
23 |
15 |
32.2 |
14 |
11 |
12 |
11 |
| AN112 |
17 |
14 |
23 |
13 |
29 |
14 |
12 |
12 |
10 |
|
17 |
19 |
25 |
14 |
31 |
15 |
12 |
12 |
11 |
| AN114 |
16 |
19 |
? |
10 |
29 |
14 |
12 |
8 |
11 |
|
18 |
19 |
? |
13 |
32 |
14 |
12 |
12 |
12 |
| AN115 |
15 |
17 |
21 |
13 |
29 |
13 |
11 |
10 |
11 |
|
18 |
17 |
23 |
14 |
30 |
14 |
13 |
11 |
12 |
| AN116 |
15 |
14 |
19 |
14 |
29 |
13 |
9 |
8 |
8 |
|
17 |
19 |
22 |
14 |
32.2 |
19 |
13 |
9 |
13 |
Table 2
Gene diversity on autosomal 9 STRs
| Populations |
No. of individuals |
|
Autosomal STRs |
Average heterozygosity |
Ref. |
| D3S1358 |
FGA |
vWA |
D18S51 |
D21S11 |
D8S1179 |
D13S317 |
D5S818 |
D7S820 |
| Ainu |
(46) |
Ho |
0.761 |
0.783 |
0.804 |
0.674 |
0.696 |
0.696 |
0.761 |
0.717 |
0.804 |
0.755 ± 0.398 |
present study |
| He |
0.704 |
0.703 |
0.809 |
0.760 |
0.716 |
0.729 |
0.793 |
0.810 |
0.774 |
|
|
| P-values |
0.713 |
0.935 |
0.140 |
0.093 |
0.204 |
0.096 |
0.128 |
0.365 |
0.394 |
|
|
| G-W stat. |
1.000 |
1.000 |
1.000 |
1.000 |
1.125 |
0.818 |
1.000 |
1.000 |
1.000 |
|
|
| Miyako |
(30) |
Ho |
0.633 |
0.800 |
0.833 |
0.833 |
0.600 |
0.767 |
0.833 |
0.867 |
0.933 |
0.805 ± 0.424 |
Matsukusa et al. (2010) |
| He |
0.766 |
0.820 |
0.844 |
0.836 |
0.707 |
0.878 |
0.801 |
0.794 |
0.795 |
|
|
| P-values |
<0.001 |
0.770 |
0.854 |
0.850 |
0.092 |
0.076 |
0.764 |
0.998 |
0.386 |
|
|
| G-W stat. |
0.875 |
0.875 |
1.000 |
1.000 |
1.143 |
0.923 |
1.000 |
1.000 |
1.000 |
|
|
| Ishigaki |
(30) |
Ho |
0.767 |
0.700 |
0.867 |
0.900 |
0.867 |
0.733 |
0.800 |
0.733 |
0.800 |
0.811 ± 0.427 |
Matsukusa et al. (2010) |
| He |
0.756 |
0.812 |
0.897 |
0.839 |
0.784 |
0.864 |
0.756 |
0.819 |
0.776 |
|
|
| P-values |
0.676 |
0.408 |
<0.001 |
0.574 |
0.126 |
0.148 |
0.950 |
0.885 |
0.750 |
|
|
| G-W stat. |
1.000 |
1.000 |
1.444 |
1.000 |
1.286 |
0.846 |
1.000 |
1.000 |
1.000 |
|
|
| Main-island Okinawa |
(28) |
Ho |
0.393 |
0.750 |
0.893 |
0.964 |
0.714 |
0.393 |
0.964 |
0.929 |
0.786 |
0.816 ± 0.430 |
Matsukusa et al. (2010) |
| He |
0.811 |
0.824 |
0.887 |
0.842 |
0.739 |
0.819 |
0.851 |
0.756 |
0.817 |
|
|
| P-values |
<0.001 |
0.280 |
0.924 |
0.264 |
0.758 |
<0.001 |
0.780 |
0.500 |
0.065 |
|
|
| G-W stat. |
1.000 |
1.000 |
0.833 |
1.000 |
1.429 |
0.714 |
1.000 |
1.000 |
1.000 |
|
|
| Main-island Japanese (Miyagi) |
(526) |
Ho |
0.694 |
0.774 |
0.838 |
0.844 |
0.781 |
0.840 |
0.789 |
0.802 |
0.751 |
0.801 ± 0.415 |
Hashiyada et al. (2008) |
| He |
0.702 |
0.791 |
0.863 |
0.836 |
0.789 |
0.861 |
0.799 |
0.804 |
0.759 |
|
|
| P-values |
0.710 |
0.810 |
0.340 |
0.559 |
0.119 |
0.282 |
0.232 |
0.401 |
0.602 |
|
|
| G-W stat. |
0.889 |
1.000 |
1.333 |
1.000 |
1.750 |
1.000 |
1.000 |
1.000 |
1.000 |
|
|
All the data were recalculated in this study.
Ho: Observed heterozygosity.
He: Expected heterozygosity.
Fisher’s exact tests were done using Markov chains for all loci (forecast chain length: 1000000; dememorization steps: 100000).
An underlined P-value represents a significant deviation (at 1% level).
The G-W statistic is supposed to be very small in populations that have been through a bottleneck, and close to 1 in stationary populations.
Secondly, we calculated between-population genetic distances (Rst) based on the A-STR data (Table 3). Comparisons were made between the five JPN-A populations, and added Indonesian and Bangladeshi outgroups. The genetic distance between Ainu and Miyako (0.029) was almost the same as that between main-island Okinawa and main-island Japanese (0.027). Thus, the genetic distances in any pairs of the JPN-A populations with the Ainu were much higher than those among non-Ainu JPN-A populations.
Table 3
Between-population distance (Rst) based on Autosomal 9 STRs
|
Ainu |
Miyako |
Ishigaki |
Main-island Okinawa |
Main-island Japanese |
Indonesia |
| Ainu |
|
|
|
|
|
|
| Miyako |
0.029 |
|
|
|
|
|
| Ishigaki |
0.048 |
0.000 |
|
|
|
|
| Main-island Okinawa |
0.087 |
0.015 |
0.009 |
|
|
|
| Main-island Japanese (Miyagi) |
0.042 |
0.002 |
0.005 |
0.027 |
|
|
| Indonesia (n = 105) |
0.076 |
0.023 |
0.030 |
0.045 |
0.015 |
|
| Bangladesh (n = 127) |
0.034 |
0.004 |
0.025 |
0.051 |
0.012 |
0.021 |
Underlined value present significant population differentiation (P-values < 0.0500) with 1000 permutations.
Minus values are considered as zero.
We genotyped nine Y-STR loci, and found 10 haplotypes in 19 Ainu males (Table 4). Two out of 10 haplotypes were major haplotypes in the Ainu (H1137 and H1138 had six and five, respectively), while eight haplotypes were represented by one male each. To investigate if these haplotypes were shared with any other populations, we searched the Y-STR haplotype reference database (YHRD) (http://www.yhrd.org/), and the published data in the “Yfilter Japan” (Hashiyada et al., 2008) and in the Ryukyu islanders (Matsukusa et al., 2010). Out of 95778 haplotypes from 705 global populations in YHRD, only one haplotype (H1141) was shared with one Korean individual. The Yfilter Japan dataset included 1166 Japanese males from six prefectures, and only H0940 was shared with one individual from the Miyagi prefecture. Further, we found H0845 and H0940 were shared with one individual from the Miyako island and the main-island Okinawa, respectively (Table 4). Seven out of 10 were Ainu-specific haplotypes including 16 males (84%).
Table 4
Y-STR haplotypes and their frequencies
| Haplotypes |
DYS390 |
DYS389 I |
DYS389 II |
DYS385-1 |
DYS385-2 |
DYS391 |
DYS392 |
DYS393 |
DYS19 |
Frequencies |
| Haplogroups |
Ainu |
Ryukyu islanders |
YHRD |
Yfiler-Japan |
| H0845 |
25 |
14 |
17 |
13 |
17 |
10 |
11 |
12 |
16 |
D2a* |
1 |
1 (Miyako) |
0 |
0 |
| H0940 |
25 |
13 |
17 |
14 |
17 |
10 |
11 |
12 |
15 |
D2a* |
1 |
1 (Okinawa) |
0 |
1 (Miyagi) |
| H1137 |
24 |
13 |
16 |
12 |
17 |
10 |
11 |
10 |
16 |
D2* |
6 |
0 |
0 |
0 |
| H1138 |
25 |
13 |
17 |
12 |
16 |
10 |
11 |
12 |
15 |
D2a* |
5 |
0 |
0 |
0 |
| H1139 |
25 |
13 |
18 |
12 |
16 |
10 |
11 |
12 |
15 |
D2a* |
1 |
0 |
0 |
0 |
| H1140 |
25 |
13 |
17 |
14 |
17 |
11 |
11 |
12 |
16 |
D2a1 |
1 |
0 |
0 |
0 |
| H1141 |
23 |
14 |
15 |
11 |
16 |
10 |
11 |
13 |
15 |
C3* |
1 |
0 |
1 (Korean) |
0 |
| H1142 |
23 |
15 |
16 |
11 |
19 |
10 |
11 |
13 |
15 |
C3* |
1 |
0 |
0 |
0 |
| H1143 |
25 |
13 |
17 |
12 |
16 |
11 |
11 |
12 |
15 |
D2a* |
1 |
0 |
0 |
0 |
| H1144 |
26 |
14 |
17 |
12 |
16 |
10 |
11 |
12 |
15 |
D2a* |
1 |
0 |
0 |
0 |
We consider DYS389I and DYS 389II as independent loci, whereas we consider DYS385-1 and DYS385-2 as completely linked.
Haplogroups were defined following the Y Chromosome Consortium (2008). The SNP data were from Tajima et al. (2004) with additional SNPs P99, M116.1, P120, M151.
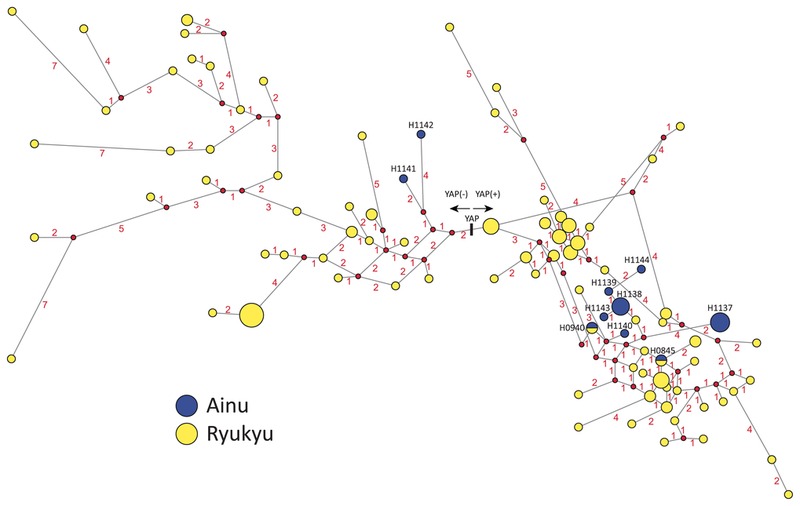
We constructed a phylogenetic network of the Y-STR haplotypes from the Ainu and the Ryukyu islanders, adding the YAP data (Figure 2). Two major Ainu-specific haplotypes (H1137 and H1138) were in the YAP(+) group, and three minor Ainu-specific haplotypes (H1139, H1143, H1144) were likely to be descendants of H1138. Two shared haplotypes (H0845 and H0940) between the Ainu and the Ryukyu islanders (and Miyagi) came to the internal branches, suggesting these were relatively old haplotypes. Meanwhile, H1141 shared between Ainu and one Korean belong to the YAP(−), located on the external branch, suggesting the haplotype was shared relatively recently.
Estimation for Ne and TMRCA
We estimated the effective population size (Ne) and the TMRCA for Y-chromosome lineages based on Y-STR data (Table 5). The estimate of Ne was 616 in Ainu, i.e. much smaller than the 2947 of the Ryukyu islanders. Similarly, the TMRCA estimate of Ainu (18790 years ago) was younger than that of the Ryukyu islanders (38726 years ago). When including all the individuals from Ainu and Ryukyu, the estimates were almost same as those of the Ryukyu islanders alone. These results would suggest that the Ainu and the Ryukyu islanders had a common ancestor around 40000 years ago, corresponding to the middle of the Last Glaciation.
Table 5
Estimates of the time to the most recent common ancestor (TMRCA) for Y-STR haplotypes
| Ainu |
Ryukyu |
All (Ainu + Ryuku) |
| n |
Ne |
TMRCA |
n |
Ne |
TMRCA |
n |
Ne |
TMRCA |
| 19 |
616 (208–2204) |
18790 (2949–152464) |
114 |
2947 (1285–8205) |
38726 (9717–258251) |
133 |
3032 (1355–8072) |
37745 (9842–261006) |
The numbers in parentheses are the 95% credible interval.
“Ryukyu” consists of main-island Okinawa, the Miyako and the Ishigaki islands.
Discussion
Our A-STR analyses have provided an overview of the Ainu within- and between-population diversity. Within the Ainu, no Hardy–Weinberg tests have rejected statistically significant departures in the nine loci, and average heterozygosities have shown substantial within-population diversity (Table 2), suggesting that these Ainu from the Hidaka district have not been isolated genetically, but rather have had constant gene flow from Ainu in other regions. Meanwhile, the Rst values have indicated substantial between-population differentiation in all observed pairs with the Ainu (Table 3), suggesting that there has been less gene flow between the Ainu and the non-Ainu JPN-A populations than those between the non-Ainu JPN-A populations. These data depict that the Ainu have had their own marital network involving substantial diversity, and overall have had no (or very little) contact with the non-Ainu JPN-A populations until very recent years.
Our Y-STR data have provided a peopling history for the Ainu male lineage. Tajima et al. (2004) found three Y-haplogroups based on 14 Y-SNP sites and YAP, whereas this study has found 10 haplotypes based on nine Y-STR loci (Table 4). This is due to the high resolution of STR in the recent peopling events. The observed Y-STR haplotypes (H0845 and H0940) shared between the Ainu and the Ryukyu islanders (Miyako and Okinawa) are obvious evidence of a recent common ancestor, at least in the male lineage. Because Y-STR loci have very high mutation rates (average 3.17 × 10⁻³) (Kayser et al., 2000), it is highly unlikely that this happened just by chance. In fact, if we ignore multiple mutations, and assuming the mutation rate per locus per generation is 0.22% (Kurihara et al., 2004), the 95% credible interval of the posterior distribution of TMRCA between the two identical haplotypes is [0–1875] years. H0940 is also shared with people from the Miyagi prefecture. This finding would agree with part of the dual-structure model that the genetic contribution of the Jomon people is still high in the eastern part of Honshu (Hanihara, 1991), the location of Miyagi prefecture. H1141 is shared with one individual from Korea, which is unlikely to show an ancient relationship between the Ainu and the Korean, because H1141 is located on the external branch of the network (Figure 2): rather, this implies a recent migration. Thus, these data strongly support the hypothesis of the common origin of the Ainu and the Ryukyu islanders.
Our estimates of the TMRCA and the effective population size (Ne) give insight into the ancestral population of the Ainu and the Ryukyu islanders (Table 5). The TMRCA of Y-lineages found in the Ainu and the Ryukyu islanders is 37745 years ago. Since gene divergence should be older than that of populations in general, the divergence time of the two populations should be slightly younger than this estimate. Therefore, the divergence time would be in the late Last Glaciation. Because the Ne of the Ainu (616) is much smaller than that of the Ryukyu islanders (2947) which is the almost the same as the estimate (3032) including both groups, it is likely that the Ainu split from the ancestral population. However, in this study, we have only investigated the diversity of the Hidaka Ainu. We speculate that the ancestral population might have had even greater diversity.
Previous studies have shown discrepancies between Y-haplogroups and mtDNA data (Horai et al., 1996; Tajima et al., 2004). This might be due to different mutation rates between the Y-SNP and mtDNA HV regions. The mtDNA HV region has higher mutation rates and should indicate a more recent history, but no link has been found between the Ainu and the Ryukyu islanders. Both A-STR and Y-STR have revealed a distinct population structure of the Ainu. No evidence of subpopulations in the Hidaka Ainu population has been shown in within-population diversity based on A-STR data. However, sex-biased migration has been observed when comparing mtDNA and Y-STR in the Ainu and the Ryukyu islanders. Two major Y-STR haplotypes (H1137 and H1138) contain 58% of the Ainu males, and three haplotypes (H1139, H1143, H1144) are direct descendants of H1138 in the network (Figure 2). From these data, we propose a hypothesis that the Hidaka Ainu might have a patrilocal marital system (see Oota et al., 2001). 84% of Y-STR haplotypes are Ainu-specific (Table 4), whereas 67% mtDNA HV sequences are Ainu-specific (Horai et al., 1996), suggesting that gene flow from other populations has been more frequent in females than in males. Table 6 shows a comparison between the Ainu and the main-island Okinawa people for within-population diversity. Nucleotide diversity of mtDNA is higher in the Ainu than in the main-island Okinawa people, while gene diversity of Y-STR shows the opposite pattern of mtDNA, suggesting that the Ainu have had more tendency of sex-biased migration than main-island Okinawa people. Thus, the discrepancies observed in Y-chromosome and mtDNA in the previous studies of the Ainu might be explained by the effect of sex-biased migration(s) occurring in ancient East Asian populations (Matsukusa et al., 2010; Oota and Stoneking, 2011).
Table 6
Within-population diversity comparison between the Ainu and the Okinawa main-islanders in maternal and paternal lineages
|
mtDNA (nucleotide diversity) |
Y-STR (gene diversity) |
| Main-island Okinawa |
0.019 ± 0.010a |
0.67 ± 0.36b |
| Ainu |
0.024 ± 0.013a |
0.45 ± 0.26 |
Our data, based on STRs, have revealed the remarkable uniqueness of the Hokkaido (Hidaka) Ainu. The genetic distances based on the A-STR data also suggest that the Ainu have no close relationship with Indonesians or Bangladeshis. This agrees with one cranial morphological study, suggesting the Ainu are the most distinct outliers of all East Asian populations (Hanihara et al., 2003). Meanwhile, this contradicts part of the dual-structure model hypothesizing that the Jomon people originated in Southeast Asia (Hanihara, 1991), if the Ainu are the direct descendants of the Jomon people. STRs are a useful tool for constructing population trees, but to have reasonable resolution, at least 30 A-STR loci are required (Takezaki and Nei, 2008). More STR loci and more population samples will be required to construct accurate trees showing the relationship between the Ainu and other (East, Northeast, Southeast) Asian populations.
Based on the data in this study, we need greater efforts in the near future to understand the peopling of the Japanese archipelago. There is a lack of Y-SNP data for the Ryukyu islanders, which would be required in more intensive analyses on the Y-lineage. Also, we should perform genome-wide (GW) SNP analysis for the Ainu and the Sakishima islanders, as recent GW analysis indicated two clusters for the Japanese populations; however, the Ainu and the Sakashima islanders were not included (Yamaguchi-Kabata et al., 2008). The Pan-Asian SNP data, including approximately 50000 polymorphisms in 1808 individuals from 73 Asian populations (mainly from East and Southeast Asia) (HUGO_Pan-Asian_SNP_Consortium et al., 2009), should be used for an Ainu GW SNP analysis to reveal not only the origin of the Japanese people, but also the history of the peopling of East Asia.
Acknowledgments
This study was supported in part by Grants-in-aid for Scientific Research from the Japan Society for the Promotion of Science (JSPS) No. 22370087 to H.I., No. 19207018 to S.K., Nos. 19570266 and 21370108 to H.O., and was supported in part by a grant from Trans Disciplinary Research Integration Center of Research Organization of Information and Systems to S.N., H.O., N.S., and S.M. We are most grateful to the anonymous Ainu donors from Hidaka, Hokkaido for their great co-operation in this study.
References
- Bandelt H.J., Forster P., and Rohl A. (1999) Median-joining networks for inferring intraspecific phylogenies. Molecular Biology and Evolution, 16: 37–48.
- Bannai M., Tokunaga K., Imanishi T., Harihara S., Fujisawa K., Juji T., and Omoto K. (1996) HLA class II alleles in Ainu living in Hidaka district, Hokkaido, northern Japan. American Journal of Physical Anthropology, 101: 1–9.
- Dobashi Y., Kido A., Fujitani N., Hara M., Susukida R., and Oya M. (2005) STR data for the AmpFLSTR Identifiler loci in Bangladeshi and Indonesian populations. Legal Medicine, 7: 222–226.
- Excoffier L., and Lischer H.E. (2010) Arlequin suite ver 3.5: a new series of programs to perform population genetics analyses under Linux and Windows. Molecular Ecology Resources, 10: 564–567.
- Excoffier L., Estoup A., and Cornuet J.M. (2005) Bayesian analysis of an admixture model with mutations and arbitrarily linked markers. Genetics, 169: 1727–1738.
- Fukumine T., Hanihara T., Nishime A., and Ishida H. (2006) Non-metric cranial variation of early modern human skeletal remains from Kumejima, Okinawa and the peopling of the Ryukyu Islands. Anthropological Science, 114: 141–151.
- Garza J.C., and Williamson E.G. (2001) Detection of reduction in population size using data from microsatellite loci. Molecular Ecology, 10: 305–318.
- Guo S.W., and Thompson E.A. (1992) Performing the exact test of Hardy–Weinberg proportion for multiple alleles. Biometrics, 48: 361–372.
- Hammer M.F. (1994) A recent insertion of an alu element on the Y chromosome is a useful marker for human population studies. Molecular Biology and Evolution, 11: 749–761.
- Hammer M.F., and Horai S. (1995) Y chromosomal DNA variation and the peopling of Japan. American Journal of Human Genetics, 56: 951–962.
- Hammer M.F., Karafet T.M., Park H., Omoto K., Harihara S., Stoneking M., and Horai S. (2006) Dual origins of the Japanese: common ground for hunter-gatherer and farmer Y chromosomes. Journal of Human Genetics, 51: 47–58.
- Haneji K., Hanihara T., Sunakawa H., Toma T., and Ishida H. (2007) Non-metric dental variation of Sakishima Islanders, Okinawa, Japan: a comparative study among Sakishima and neighboring populations. Anthropological Science, 115: 35–45.
- Hanihara K. (1974) Affinities of dental characteristics in the Okinawa Islanders. Journal of Anthropological Society of Nippon, 82: 75–82.
- Hanihara K. (1991) Dual structure model for the population history of the Japanese. Japan Review, 2: 1–33.
- Hanihara T., Ishida H., and Dodo Y. (2003) Characterization of biological diversity through analysis of discrete cranial traits. American Journal of Physical Anthropology, 121: 241–251.
- Hashiyada A., Itakura Y., Nagashima T., Nata A., and Funayama M. (2003) Polymorphism of 17 STRs by multiplex analysis in Japanese population. Forensic Science International, 133: 250–253.
- Hashiyada M., Umetsu K., Yuasa I., Tamura A., Matsusue A., Suzuki K., Kashimura S., and Funayama M. (2008) Population genetics of 17 Y-chromosomal STR loci in Japanese. Forensic Science International: Genetics, 2: e69–70.
- Horai S., Hayasaka K., Kondo R., Tsugane K., and Takahata N. (1995) Recent African origin of modern humans revealed by complete sequences of hominoid mitochondrial DNAs. Proceedings of the National Academy of Sciences of the United States of America, 92: 532–536.
- Horai S., Murayama K., Hayasaka K., Matsubayashi S., Hattori Y., Fucharoen G., Harihara S., Park K.S., Omoto K., and Pan I.H. (1996) mtDNA polymorphism in East Asian populations, with special reference to the peopling of Japan. American Journal of Human Genetics, 59: 579–590.
- HUGO Pan-Asian SNP ConsortiumAbdulla M.A., Ahmed I., Assawamakin A., Bhak J., Brahmachari S.K., Calacal G.C., Chaurasia A., Chen C.H., and Chen J.. (2009) Mapping human genetic diversity in Asia. Science, 326: 1541–1545.
- Kayser M., and de Knijff P. (2011) Improving human forensics through advances in genetics, genomics and molecular biology. Nature Reviews Genetics, 12: 179–192.
- Kayser M., Caglia A., Corach D., Fretwell N., Gehrig C., Graziosi G., Heidorn F., Herrmann S., Herzog B., Hidding M., Honda K., Jobling M., Krawczak M., Leim K., Meuser S., Meyer E., Oesterreich W., Pandya A., Parson W., Penacino G., Perez-Lezaun A., Piccinini A., Prinz M., Schmitt C., and Roewer L.. (1997) Evaluation of Y-chromosomal STRs: a multicenter study. International Journal of Legal Medicine, 110: 125–133, 141–129.
- Kayser M., Roewer L., Hedman M., Henke L., Henke J., Brauer S., Kruger C., Krawczak M., Nagy M., Dobosz T., Szibor R., de Knijff P., Stoneking M., and Sajantila A. (2000) Characteristics and frequency of germline mutations at microsatellite loci from the human Y chromosome, as revealed by direct observation in father/son pairs. American Journal of Human Genetics, 66: 1580–1588.
- Kayser M., Brauer S., Weiss G., Schiefenhovel W., Underhill P., Shen P., Oefner P., Tommaseo-Ponzetta M., and Stoneking M. (2003) Reduced Y-chromosome, but not mitochondrial DNA, diversity in human populations from West New Guinea. American Journal of Human Genetics, 72: 281–302.
- Kurihara R., Yamamoto T., Uchihi R., Li S.L., Yoshimoto T., Ohtaki H., Kamiyama K., and Katsumata Y. (2004) Mutations in 14 Y-STR loci among Japanese father-son haplotypes. International Journal of Legal Medicine, 118: 125–131.
- Kurosaki K., Oota H., Saitoh H., Kiuchi M., and Ueda S. (1996) Sequence variation found in the flanking region of a trimeric short tandem repeat at the PLA2 locus: its considerable effect on estimating alleles. Nihon Hoigaku Zasshi, 50: 1–5.
- Li S.L., Yamamoto T., Yoshimoto T., Uchihi R., Mizutani M., Kurimoto Y., Tokunaga K., Jin F., Katsumata Y., and Saitou N. (2006) Phylogenetic relationship of the populations within and around Japan using 105 short tandem repeat polymorphic loci. Human Genetics, 118: 695–707.
- Matsukusa H., Oota H., Haneji K., Toma T., Kawamura S., and Ishida H. (2010) A genetic analysis of the Sakishima islanders reveals no relationship with Taiwan aborigines but shared ancestry with Ainu and main-island Japanese. American Journal of Physical Anthropology, 142: 211–223.
- Matsumura H. (1994) A microevolutional history of the Japanese people from a dental characteristics perspective. The Anthropological Society of Nippon, 102: 93–118.
- Nei M. (1987) Molecular Evolutionary Genetics. Columbia University Press, New York.
- Omoto K., and Saitou N. (1997) Genetic origins of the Japanese: a partial support for the dual structure hypothesis. American Journal of Physical Anthropology, 102: 437–446.
- Oota H, and Stoneking M. (2011) Effects of Human Migration on Genome Diversity in East Asia. In: Takezawa Y (eds.), Racial Presentations in Asia. Kyoto University Press and Trans Pacific Press, Kyoto and Melbourne, pp. 173–187.
- Oota H., Settheetham-Ishida W., Tiwawech D., Ishida T., and Stoneking M. (2001) Human mtDNA and Y-chromosome variation is correlated with matrilocal versus patrilocal residence. Nature Genetics, 29: 20–21.
- Sato T., Amano T., Ono H., Ishida H., Kodera H., Matsumura H., Yoneda M., and Masuda R. (2007) Origins and genetic features of the Okhotsk people, revealed by ancient mitochondrial DNA analysis. Journal of Human Genetics, 52: 618–627.
- Seielstad M.T., Minch E., and Cavalli-Sforza L.L. (1998) Genetic evidence for a higher female migration rate in humans. Nature Genetics, 20: 278–280.
- Slatkin M. (1995) A measure of population subdivision based on microsatellite allele frequencies. Genetics, 139: 457–462.
- Tajima A., Hayami M., Tokunaga K., Juji T., Matsuo M., Marzuki S., Omoto K., and Horai S. (2004) Genetic origins of the Ainu inferred from combined DNA analyses of maternal and paternal lineages. Journal of Human Genetics, 49: 187–193.
- Takezaki N., and Nei M. (2008) Empirical tests of the reliability of phylogenetic trees constructed with microsatellite DNA. Genetics, 178: 385–392.
- Wilson G.A., and Rannala B. (2003) Bayesian inference of recent migration rates using multilocus genotypes. Genetics, 163: 1177–1191.
- Yamaguchi-Kabata Y., Nakazono K., Takahashi A., Saito S., Hosono N., Kubo M., Nakamura Y., and Kamatani N. (2008) Japanese population structure, based on SNP genotypes from 7003 individuals compared to other ethnic groups: effects on population-based association studies. American Journal of Human Genetics, 83: 445–456.