Original Articles
Geometric morphometric analyses of orbit shape in Asian, African, and European human populations
2013 Volume 121 Issue 1 Pages 1-11

Details
2013 Volume 121 Issue 1 Pages 1-11
The variation of orbit shape has been investigated, especially its role in population classification. However, previous studies that treated orbit shape as a linear metric or non-metric trait have not produced conclusive quantitative data to show whether orbit shape is an accurate reflection of population affinity. Thus, in this study in order to examine regional variation in the orbit shape of contemporary Asian, African, and European populations we use geometric morphometrics with a novel standardization technique. A standardized orbital plane was obtained and each specimen was photographed. The results from this study show that regional variation in orbit shape exists. The Asian orbital contour was generally tall, rounded, and its inferior contour was symmetrical. The European tended to be square and more inclined, with the African being shorter. Moreover, the orbit shape of some specimens from these three regions overlapped. The similarities between the Asian and European samples were much smaller than those between Africans and Asians, or Africans and Europeans. Additionally, intergroup variability was larger on the bones of the maxilla and zygoma which form the inferior contour of the orbit, compared with the frontal bone forming the superior contour. The most variable areas of the orbit concentrate on the internal aspect of the upper margin, on the contours near the frontomalare orbitale and zygomaxillare. The application of geometric morphometrics with the newly developed standardization protocol to examine orbit shape between individuals from different geographic areas, has demonstrated its use to measure quantitatively human orbit shape, variation, and population affinity.
To determine population affinity, methods have been developed that rely on measuring the slight variations in the human skeleton that exist between populations from different areas of the world. The descriptive shapes of certain cranial and dental features have mainly been used, such as the incisors, zygomatic arches, nasal cavity, and contour of the orbital rim (White and Folkens, 2000). The ability to identify population affinity from the skeleton is useful. It allows forensic anthropologists to identify more accurately the skeleton with that of a missing person. More generally, all physical anthropologists use these traits to explore population relationships, trace population origins, and to examine human variation and evolution. Population affinity studies have shown that the role of the eye orbit in determining population affinity cannot be substituted by any other cranial or facial trait (Masters, 2008).
The osseous orbit in humans is a cone-shaped cavum, formed mainly by the frontal, zygomatic, and maxillary facial bones. Its function is to protect and accommodate the eye, as well as the relevant muscles and nerves (Smerdon, 2000). Among modern human groups there is considerable variability in the characteristics of the orbit (Cameron, 1920; Villiers, 1968; Brown and Maeda, 2004; Masters, 2008; Liu et al., 2006; Lu, 2007). The pattern of variability in orbit shape has been investigated through its ontogeny, sexual dimorphism, regional and temporal variation, and its covariation with other cranial or facial traits.
The orbital region was found to display clear variability in its growth rate. The interorbital region changes relatively little after birth, while the lateral wall of the orbit continues to grow throughout childhood, producing a wider adult orbit (Waitzman et al., 1992; Dixon et al., 1997). Recent studies show orbit shape to be highly correlated with orbit volume, supraorbital breadth, facial height, and facial prognathism (Brown, 1992; Brown and Maeda, 2004; Masters, 2008).
The shape of the eye orbit has been used in some studies as a sex-distinguishing characteristic. Brown and Maeda (2004) found that female Australian Aborigines and Tohoku Japanese have relatively higher orbits than the males. Pretorius and colleagues (2006) demonstrated the effective use of orbit shape as a sexual dimorphic trait in Bantu-speaking South Africans. Females had slightly more rounded orbits, whereas males were more elongated and rectangular.
To diagnose population affinity the majority of studies on orbit shape have investigated its regional variation through the isolation of specific features. According to Cameron (1920), the orbit contour of contemporary adult human is generally quadrangular in shape, but varied regionally in the curvature of the four corners. Most studies on orbit shape have mainly involved material from East Asia, Europe, and Africa. Among these studies there are clear discrepancies when describing orbit shape.
Lahr (1996) stated that the orbit shape of East Asians was too variable to be generalized. However, a taller, narrower and more rounded orbit was found to be highly common for East Asian individuals and this was supported by a series of studies (Pan, 1933; Brown, 1992; Brown and Maeda, 2004; Masters, 2008). Other studies have suggested an elliptical or square orbit aperture for Chinese populations (Liu et al., 2006; Lu, 2007).
Villiers (1968) proposed a hypsiconch and rectangular orbit to be characteristic of Bantu-speaking South African populations. Masters (2008), however, proposed that Africans were characterized by a much shorter orbit.
The orbit aperture of most Europeans has been described as having a moderate to pronounced inclined shape (Lahr, 1996). Cameron (1920) also noted that the orbit contours of people from Eurasia have more rounded corners than Africans, while Masters (2008) showed that European samples possessed similar orbital shapes to those of Africans.
In addition to studies on regional variation, temporal differences in orbit shape have been examined in Asian and European populations. The anatomically modern Eurasian has commonly been characterized by a wide rectangular orbit (Wolpoff et al., 1984; Liu et al., 2006). When these were compared with earlier archaic forms before the Upper Paleolithic, the main evolutionary tendency was vertical compression and horizontal elongation (Masters, 2008). However, this tendency seems to be reversed from the Holocene and the orbit tends to be relatively taller, narrower, and generally more rounded (Brown, 1987; Brown and Maeda, 2004; Wu et al., 2007; Masters, 2008).
Orbit shape has also been used to examine models for modern human origins. Lahr (1994, 1996) proposed that the human orbit shape did not show significant regional variation during the late Pleistocene and modern period. Proponents of regional continuity model suggest a quadrangular orbit was common and continuous in China from the Pleistocene to the present (Wu, 2004a, b; Lu, 2007).
The extreme variability in results of the above-mentioned studies indicate the complexity of eye orbit shape. Most of the previous studies on orbit shape were conducted on the basis of linear measurement and derived indices, or a simple description that considered orbit shape as a non-metric feature. Therefore, they provided limited information about the regional variability of orbit shape, and produced different orbit shapes for a single population (Pan, 1933; Villiers, 1968; Brown, 1992; Lahr, 1996; Brown and Maeda, 2004; Liu et al., 2006; Lu, 2007; Masters, 2008).
Lahr (1994, 1996) introduced a new method to examine orbit shape as a complex trait, composed of three elements instead of one. Through the scores of each element, Lahr (1996) argued that orbit shape was highly variable in modern humans, but generally the superior and inferior margins varied in their degree of inclination. Although Lahr’s (1996) method offered progress compared with previous descriptive observations, grading the three elements of the eye orbit remained problematic. For example, as the orbital contour was not constricted to an absolute plane the shape of the same orbit could vary depending on its orientation. Also, orbit variation cannot be fully encompassed in a few elements. The standard of fixing the cranium in the Frankfurt plane and assessing orbit shape from the anterior aspect of the face is inappropriate. It overlooks the fact that individuals vary in their degree of backward inclination for the orbital plane relative to the coronal plane of the cranium.
Compared with traditional descriptive observations and linear measurements, geometric morphometric analyses can preserve more information of the shape (Rohlf, 1995; Adams et al., 2004; Slice, 2007). This approach relies on quantitative analyses and while simultaneously examining size, allows for the comparison of partial transformation and spatial relationships between different aspects of an individual relative to another (Zelditch et al., 2004). This technique is an established method to examine human population affinity (Slice, 2005), and physical anthropologists have come to rely on it. Geometric morphometrics has recently been used to evaluate human orbit shape to distinguish sex (Pretorius et al., 2006).
With the above in mind, the variation of orbit shape has been investigated, in particular its role in population classification. However, studies that treated orbit shape as a linear metric or non-metric trait have not produced conclusive quantitative data to show whether orbit shape is an accurate characteristic to identify population affinity. In this study, we employed a new standardized method using geometric morphometrics to examine quantitatively the eye orbit shape of three broadly defined, geographically diverse groups (Asian, African, and European).
Three samples, which comprise of skeletons from China, Sub-Saharan Africa, and Europe, were selected to represent modern populations from three major geographical areas, i.e. Asia, Africa, and Europe. However, we acknowledge that these small samples do not encompass the full potential variability of these regions. They are rather representations from each region to test whether standardized geometric morphometrics can be used to distinguish broad geographic specific characteristics.
The Asian sample consisted of 40 skeletons, with equal representation from both north and south China, which were sourced from the Institute of Vertebrate Paleontology and Paleoanthropology. The African sample consisted of 39 skeletons collected from nine different Bantu-speaking tribes in South Africa. The European sample comprised of 40 skeletons housed in South Africa. European populations in this country are diverse. While the majority was descendant from the Netherlands, their exact European origins cannot be ascertained. For this study, they were used as a European population representing the broad variation for the region. Both the African and European samples were obtained from the Raymond Dart Collection of Human Skeletons housed at the University of the Witwatersrand (Dayal et al., 2009). For convenience, in the remainder of the manuscript these groups are referred to as Asian, African, and European.
To exclude the influence of age and sex on orbit shape, only male adults under the age of 60 years were used. The European, African, and north Chinese specimens are of cadaver origin; thus, they are accompanied by the original documented biological profile (age, sex, and population affinity). The south Chinese specimens were collected from archeological localities. Their sex was deduced based on cranial and pelvic characteristics, and age was determined using cranial traits, dental eruption, and wear. Additionally, asymmetry may exist between the left and right orbits, and therefore only the left orbit was used.
Standardization of the orbital planeThe plane of the orbital contour is irregular, and consequently orbit shape is affected by many factors, including the angle between the coronal and orbit planes; misclosure of the orbital contour; and the left–right rotation of the face. Additionally, due to the arbitrary anteroposterior projection or constriction of the orbital contour, not all aspects can be contained in a single plane. In order to standardize this, the cranium was placed with its orbital vent facing upward and adjusted until the superior margin of the orbit was in a horizontal position. This was completed while ensuring the highest point of the inferior margin shared the horizontal plane with the superior margin (Figure 1). Subsequently, while encompassing as much of the orbital contour as possible, a standard plane was established to eliminate the influence of backward inclination on the orbital plane relative to the coronal plane. Additionally, to eliminate the influence of left-to-right rotation on shape analyses, a sagittal midline of the face was traced with a hard ruler and aligned vertically with the digital camera body (Figure 1).

To standardize the orbital plane, a sagittal midline of the face was traced with a hard ruler. The superior margin of the orbit was adjusted to the horizontal position and shared the same plane with the highest point of the inferior margin.
After the specimens were adjusted following the standardization procedure above, they were photographed. A Canon EOS-5D equipped with a 24–70 mm lens was used to take high-resolution images of the left orbit. The internal contour and inferior-lateral corner of the orbit can be difficult to view. Therefore, to standardize the photography for analyses, a pencil was used to softly sketch the contour with reference to the overall orbit shape. The camera was fixed to a copy stand. The lens and baseboard of the copy stand were adjusted to the horizontal plane with a level. All pictures were taken by one author and for scale a millimeter ruler was placed parallel to the orbital plane.
Geometric morphometricsGeometric morphometrics is based on landmark coordinate data, and through translation, scale, and rotation (superimposition) it eliminates non-shape information related to position, size, and orientation (Zelditch et al., 2004). This allows major shape differences to be examined through relative warp analyses (similar to principal components analyses) of the partial warp scores, which are derived by bending energy generated through the deformation of specific regions in the structure (Bookstein, 1991, 1996; Rohlf, 1995, 1996; Zelditch et al., 2004). Generalized least squares (GLS) is a superimposition method of eliminating non-shape information by minimizing the sum of squared distances between corresponding points on two configurations (Zelditch et al., 2004; Slice, 2005). It should trace the inclination of the orbital contour as a non-shape element and eliminate it through Procrustes rotation. However, as the degree of inclination for the orbit may be a useful aspect to differentiate populations, the influence of the Procrustes rotation had to be removed (Liu et al., 2010). To achieve this, we modified the studied object and divided the whole orbital contour into superior and inferior portions by the maxillofrontale (mf) and frontomalare orbitale (fmo). Then each portion was mirrored horizontally with the maxillofrontale (mf) as the base point (Figure 2). After reflection, the symmetrical object, rather than the original asymmetrical orbital contour, was analyzed by geometric morphometrics. This did not change the original orbit shape, and can be used to ‘eliminate’ the influence of Procrustes rotation. Because the GLS aims to minimize the least squares between corresponding landmarks or semi-landmarks to actualize the superimposition, it rotated the asymmetrical orbital contour to make the individual configurations match each other as far as possible (Zelditch et al., 2004), while not sacrificing one side to match the other in the horizontally symmetrical contour.

(A) The definition of landmarks, semi-landmarks, and the two divided contours. (B) To eliminate the influence of Procrustes rotation, a mirroring method was used based on the maxillofrontale. For ease of analyses the orbit contour was then divided into four margins. The circles and squares indicate the landmarks and semi-landmarks, respectively.
Separation of the orbital contour into upper and lower sections allowed us to explore shape variation in different aspects of the eye orbit. To follow the principle that each part of the orbital contour had roughly equal length, the superior portion of the orbital contour (formed by frontal bones) was divided by the TpsDig2 program (Rohlf, 1998a) into 30 equal parts, and the inferior portion (formed by the maxillary and zygomatic bones) into 45 equal parts. mf and fmo were treated as the landmarks, while the remaining points divided the orbital contour as semi-landmarks. Bookstein (1999) defined semi-landmarks as loci that have no anatomical identifiers but remain corresponding points. To minimize the effect of the arbitrary location of semi-landmarks along the outline, a combination of sliding techniques was used so the semi-landmarks could be used to explore the shape outline (Bookstein, 1991, 1996, 1997; Bookstein et al., 2002; Adams et al., 2004; Gunz et al., 2005). The TpsDig2 program (Rohlf, 1998a) was employed to collect raw coordinate data in a two-dimensional context and this process was completed by a single author. The TpsRelw program (Rohlf, 1998b) was used to conduct multivariate statistical analyses on these data.
Group comparisonTo compare the mean orbital shape and to test for statistical significance between samples the TwoGroup program was used (Sheets, 2001). In the present study, original coordinates were superimposed using GLS analysis, with specimens rescaled to a centroid size. A bootstrap version of Goodall’s F-test was performed to test whether the shape difference between two samples achieved a significant level.
To quantify the shape difference, the minimized partial Procrustes distance between the mean shape of two samples was also reported (Sheets, 2001; Zelditch et al., 2004).
Canonical variate analysisCanonical variate analysis (CVA) was designed to better assess variation among groups through maximizing intergroup relative to intragroup variability; this method is suitable for samples with high variation among individual specimens (Albrecht, 1980; Zelditch et al., 2004). The first 10 relative warp scores, which account for more than 97% of the total sample variation, were put into SPSS 13.0 statistical software for Fisher linear discriminant function analyses and a standard cross-validation was conducted. The cross-validation procedure is an effective way to test the reliability that each specimen can be correctly discriminated using the tested variables. It is done by omitting one specimen from the sample and a formula is derived based on the variables of the remaining specimens. Then the variables of the omitted specimen are added back into the formula to test if the removed specimen was related to that sample.
On the superior contour the first two relative warps, RW1 (58.5%) and RW2 (24.15%), collectively account for 82.65% of the total variation (Figure 3). Due to the mf being higher than the fmo, specimens distributed in the negative-value area of RW1 tend to be asymmetrical and inclined in the superior contour of the orbit, with the internal margin being constricted. The superior contours of the orbits in specimens at the other end of RW1 were relatively symmetrical, without obvious disproportionate projection or constriction of the partial contour. However, when the mf was lower than the fmo this made the contour appear inclined. Specimens plotted against the positive-value pole of RW2 were shorter and quite symmetrical in the superior contour of the orbit, with the fm being slightly higher than the fmo. Orbits at the other end of RW2 were taller in their superior contour, with the fm being slightly lower than fmo. For these, the internal aspect of the upper margin clearly projects upward, reducing the extent of symmetry in the superior contour.
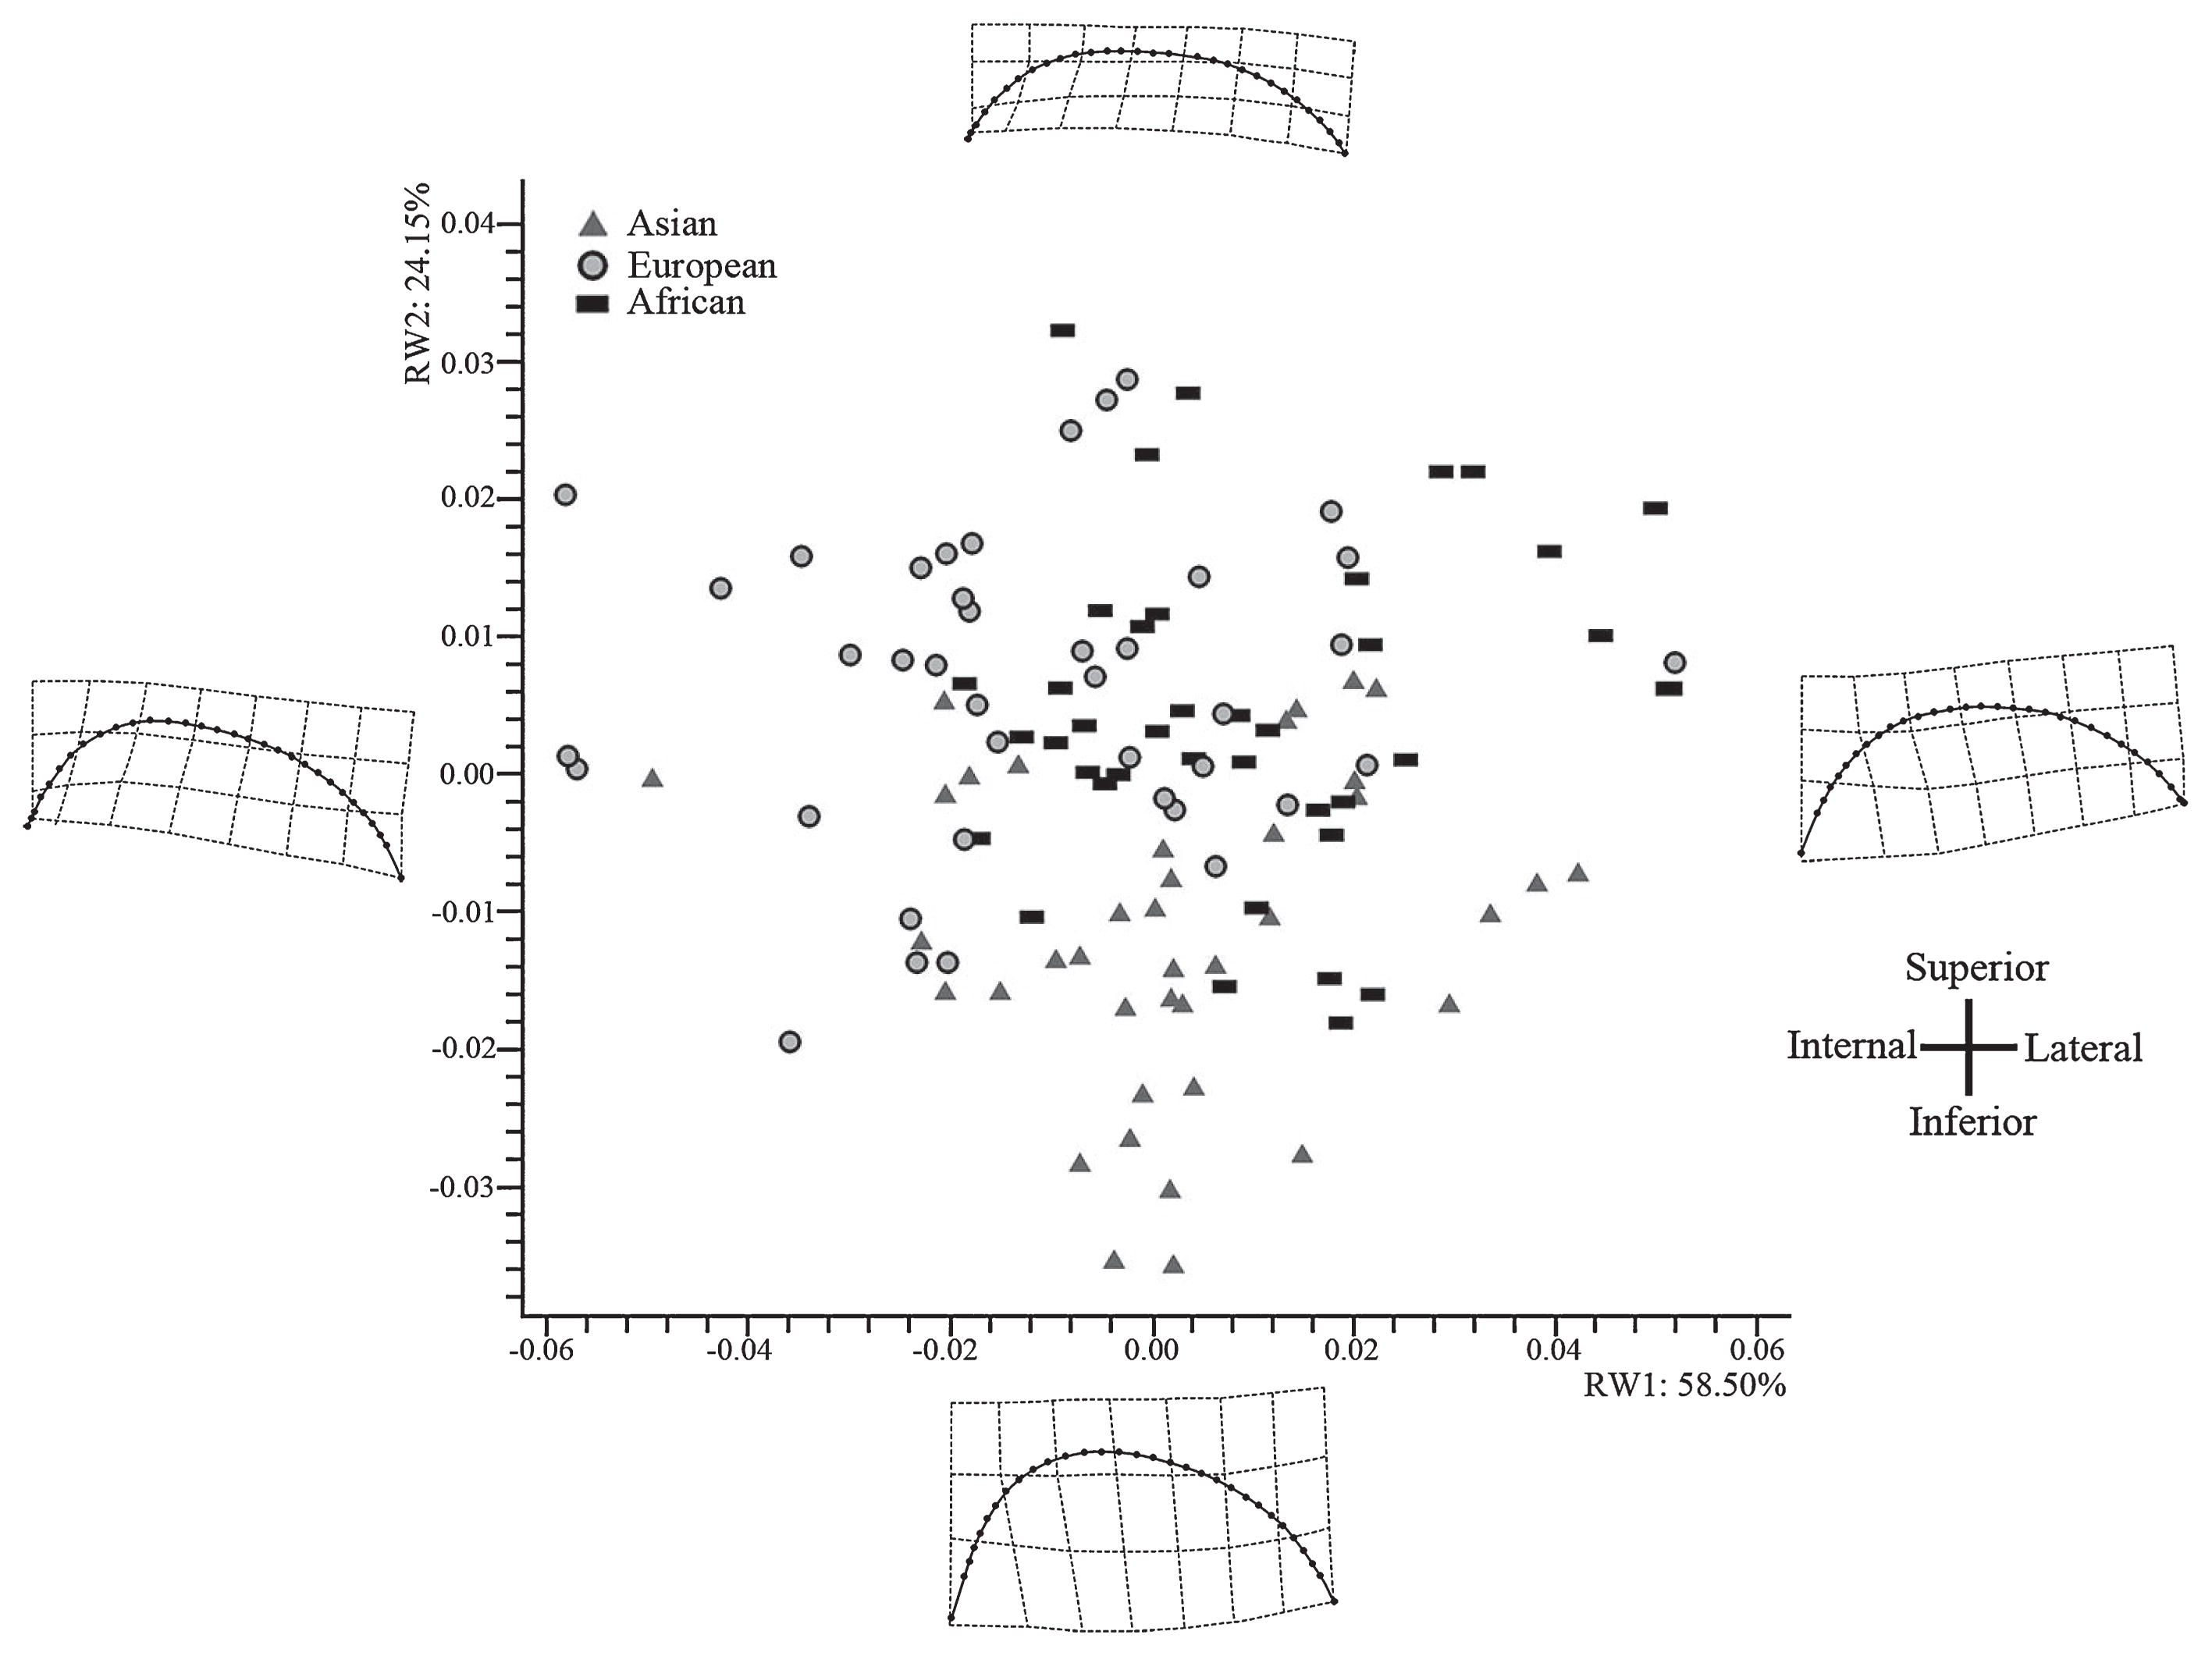
To analyze the superior portion of orbit shape each specimen was distributed against the first two relative warp scores (RW1 and RW2).
Despite the large area of overlapping coordinate data on the superior contour, aspects of specimens from each sample could be discerned from others. The Asian specimens tend to fall toward the negative-value pole of RW2, while most of the European and African specimens were distributed in the positive-value area of RW2. This indicates that the superior contour of the Asian sample was generally taller than that of Europeans or Africans. Based on the distribution of the negative-value area of RW1, the European orbit was characterized by its comparatively more inclined superior contour. In sum, African and Asian specimens share the same distribution area along RW1, while African and European specimens share those along RW2. This suggests that the orbits of the African sample were characterized by a relatively symmetrical superior contour, while Asians and Europeans tend to be asymmetrical, with either a disproportionate increase in the partial contour or complete inclination. Additionally, the overlapping area between Africans and Asians or Europeans was larger than between the latter two.
Relative warp analysis of the inferior contourOn the inferior contour the first two relative warps, RW1 (39.86%) and RW2 (26.6%), account for 66.46% of the total variation (Figure 4). Specimens occupying the negative-value area of RW1 were characterized by a greater inferior contour with the mf placed slightly lower than the fmo. The internal aspect of the lower and lateral margins clearly project, producing a relatively rounded and symmetrical inferior contour. Specimens at the opposite end of RW1 were characterized by shorter inferior contours with the mf being slightly higher than the fmo. For these, the internal aspects of the lower and the lateral margins were constricted, making these areas straight and the whole inferior contour inclined. Specimens distributed in the positive-value area of RW2 tend to have a shorter inferior contour of the orbit with the mf clearly lower than the fmo. The lateral aspect of the lower margin was clearly constricted while the lateral margin slightly projects, producing a relatively symmetrical inferior contour. On the contrary, due to the projection of the lateral aspect of the lower margin and the constriction of the lateral margin, the orbits of specimens taking the negative-value area of RW2 were taller in the inferior contour. This is where fmo was obviously lower than the mf, producing an inclined and asymmetrical inferior contour.

To analyze the inferior portion of orbit shape each specimen was distributed against the first two relative warp scores (RW1 and RW2).
Compared with the other two samples, along the inferior contour the Asian specimens distribute mainly in the negative extreme of RW1, which suggests a relatively taller and more rounded inferior contour with a projected internal aspect of the lower margin and obtuse lateral margin. As the European specimens mainly occupy the lower right corner of the graph, they were characterized by a comparatively more inclined inferior contour with a relatively straight internal aspect of the lower and lateral margins. The African specimens were found towards the negative extreme of RW2, having a shorter inferior contour compared with the other two samples.
Using geometric morphometrics, the African and Asian specimens share the same distribution area along RW2, and the African and European samples along RW1. This suggests that the African sample has a shorter inferior contour, while Asians tend to be taller and symmetrical, with Europeans being more inclined and asymmetrical. Additionally, the Asian and European samples could be fundamentally discriminated from each other, and both of them overlapped over a large area with the African specimens.
Two Group testsTo examine the amount of shape difference among Asian, African, and European populations, a test of significance was conducted by TwoGroup tests (Sheets, 2001). This method compares the average shape of each sample (Figure 5). The orbit shape of the superior contours for each group differs in length, inclination, roundedness, and symmetry. The taller superior contour of the Asian sample was represented by relatively lower positions of mf and fmo, but also by a disproportionate increase in the internal aspect of the upper margin. The inclination of the European sample was mainly due to the taller internal aspect of the superior contour. Finally, the African group was generally shorter and more symmetrical compared with the other two samples.

Comparison of the average orbit shape among the Asian, African, and European samples.
Among these samples the main difference in orbit shape was in the inferior contour. Asian specimens were characterized as being relatively rounded, taller, and symmetrical. European specimens were constricted in the internal aspect of the lower margin and projected in the lateral aspect, with the mf being higher than the fmo; together these make the inferior contour asymmetrical and comparatively more inclined. The level of African symmetry was between those of the other two samples, with the internal aspect of the lower margin not as projected as Asians, but less constricted than Europeans.
All of the orbit shape differences for the African, Asian and European samples were significant (P = 0.01). The superior contour data (Table 1) shows that for average orbit shape the distance between Asian and European samples was greater than either group compared to the African sample. For the inferior contour, the average orbit shape of both Asian and African samples had nearly the same distance from the Europeans.
| European | African | ||
|---|---|---|---|
| Superior contour | Asian | 0.0498 | 0.0262 |
| European | — | 0.035 | |
|
| |||
| Inferior contour | Asian | 0.0449 | 0.0336 |
| European | — | 0.0456 | |
To explore the intergroup variability and relationship of each studied specimen to these three broad regional localities, linear discriminate analyses were used with a cross-validation approach.
Based on the CVA of the shape variables for the superior contour of the orbit, 24 Asian specimens were correctly discriminated, with 6 being assigned to the European group, and 10 to the African group (Table 2). The European sample had the same number of specimens correctly differentiated, while 12.5% clustered with the Asian and 27.5% with the African samples. However, only 41% of the African sample was correctly discerned, with 25.6% clustering with the Asian and 33.3% with the European samples. Overall, the superior contour of the orbit accurately discriminated the regional origins for 53.8% of the studied sample. Although these groups share an overlapping area for orbit shape, 50% of the total sample was distributed beyond this area (Figure 6).
| Group | Predicted group membership | Total | ||||
|---|---|---|---|---|---|---|
|
| ||||||
| Asian | European | African | ||||
| Cross-validated | Count | Asian | 24 | 6 | 10 | 40 |
| European | 5 | 24 | 11 | 40 | ||
| African | 10 | 13 | 16 | 39 | ||
|
| ||||||
| % | Asian | 60.0 | 15.0 | 25.0 | 100.0 | |
| European | 12.5 | 60.0 | 27.5 | 100.0 | ||
| African | 25.6 | 33.3 | 41.0 | 100.0 | ||
53.8% of cross-validated grouped cases were correctly classified (bold face).
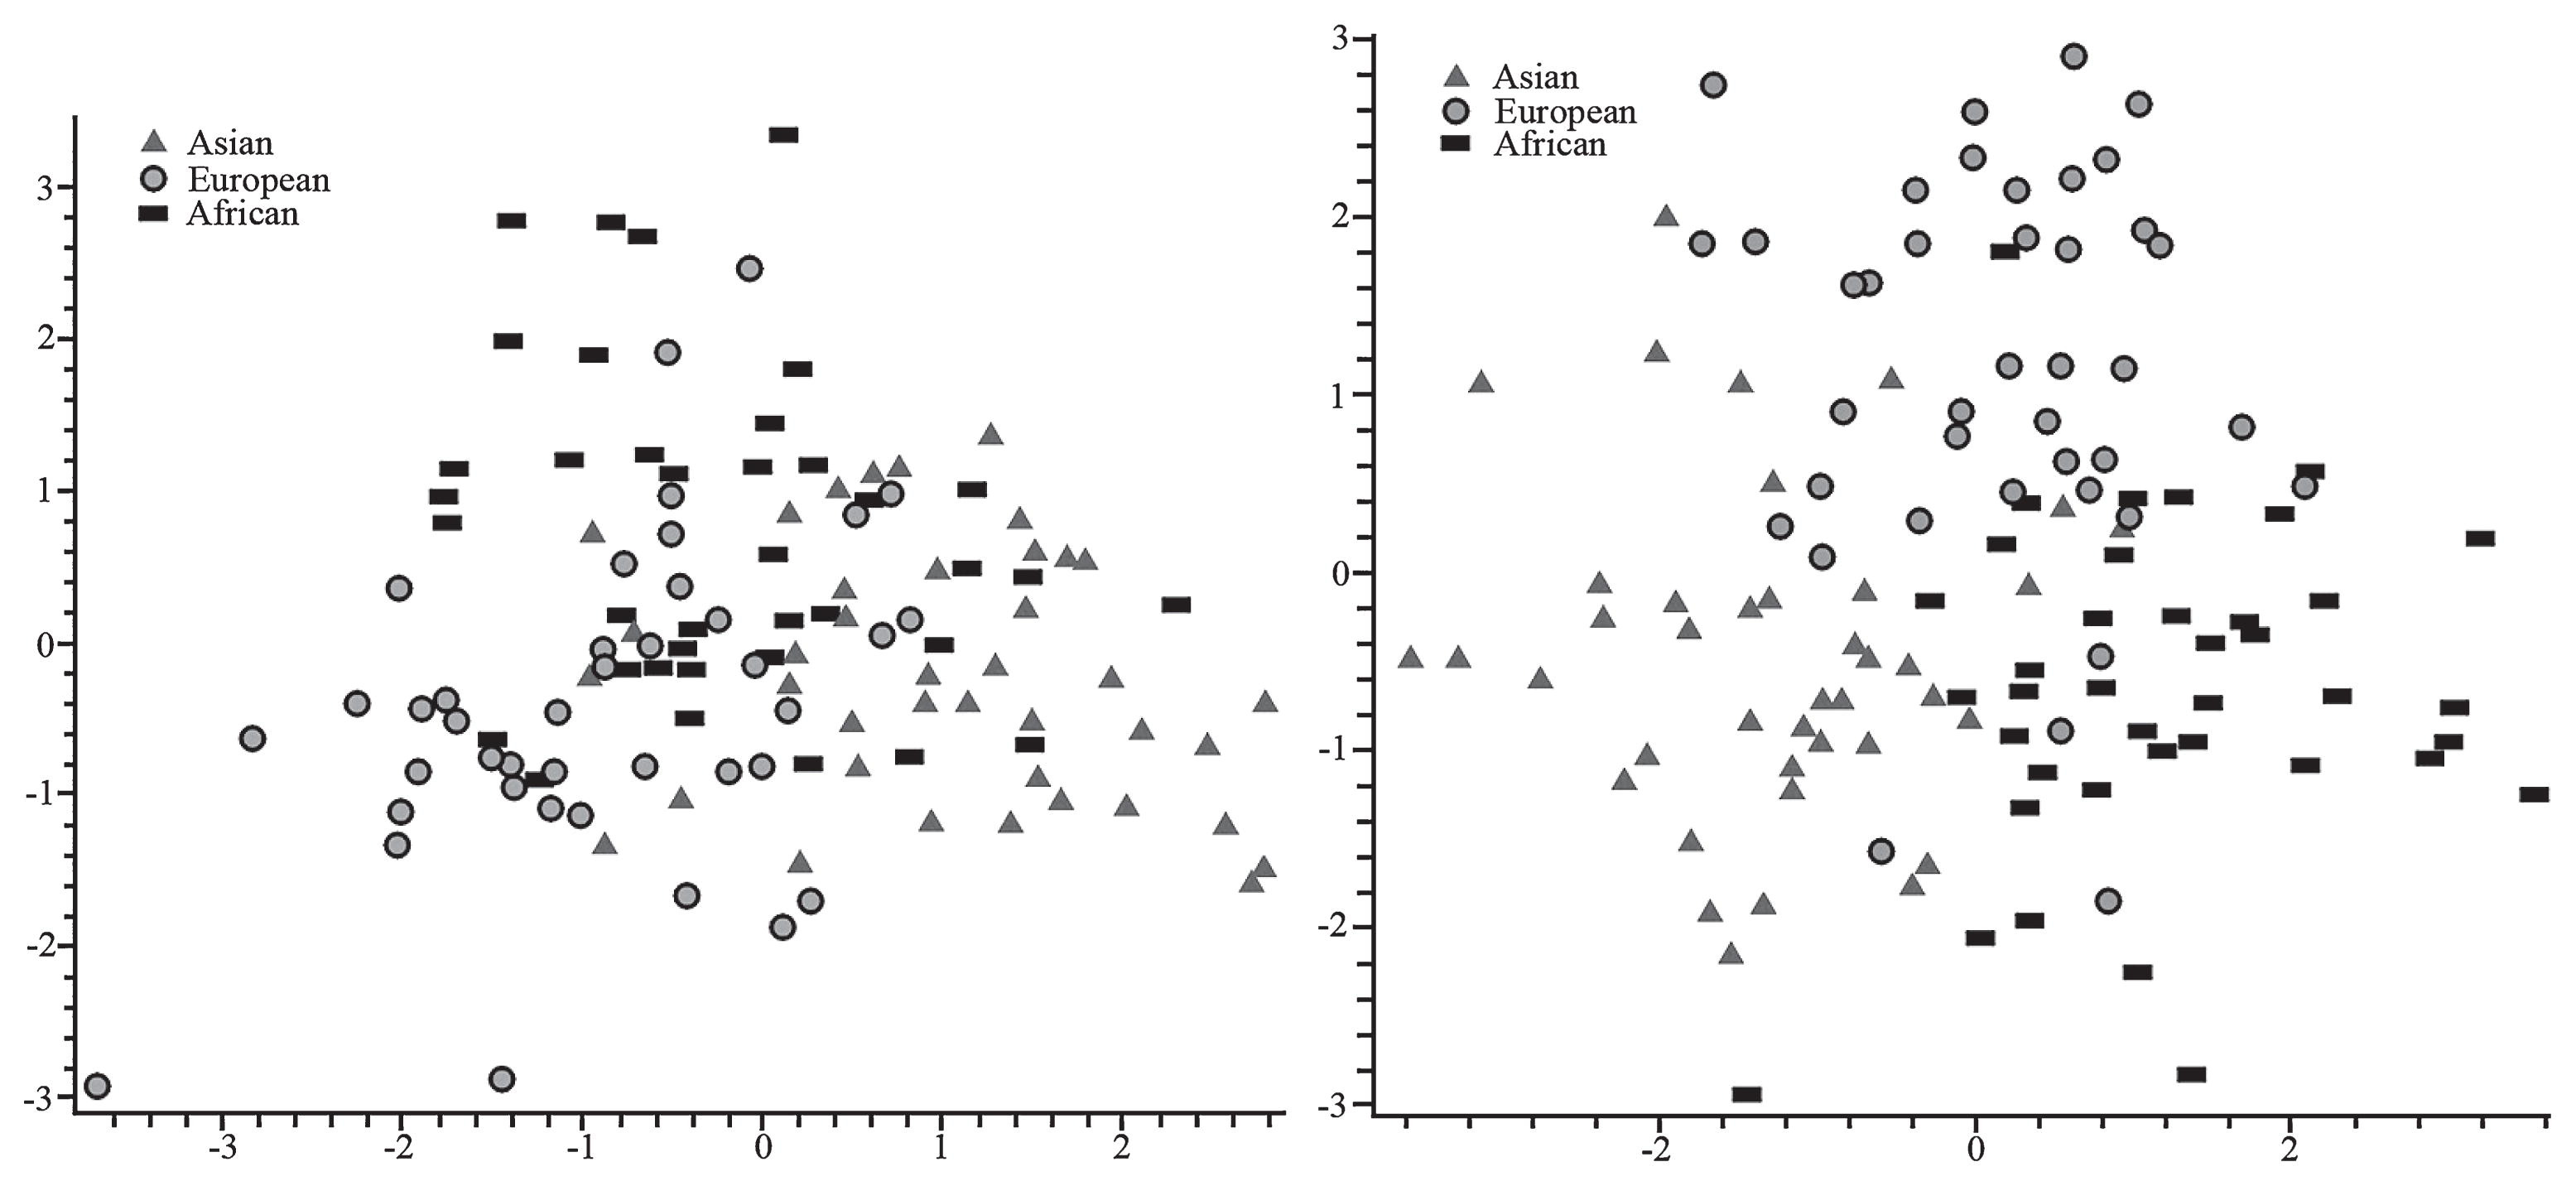
Left: Canonical variate analyses of the superior contour in African, Asian, and European samples. Right: Canonical variate analyses of the inferior contour in Asian, African, and European samples.
The application of CVA to the inferior contour of the orbit correctly discriminated 80% of the Asian sample (Table 3). The remaining specimens were assigned equally to the European and African samples. Both of these samples had 29 specimens correctly assigned. For those incorrectly assigned in the European sample, 12.5% clustered with the Asian and 15% with the African samples. For the incorrectly assigned Africans, four grouped with the Asian and six with the European samples. In total, 75.6% of the studied sample was correctly discriminated into their regionally sourced grouping. This is consistent with the distribution of specimens in Figure 6 that show a small overlapping area among these groups.
| Group | Predicted group membership | Total | ||||
|---|---|---|---|---|---|---|
|
| ||||||
| Asian | European | African | ||||
| Cross-validated | Count | Asian | 32 | 4 | 4 | 40 |
| European | 5 | 29 | 6 | 40 | ||
| African | 4 | 6 | 29 | 39 | ||
|
| ||||||
| % | Asian | 80.0 | 10.0 | 10.0 | 100.0 | |
| European | 12.5 | 72.5 | 15.0 | 100.0 | ||
| African | 10.3 | 15.4 | 74.4 | 100.0 | ||
75.6% of cross-validated grouped cases were correctly classified (bold face).
Overall, from the CVA analyses, it can be stated that compared with the frontal bone formed by the superior contour, the intergroup variability was larger on the bones of the maxilla and zygoma which form the inferior contour.
Scattered landmarks and semi-landmarks analysesExamination of the scattered landmark or semi-landmark distribution allows for variation analysis encompassing overall shape, and further explores the elements contributing to this variation (Figure 7). In this figure, all three samples had landmarks or semi-landmarks distributed in the internal aspect of the upper margin, and the contours near the fmo were more scattered than in the middle area.

Scattered landmarks and semi-landmarks of Asian, European, and African specimens connected by the line of consensus shape. The middle two lines coincide with frontomalare orbitale, and the other two lines mark the upper and lower distribution of this sample.
The most variable area of the inferior contour for all three samples is concentrated on the internal aspect of the lower margin, which shows variation in the amount of constriction or projection. Additionally, compared with other aspects of the inferior contour, the area near the fmo was highly variable, which coincides with great variation on the corresponding area of the superior contour. Moreover, this highly variable area of the lower margin extends more laterally in the European and African samples.
In the present research the method of geometric morphometrics was employed to examine orbit shape in male individuals from three major geographic regions: Africa, Asia, and Europe. Each of these regions is composed of multiple sub-groups with highly diverse morphological features. As stated previously, we are aware that our samples from China and South Africa do not necessarily encompass the full potential variation for each of these regions. However, in this study they are utilized to employ a new standardized method to examine broad regional differences in eye orbit shape.
The developed standardized mirroring geometric morphometric method used in this study produced results that show some overlap in orbit shape between these regionally variable groups. However, the majority of the individuals in each sample correctly clustered with its origin sample. This method allows for the most variable aspects of the orbit in each group to be accurately described. These properties demonstrate the utility of the proposed method to quantitatively measure human orbit shape and variation.
The results show that similarities and differences in orbit shape exist between these three broad populations of the world. They are related to the extent of their height, symmetry, degree of inclination and roundedness. The orbit shape of the superior contour formed by the frontal, and the inferior contour formed by the zygoma and maxilla, show a large area of similarity among these populations. Despite this finding, it was possible to trace regional traits using orbit shape (Figure 8).

The typical orbit shape of populations from (A) Asia; (B) Europe; (C) Africa. The white points indicate the maxillofrontale and frontomalare orbitale. The Asian orbital contour tends to be taller with a relatively symmetrical inferior contour and asymmetrical superior contour, which is due to the disproportionate increase in the internal aspect of the upper margin. The European orbital contour was comparatively more inclined, due to the superior and inferior portions, while the orbit of the African sample differentiates from the other two samples by being shorter and broader.
The orbit of the Asian sample was characterized by its tall contour, which has been indicated in previous studies (Pan, 1933; Wu, 1961; Brown and Maeda, 2004; Masters, 2008). A Tohoku Japanese sample described by Brown and Maeda (2004) to have a high and narrow orbit would likely fit within the Asian sample used in the present study.
However, these studies did not explore the composition of the height increase, which from the obtained results involve both the superior and inferior contours. Also, the Asian sample has disproportionate and partial increases for the internal aspect of the upper margin, which rendered the internal margin of the orbit constricted and straight, while the superior contour was generally asymmetrical. Taking into account the rounded and symmetrical inferior portion, the orbit contour of the Asian sample resembles a quadrilateral shape with a slight inclination; it has a narrower superior portion and a broader inferior portion. This contradicts the assumption proposed by Lahr (1994, 1996) that a particular orbit shape associated with East Asian populations was unidentifiable. These results also do not support claims that modern Chinese have square or elliptical orbital shape (Liu et al, 2006; Lu, 2007).
Lahr (1996) proposed that the orbital contour of Europeans were characterized by their moderate to pronounced inclination, which was also demonstrated in the present study. Additionally, the lower and upper margins of the European orbital contour remained parallel in a large number of specimens. Considering the straight lateral margin, the orbit shape of European specimens was almost an inclined square or rectangle. However, the orbits of some European specimens involved an obvious inclined inferior contour and a horizontal superior contour. Therefore, the degree of inclination for the inferior portion especially on the internal aspect of the lower margin is a more stable and a typical characteristic of the European orbital contour. Cameron’s (1920) suggestion that orbital contours of people from Eurasia have more rounded corners was undermined here.
As proposed by Villiers (1968), the means and distribution of the orbit index categories showed that hypsiconch orbits may be a Bantu-speaking South African specific characteristic. However, the characterization of Africans as having a much taller orbit was not supported by the results of the present study or those by Masters (2008). The typical features for the African superior and inferior contour of the orbit concentrate on its shortness, although parts of African specimens were still relatively high. Villiers (1968) proposed that the orbital contour of Bantu-speaking South Africans was characteristically rectangular in shape. However, as shown in the present study, the orbit shape in the African sample resembled that of Asians and Europeans to a large degree. Therefore, it is difficult to describe it as being either rectangular or round. Generally speaking, the African orbit is not as rectangular or as square as Europeans and was less rounded than Asians.
Masters (2008) placed Asian and African orbit shape on two opposite positions and proposed that the orbit shape of Europeans fell between them, with slight affinity towards the African group. However, based on the results of the present study, in the superior contour of the orbit, Europeans had a closer affinity to Africans than to Asians. The inferior contour of Africans showed approximate affinity to both Asians and Europeans. When lines were used to connect any two populations, with the line length representing the difference of average orbit shape, then a triangle was formed to represent the relationship among these three populations. In this triangle, the line between Asians and Africans was always the shortest. This means that, in terms of overall orbital shape, the contour of Asians and Africans show closer affinity, than that between Europeans and either Asians or Africans.
The most variable areas of the superior contour concentrate on the internal aspect of the upper margin and the contour near the fmo, with the contour between them being relatively stable. The portion of the frontal bone forming the upper margin of the orbital aperture in relation to the horizontal plane of the cranium varies in its inclination, which probably involves the whole orbital roof. Additionally, there was a disproportionate increase in the internal aspect of the upper margin for the Asian sample, which increases the variability of the superior contour. As in the superior contour, rather than overall change, the majority of the variation in the inferior contour comes from the partial and disproportionate transformations. The internal aspect of the inferior contour was the most variable area, especially for the European and African samples. These areas along the lower margin extend more laterally than Asians, which could explain why more specimens in the Asian sample were correctly discriminated. The variation of the contour near the fmo was relevant to change of the superior-lateral corner, and plays a significant role in determining whether the orbit was rectangular or rounded. This indicates that orbit shape should be treated as a metric feature based on its nature of being continuously varied and irregular, rather than a simple non-metric trait. The most variable area of zygoma that constituted the lateral and inferior margin of the orbital contour concentrates on its neighboring area with the frontal and maxilla bones, and its variable pattern mainly involves the internal constriction or external expansion at those two cross points.
Considering the entire orbit, the most variable areas were the contour near the fmo and the internal aspect of the upper and lower margins. These were reflected by orbital height, degree of inclination, and roundedness.
Most changes in craniofacial form occur during ontogeny and their evolution is best explained through their function (Moss and Young, 1960). Due to lower masticatory strain generated by chewing softer and more processed food, previous studies have suggested that changes in food-processing techniques have contributed to less facial growth (especially in the lower face) in humans (Carlson, 1976; Carlson and Van Gerven, 1977; Lieberman et al., 2004). Orbit shape is found to co-vary with other facial traits, such as facial height and facial prognathism (Masters, 2008). With decreased lower facial projection orbit shape becomes more rectangular (Masters, 2008). This suggests that variation in food-preparation technology may partly account for the variation of orbit shape through its influence on the facial structure.
Geometric morphometrics was used to examine regional variation in the orbit shape of contemporary Asian, African, and European populations. To ensure consistency in the analyses of orbit shape a standard plane of the orbital contour was developed. This was completed using the angle between the coronal and orbital planes, misclosure of the orbital contour, and considering the left–right rotation of the face. To eliminate the influence of Procrustes rotation on orbit shape the orbit contour was divided into superior and inferior portions. This method allowed for the most variable aspects of the orbit to be accurately described.
These methods were used to examine the intra- and intergroup-variability for each orbit aspect among Asian, African, and European samples. It was found that specimens from these different regions overlapped with each other in orbit shape; nevertheless, regionally specific features were detected. From this study the most variable area of the eye orbit was concentrated on the internal and lateral aspects of the upper margin formed by the frontal bone, and the internal aspects of the lower margins formed by the zygoma and maxilla. Compared with the superior contour, the orbit shape of the inferior contour from different samples was more easily discerned. The differences in the shape of these bones may partially be due to diet and food-preparation methods.
The method introduced in the present study, based on quantitative analyses, was effective for discriminating population affinity using regional variations in orbit shape. This newly developed standardized mirroring-based geometric morphometric method can be applied in studies on other areas of orbit shape, which could involve ontogeny, sexual dimorphism, evolution, integration with other cranial or facial features, and even to shape studies on other aspects of the skeleton.
This work was supported by grants from Chinese Academy of Sciences (KZZD-EW-03, XDA05130102), Ministry of Science and Technology (2009DFB20580), National Natural Science Foundation of China (J0930007) and DST of South Africa. Many thanks to José Manuel de la Cuétara for his valuable suggestions to improve this manuscript. We would also like to thank the curators of the Raymond Dart Collection of Human Skeletons at the University of the Witwatersrand for permission to use the South African specimens. We appreciate the anonymous reviewers for their valuable comments which have improved this manuscript.