Abstract
Twelve metric variables of the humerus, radius, femur, and tibia were investigated in 11 male samples from northeastern and eastern Asian populations. Variations among regions and correlations between latitude and respective measurements and indices were calculated and a principal component analysis was conducted to elucidate human limb bone characteristics. Significant correlation and marginally significant correlation were found for the maximum subtrochanteric diameter (r = 0.662, P = 0.027) and the platymeric index (r = −0.583, P = 0.060) with latitude, respectively, suggesting that the femur of northern Asians had a wide and flat subtrochanteric shape. The second principal component of the principal component analysis shows that the northeastern samples with comparatively long shaft length and thin and flat shaft diameters were discriminated from the southern samples; the second principal component was significantly correlated with latitude (r = −0.743, P = 0.009). The estimated Fst value of 0.432–0.336 shows that the variation in limb bone measurements across regions is rather large, at approximately two or three times the low levels of interregional variation (0.078–0.180) in analyses of cranial and dental data. Limb bone morphology has been repeatedly proposed to be more strongly influenced by environmental and nutritional factors than cranial and dental traits, but this study is the first to confirm it on the basis of statistical analysis.
Introduction
Evolutionary and phylogenetic changes in hominid limb skeletons, especially changes between Neanderthals and modern humans, have been investigated for a long time (Trinkaus, 1981; Ruff, 2002; Weaver and Steudel-Numbers, 2005; Young et al., 2010). Until the 1990s, morphological differences, including those in body proportions, between Neanderthals and anatomically modern humans (Homo sapiens) had been explained as one line of evidence for the replacement model in Europe (Holliday, 1997a, b).
Geographic variation of human cranial and postcranial forms has been investigated as reflecting genetic diversity in association with worldwide migration of anatomically modern humans from Africa (Relethford, 1994, 2002; Jorde et al., 2000; Holliday and Ruff, 2001; Manica et al., 2007). Cranial and dental traits usually show approximately 10–15% of their total variation among regions and are therefore suggested to be neutral genetic markers (Relethford, 2002; Hanihara, 2008).
On the other hand, limb bone morphology is considered also to have substantial relationships with climatic, nutritional, and other environmental conditions (Trinkaus, 1981; Ruff, 1994, 2002). For example, it is well known that people living in cold climates tend to have low tibiofemoral (crural) index values (tibial length relative to femur length), while the opposite is true for those in warm climates.
In Japan, plenty of basic information about limb bone metrics of Jomon people, and of other prehistoric and historic populations, has been reported over the last 100 years (e.g. Koganei, 1893; Kiyono and Hirai, 1928a, b). First, we would like to provide a brief outline of the population history of Japan. The Jomon people were prehistoric hunter-gatherer inhabitants of the Japanese Islands from 10000 to 2300 BP (Hanihara, 1991; Habu, 2004). The people of the Yayoi cultural period, identified as having lived in the northern Kyushu and Yamaguchi areas of Japan from 300 BP to 300 AD, were thought to have been significantly influenced by immigrants from the Asian mainland or their descendants. The basic concept of the ‘dual’ structure model for Japanese population history, or the Ainu–Ryukyu common origin theory, is as follows (Hanihara, 1991): the genetic composition of the modern mainland Japanese is mainly derived from the Yayoi people, whereas both the Ainu people in the northern part and the Ryukyuans on the southernmost islands of Japan are descendants of the Jomon people. Recent genetic studies based on substantial single-nucleotide polymorphism data have corroborated the Ainu–Ryukyu common origin theory (Koganebuchi et al., 2012; Japanese Archipelago Human Population Genetics Consortium, 2012).
Yamaguchi (1982) revealed that both the Jomon and the Ainu populations had relatively high radiohumeral and tibiofemoral index values, whereas the Yayoi people and modern mainland Japanese had low values, thus supporting the dual-structure model. On the other hand, the Ainu people had a hypercnemic index value of the femur, or flat subtrochanteric shape, while the Jomon people had a high pilaster index value instead (Yamaguchi, 1982).
About 20 years before his 1982 publication, Yamaguchi also investigated the limb bone morphology of people from the Okhotsk area (Mitsuhashi and Yamaguchi, 1962a, b), whose culture spread from southern Sakhalin Island to northeastern Hokkaido Island and the Kuril Islands from the 5th to 12th centuries AD (Amano, 2003). The Okhotsk culture developed a considerable maritime infrastructure that was different from that of the native population in Hokkaido (Hudson, 2004; Naito et al., 2010; Shimoda et al., 2012). Ancient DNA and morphological analyses have revealed that the Okhotsk people were closely related to their neighboring northeast Asians (Komesu et al., 2008; Sato et al., 2009, 2010; Kazuta et al., 2011). Similar to the northeastern Asians, the Okhotsk people had much lower tibiofemoral index values than other Japanese populations (Mitsuhashi and Yamaguchi, 1962a, b).
In 1988–1989, the last author (H.I.) had an opportunity to investigate the limb bone morphology of northeast Asian groups from a collection in Russia. In addition, the authors had an opportunity to examine approximately 260 Okhotsk skeletal remains in Hokkaido University Museum from 2003. Metric and nonmetric data of cranial and dental traits in the Okhotsk area and northeast Asian samples were reported elsewhere (Ishida, 1990, 1992, 1993, 1994, 1995, 1996, 1997; Ishida and Dodo, 1996; Ishida and Kondo, 1999). Recently, Hirofumi Matsumura of Sapporo Medical University, one of the authors, reported metric features of the femur in the Okhotsk people (Matsumura et al., 2010).
In this study, we would like to present new metric data of the limb bones from the prehistoric Neolithic Baikalian, Iron-aged Ekven, and Okhotsk peoples, and recent Buryats. Using long-bone measurements of the Northeast Asian samples and other available samples from Japan and Micronesia, we investigated the regional variations and evaluated the correlational relationships with latitude. Principal component analysis was also performed to elucidate human limb bone characteristics.
Materials and Methods
Table 1 lists the 11 population samples used in this study, with their home latitudes and other information, including the institutions where they are housed. Figure 1 shows the location of the samples.
Table 1
Limb bones from Asians and Japanese used in this study
|
Sample size |
Period |
Latitude |
Information |
Institution |
Source |
| Ekven |
65 |
2000 BP |
66°N |
Ancient Eskimo cemetery, Russia |
MSU |
Present study |
| Neolithic Baikal |
38 |
c. 8000–4000 BP |
52°N |
East and west coasts of Lake Baikal |
MAE |
Present study |
| Buryats |
20 |
Recent |
51°N |
East coast of Lake Baikal |
MAE |
Present study |
| Okhotsk |
79 |
400–1200 AD |
46°N |
Sakhalin, Rebun, Hokkaido |
HU, SMU, KU |
Present study, Ohba (1934), Ishida (1994), Mitsuhashi and Yamaguchi (1962a, b) |
| Ainu |
47 |
Early modern |
42°N |
Hokkaido |
UT |
Koganei (1893) |
| Modern mainland Japan |
29 |
Recent |
35°N |
Kinai |
KU |
Miyamoto (1925), Hirai and Tabata (1928) |
| Jomon Yoshigo |
80 |
4000–2300 BP |
34°N |
Aichi |
KU |
Ohba (1935), Ishizawa (1931) |
| Jomon Tsukumo |
24 |
3000–2300 BP |
34°N |
Okayama |
KU |
Kiyono and Hirai (1928a, b) |
| Yayoi |
128 |
2300–1700 BP |
33°N |
Northern Kyushu, Shimane, Yamaguchi |
KY |
Department of Anatomy of Kyushu University (1988) |
| Ryukyu Islander |
84 |
1600–1900 AD |
26°N |
Early-modern Kumejima, Okinawa |
OPAC |
Fukumine et al. (2001) |
| Micronesia |
42 |
Early modern |
13°N |
Guam |
BM |
Ishida (1993) |
MSU: Moscow State University, Moscow, Russia.
MAE: Museum of Anthropology and Ethnography, St. Petersburg, Russia.
HU: Hokkaido University, Sapporo, Japan.
SMU: Sapporo Medical University, Sapporo, Japan.
KU: Kyoto University, Kyoto, Japan.
UT: University of Tokyo, Tokyo, Japan.
KY: Kyushu University, Fukuoka, Japan.
OPAC: Okinawa Prefectural Archaeological Center, Nishihara, Japan.
BM: B. P. Bishop Museum, Honolulu, Hawaii, USA.

The Ekven skeletal materials are from an ancient cemetery of Arctic people (Arutyunov and Sergeyev, 1975). The Neolithic Baikal samples are from both the east and the west coasts of Lake Baikal. The recent Buryat series was collected from the east coast of Lake Baikal. Seven sets of skeletal materials consisting of the Okhotsk, Hokkaido Ainu, Jomon Yoshigo, Jomon Tsukumo, modern mainland Japanese, Yayoi, and Ryukyu peoples are from the Japanese Islands. The Micronesian series is a sample of Chamorro skeletons from the Mariana Islands.
We only examined male samples for comparison due to the lack of a female Buryat collection. Sex was estimated by morphological examination of whole skeletons (White, 2000). In this study, the first author (M.K.) measured the Okhotsk samples and the last author (H.I.) collected the data of the Ekven, Neolithic Baikalian, and Buryat samples. Limb bones consisting of the humerus, radius, femur, and tibia (12 metric variables) were measured mainly following Martin’s methods, as listed in Appendices 1 and 2 (Knussmann, 1988). However, for subtrochanteric diameters of the femur, we employed not the sagittal and transverse diameters, but maximum and minimum ones (Koganei, 1893). Transverse diameters of the tibial shaft were taken at the position of the nutrient foramen, following the definition given by Vallois (Olivier, 1960). In principle, we measured the bones on the right side. However, in the cases in which the maximum bone length was unavailable on the right side, the left side was instead used for measurement. Other sample data were quoted from the literature as listed in Table 1. However, the sagittal and transverse sub-trochanteric diameters of the femur were adopted in the Yayoi and Ryukyu samples. Therefore, to match comparative data, maximum and minimum diameters were estimated from multiple regression methods using the available sagittal and transverse subtrochanteric diameters.
We calculated basic statistics for each sample. Next, an analysis of variance was conducted to evaluate group differences (Snedecor and Cochran, 1980). When significant differences were found among the samples, Student’s t-test was performed to determine if each group differed significantly from the average of all other groups after Bonferroni correction. Spearman’s rank correlation coefficients between the measurements and latitudes were then computed for evaluation of the association between skeletal limb morphology and climatic conditions. Principal component analysis was performed with the 12 variables to characterize the pattern of the limb bones. The Z-scores of individual datasets were used for the analysis to mitigate size-related effects (Howells, 1989; Brace and Hunt, 1990) Additionally, Spearman’s rank correlation coefficients were computed between the principal component scores and latitudes.
Finally, to compare variances within and among geographical groups, a modification of Wright’s Fst statistic developed by Relethford and Blangero (1990), Relethford (1994), and Relethford and Harpending (1994) was used.
Results
Basic statistics of limb bone measurements among the 11 population samples are listed in Appendices 1 and 2. The analysis of variance showed all measurements and indices to be significantly different among the samples. Figure 2 shows graphs of the respective measurements in which the populations are arranged from north (left) to south (right). The average of the group marked with an asterisk (*) is significantly higher than the total average of all other groups, while the hash mark (#) indicates a significantly lower value than the others, on the basis of respective t-tests after Bonferroni correction.


In terms of the longitudinal dimensions of the upper limb, the inhabitants of the Japanese Islands tend to be shorter. The Ryukyu Islanders show exceptionally small values of humeral and radial lengths. However, the Okhotsk people had rather large upper limb bones, like the Neolithic Baikalian people and the Buryats. The radiohumeral indices (R1:H1) of the Jomon people were found to be markedly high, exceeding 80 (‘dolichokerisch’ in German), as previously reported (Yamaguchi, 1989; Temple et al., 2008). The Micronesian samples were found to have a long and thick humerus.
The Micronesian samples also had long lower limb bones, while the lower limbs of the Ryukyu Islanders were the shortest. The tibiofemoral indices (T1:F1) in the Jomon and Hokkaido Ainu populations were found to be higher, exceeding 82. The Buryats only showed flatter mid-shaft morphology (F6:F7) in the femur. On the other hand, the femora of the Neolithic Baikal and Okhotsk people had flat sub-trochanteric shapes (F10′:F9′) due to a large maximum sub-trochanteric diameter in general, while the femur of the Micronesian series was found to be rounded. As for the tibia, those of the Neolithic Baikalian, Hokkaido Ainu, and Jomon peoples had flat shafts (T9a′:T8a).
Next, we calculated the correlation coefficients between latitude and the averages of the limb bone measurements or indices. Significant correlation was found only for the maximum subtrochanteric diameter (r = 0.662, P = 0.027) and marginally significant correlation was also found for the platymeric index (r = −0.583, P = 0.060), as shown in Figure 3. This indicated that the femur of the northern Asians tended to possess a wide and flat subtrochanteric shape.

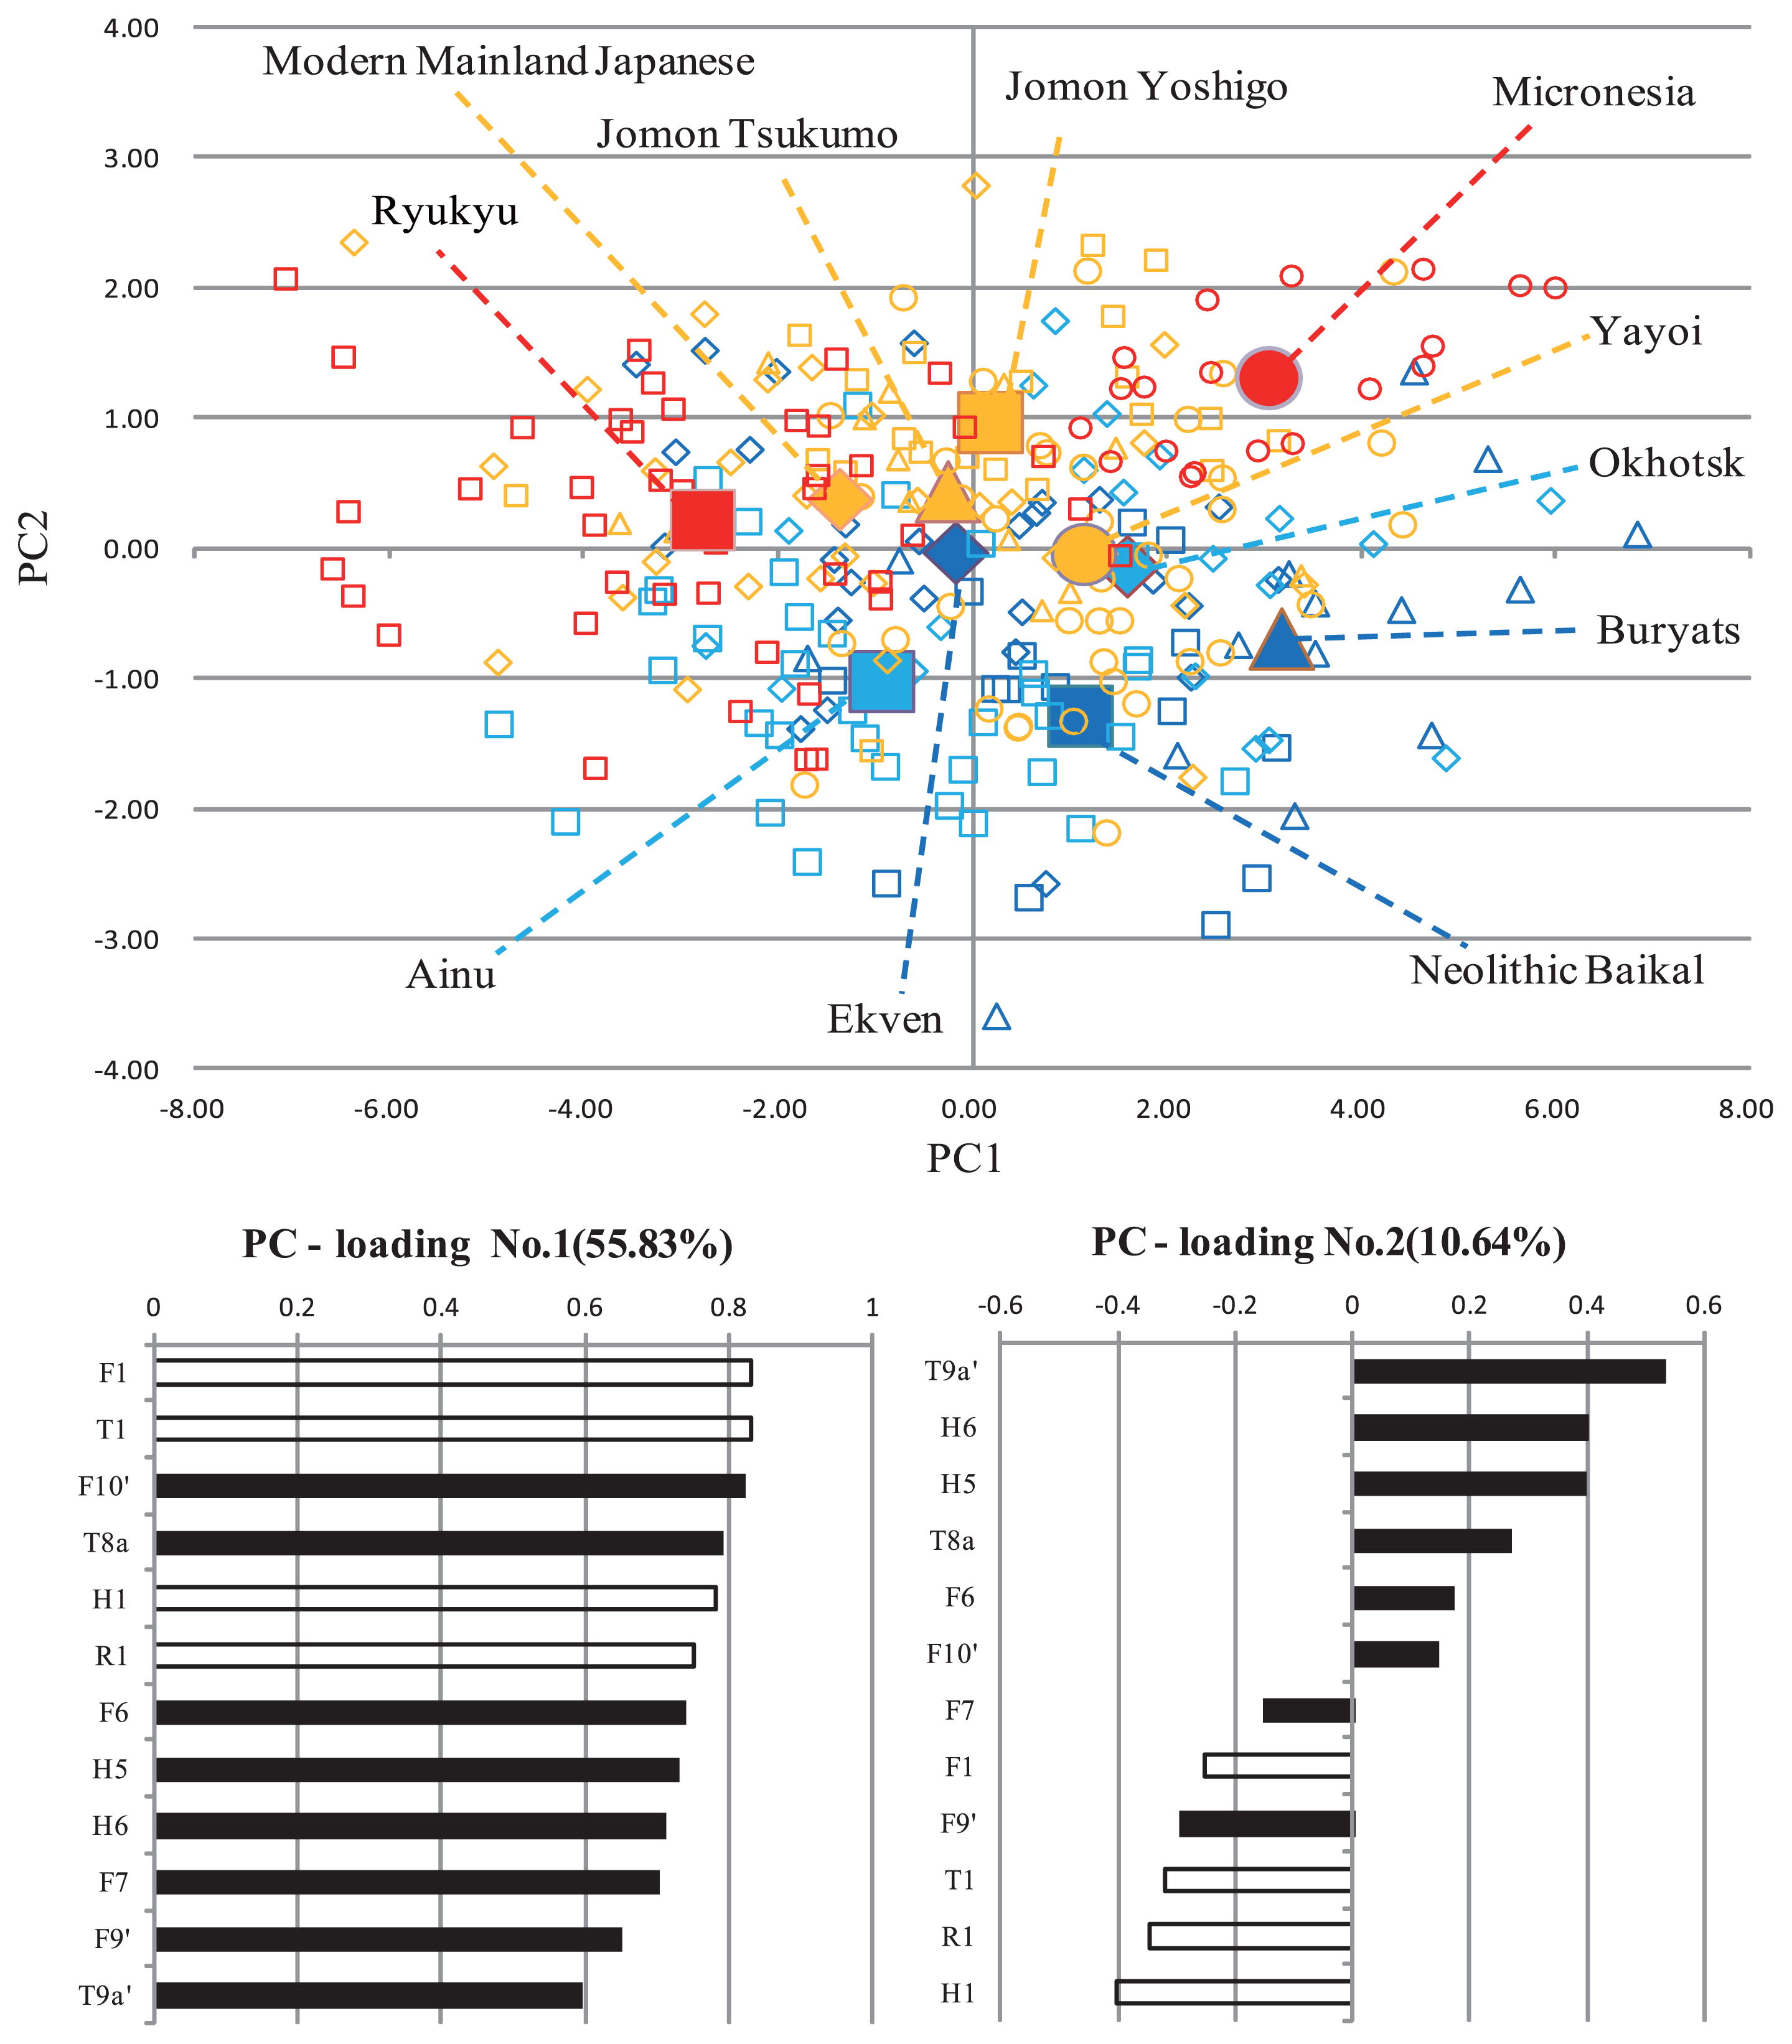
The results of the principal component analysis of the 12 metric variables are shown in Table 2 and Figure 4. The first and second principal components accounted for 55.83% and 10.64% of the total variance, respectively. The first principal component can be interpreted as a size component, especially in terms of length. The second principal component can be interpreted as representing the relative size of general shaft diameters against general longitudinal lengths, maximum subtrochanteric diameter, and transverse shaft diameter of the femur. The comparatively long-limbed Micronesian and Buryat samples exhibited greater first principal component scores, resulting in the right position on the graph of Figure 4. This strongly contrasts with the short-limbed Ryukyu Islanders shown in the leftmost position. The second principal component axis in the graph also shows that the northeastern samples with a comparatively long, thin, and flat shaft are roughly positioned around the lower area, while the southern samples are located at the upper area. Only the second principal component was significantly correlated with latitude (Figure 5) and the correlation coefficient (r = −0.743, P = 0.009) was larger than those of the two femoral variables.
Table 2
Principal component analysis of the limb bone measurements
|
PC1 |
PC2 |
PC3 |
PC4 |
| H1. Humeral maximum length |
0.783 |
−0.403 |
−0.190 |
−0.208 |
| H5. Humeral maximum mid-shaft diameter |
0.730 |
0.398 |
0.161 |
0.023 |
| H6. Humeral minimum mid-shaft diameter |
0.710 |
0.398 |
0.091 |
−0.206 |
| R1. Radial maximum length |
0.750 |
−0.345 |
−0.249 |
−0.049 |
| F1. Femoral maximum length |
0.833 |
−0.252 |
−0.329 |
−0.030 |
| F6. Femoral sagittal mid-shaft diameter |
0.737 |
0.172 |
−0.092 |
0.596 |
| F7. Femoral transverse mid-shaft diameter |
0.701 |
−0.153 |
0.586 |
−0.072 |
| F9′. Femoral maximum subtrochanteric diameter |
0.649 |
−0.294 |
0.595 |
−0.103 |
| F10′. Femoral minimum subtrochanteric diameter |
0.820 |
0.145 |
0.124 |
0.248 |
| T1. Tibial lateral condyle-malleolar length |
0.830 |
−0.318 |
−0.225 |
0.053 |
| T8a. Tibial sagittal diameter at nutrient foramen |
0.790 |
0.270 |
−0.087 |
0.014 |
| T9a′. Tibial transverse diameter at nutrient foramen |
0.595 |
0.530 |
−0.247 |
−0.381 |
|
| Eigenvalue |
6.700 |
1.277 |
1.081 |
0.669 |
| %VAR |
55.83% |
10.64% |
9.01% |
5.58% |
The principal component analysis was conducted with a correlation matrix derived from standardized (Z-score) values.
Assuming that the samples used in this study had the same effective population size, interregional variation was estimated using Fst values. Table 3 shows the estimated Fst (h2 = 0.4–0.6) for limb bone measurements and other Fst values. The result of the estimated Fst of 0.432–0.336 shows that the variation of limb bone measurements across regions is rather large, at approximately two or three times the low levels of interregional variation (0.078–0.180) in analyses of cranial and dental data (Haneji et al., 2007; Toma et al., 2007; Komesu et al., 2008; Ishida et al., 2009).
Table 3
Comparison of
Fst values obtained from metric and nonmetric skeletal traits
| Data |
Fst |
Sample |
Reference |
| Limb bone measurements |
0.336–0.432 |
Northeast Asia, East Asia, Micronesia |
Present study, Heritability 0.4–0.6 |
| Craniometrics |
0.153 |
Northeast Asia, East Asia |
Ishida et al. (2009), Heritability 0.55 |
| Nonmetric cranial traits |
0.078 |
Northeast Asia, East Asia, Eastern Europe |
Komesu et al. (2008), Heritability 0.50 |
| Dental measurements |
0.180 |
Northeast Asia, East Asia, Southeast Asia, Pacific Islands |
Toma et al. (2007), Heritability 0.55 |
| Nonmetric dental variation |
0.163 |
East Asia, West Asia |
Haneji et al. (2007), Heritability 0.55 |
Discussion
Subtrochanteric shape
In this study, we found a novel correlation between the subtrochanteric shape of the femur (especially, F9′) and the latitude among the samples used. This means that the populations living in more northern areas have flatter subtrochanteric femora. However, are these differences caused by genetic or epigenetic (i.e. environmental) factors or both?
Peoples of East Asian origin possess a flatter subtrochanteric shape of the femur than Europeans and Africans (Gill, 2001; Wescott, 2005). This study also revealed that the Asians other than the Micronesians have lower platymeric index values (under 80), thus supporting previous results and suggesting that some population difference (or genetic contribution) related to subtrochanteric shape.
Recently, Kesterke (2008) reported that the estimated heritability (h2) of the subtrochanteric shape of the femur was 0.47 ± 0.24 in Papio hamadryas samples, thus indicating almost equal contributions of genetic and non-genetic factors to the total variance.
In this light, the flatter subtrochanteric shape in the northeast Asian peoples may also be explained not only by genetic, but also non-genetic factors. The results of the principal component analysis showed that the northern peoples had a relatively long shaft with a flat subtrochanteric region (Figure 5). The northern peoples are supposed to have had a large body trunk in general accordance with ecogeographic rules (Ruff, 2002). This could cause a large mediolateral bending force on the upper femoral shaft (Ruff, 2002), perhaps resulting in the comparatively flat subtrochanteric shaft. However, because the bi-iliac breadth and femoral head diameter were not measured in this study, we cannot evaluate this hypothesis further.
The northern Asian peoples tended to have a lower platycnemic index (T9a′:T8a), or flatter tibial shaft, though there were no significant correlations between the platycnemic index and latitude (r = −0.464, P = 0.150). Because diaphyseal robustness is supposed to correspond to terrestrial mobility (Stock, 2006), the flat shaft of femur and tibia may reflect this.
The results of this study could also contribute to the longstanding issue that the Ainu people in Hokkaido had a flat subtrochanteric shape of the femur (74.2), while the Jomon people in Honshu (76.1–78.9) had a less flat subtrochanteric shape (Yamaguchi, 1982). In addition, we previously investigated indices of the upper femoral shaft among the Jomon populations from Hokkaido and Tohoku, northern Japan. Results showed the platymeric index to be 74.8 in Hokkaido Jomon people (Ishida et al., 1987, 1992) and 80.8–80.9 in Tohoku Jomon people (Yamaguchi, 1983; Baba, 1988). This regional difference raises the possibility that the flat sub-trochanteric shape of the femur in Hokkaido Ainu people reflects retention of a trait of Hokkaido Jomon people.
Intra-limb proportion
As mentioned above, the crural index tends to be higher in areas with a cold climate or a high latitude (Holliday and Hilton, 2010). Although analysis of variance revealed a significant difference between the samples compared in this study, the crural index (T1:F1) was not significantly correlated with latitude, partly because the Jomon and Ainu peoples were included in this study (Figure 2c). The Jomon and Ainu peoples have very high crural indices among the East Asians, while such indices are low in the Yayoi people, modern mainland Japanese, and Ryukyu Islanders from the same Japanese islands (Yamaguchi, 1989; Temple et al., 2008; Fukase et al., 2012). However, even when the Jomon series was excluded from the analysis, the correlation was not significant.
Analysis of variance showed a significant difference in the brachial index (R1:H1) between the groups, but it also showed no correlation with latitude (Figure 2a). As already reported by Yamaguchi (1982), the Jomon people have an exceptionally long radius relative to the humerus (81.1–81.5). While the northeastern peoples have lower brachial indices, those in the modern mainland Japanese and Ryukyu Islanders are also low compared with the other groups, as with the crural index.
The reasons why these two indices have no correlations with latitude in this study may be as follows. First, the complex population history in the Japanese Islands, namely, the ‘dual-structure model’ (Hanihara, 1991), may have weakened the correlation of intralimb proportion with latitude. That is, the intralimb proportions among the Japanese peoples were complicated by the recent migration (c. 2000 BP) of the Yayoi people (Yamaguchi, 1982; Temple et al., 2008). The second reason is the peculiarity of the Jomon people. Although this is only one part of the ‘dual-structure model,’ it is very important. A southern or northern origin hypothesis of the Jomon people has been discussed on the basis of morphological and genetic studies (Turner, 1987, 1989, 1990; Matsumura and Hudson, 2005; Cavalli-Sforza et al., 1988; Kozintsev, 1990; Omoto and Saitou, 1997; Ishida and Kondo, 1999; Bannai et al., 1999; Tokunaga et al., 2001; Tajima et al., 2004; Tanaka et al., 2004; Fukumine et al., 2006; Hammer et al., 2006; Komesu et al., 2008; Hanihara and Ishida, 2009; Adachi et al., 2011), but this issue remains unresolved. However, because the long distal segments in the intralimb proportions of the Jomon people are stable from northern Hokkaido to the southern Ryukyu Islands (Fukase et al., 2012), the stability might decrease with the north–south cline of the intralimb proportions in this study. As a last reason, the recent Ryukyu Islanders show very low brachial and crural indices (76.0 and 79.9, respectively), which are comparable to those in northeast Asians. Because they have very short limb bones, this phenomenon could be partly explained by allometry (Holliday and Ruff, 2001; Sylvester et al., 2008; Auerbach and Sylvester, 2011).
Fst
The estimated Fst value of 0.432–0.336 shows that the variation of limb bone measurements across regions is rather large. This shows that the limb bone measurement traits are not neutral, but subject to selection before or after birth. This contrasts with the cranial and dental traits, which show low interregional variations (0.078–0.180) and are viewed as neutral genetic markers (Relethford, 1991, 1994, 2002; Relethford and Harpending, 1994, 1995; Relethford et al., 1997; Powell and Neves, 1999; Hanihara and Ishida, 2005; Hanihara, 2006; Haneji et al., 2007).
On the other hand, Relethford (2002) reported that skin color showed very high variation among regions (0.88), suggesting a natural selection pattern. Thus, the interregional variation of the limb bone measurements (0.336–0.432) is intermediate between that of skin color (0.88) and those of craniodental traits (0.078–0.180). In addition, because the level of skin reflectance is strongly correlated with latitude (r2 = 0.85, from Relethford, 1997), it is reasonable that only the second principal component (Table 2, Figure 4) or the subtrochanteric shape of the femur could be correlated with the latitude in this study (r2 = 0.44–0.55). The limb bone morphology has been repeatedly proposed to be more strongly subjected to influence by environmental and nutritional factors than cranial and dental traits (Trinkaus, 1981; Ruff, 1994, 2002), but this study is the first to confirm it on the basis of statistical analysis.
Acknowledgments
We wish to thank the following individuals for their permission to study skeletal materials under their care: I.I. Gokhman and A.G. Kozintsev, the Institute of Ethnography—St. Petersburg Branch, St. Petersburg; the late Academician V.P. Alekseev, the Institute of Archaeology, Moscow; and T.I. Alekseeva, Moscow State University, Moscow, Russia. B. Yamaguchi, National Museum of Nature and Science, Tokyo, kindly provided individual data of limb bones from the Omisaki site, Japan.
This study was supported in part by a Grant-in-aid for Scientific Research (No. 22370087) from the Japan Society for the Promotion of Science. We are deeply grateful to two anonymous reviewers for their valuable comments.
References
- Adachi, N., Shinoda, K., Umetsu, K., Kitano, T., Matsumura, H., Fujiyama, R., Sawada, J., and Tanaka, M. (2011) Mitochondrial DNA analysis of Hokkaido Jomon skeletons: Remnants of archaic maternal lineages at the southwestern edge of former Beringia. American Journal of Physical Anthropology, 146: 346–360.
- Amano, T. (2003) What is the Okhotsk culture? In: Nomura, T., and Utagawa, Y. (eds.), Epi-Jomon, Okhotsk Culture. Hokkaido Shinbunsha, Sapporo, pp. 110–133 (in Japanese).
- Arutyunov, S.A., and Sergeyev, D.A. (1975) Problemy Etnicheskoy Istorii Beringomor’ya: Ekvensky Mogil’nik (The Problems of the Ethnic History of Beringia: Ekven Burials). Nauka, Moscow, p. 240 (in Russian).
- Auerbach, B.M., and Sylvester, A.D. (2011) Allometry and apparent paradoxes in human limb proportions: implications for scaling factors. American Journal of Physical Anthropology, 144: 382–391.
- Baba, H. (1988) Limb bone. In: Sanganji shell-mound. Fukushima Prefectural Museum Report 17. Fukushima, pp. 443–480 (in Japanese).
- Bannai, M., Ohashi, J., Harihara, S., Takahashi, Y., Juji, T., Omoto, K., and Tokunaga, K. (1999) Analysis of HLA genes haplo-types in Ainu (from Hokkaido, northern Japan) supports the premise that they descent from Upper Paleolithic populations of East Asia. Tissue Antigens, 55: 128–139.
- Brace, C.L., and Hunt, K.D. (1990) A nonracial craniofacial perspective on human variation: A(ustralia) to Z(uni). American Journal of Physical Anthropology, 82: 341–360.
- Cavalli-Sforza, L.L., Piazza, A., Menozzi, P., and Mountain, J. (1988) Reconstruction of human evolution: bringing together genetic, archaeological, and linguistic data. Proceedings of the National Academy of Sciences of the USA, 85: 6002–6006.
- Department of Anatomy of Kyushu University (1988) The Genesis of the Japanese Population and Culture. Rokko-Shuppan, Tokyo (in Japanese).
- Fukase, H., Wakebe, T., Tsurumoto, T., Saiki, K., Fujita, M., and Ishida, H. (2012) Geographic variation in body form of prehistoric Jomon males in the Japanese archipelago: its ecogeographic implications. American Journal of Physical Anthropology, 149: 125–135.
- Fukumine, T., Doi, N., Ishida, H., Zukeran, C., Sensui, S., Saso, A., and Higa, T. (2001) Human skeletal remains from the Yacchi-no-Gama and Kanjinbaru grave sites. In: Okinawa Prefectural Archeological Center (ed.), Yacchi-no-Gama, Kanjinbaru Grave Sites. Okinawa Prefectural Archaeolpgical Center Research Report, No. 6, Okinawa, pp. 345–385 (in Japanese).
- Fukumine, T., Hanihara, T., Nishime, A., and Ishida, H. (2006) Non-metric cranial variation of early modern human skeletal remains from Kumejima, Okinawa and the peopling of the Ryukyu Islands. Anthropological Science, 114: 141–151.
- Gill, G.W. (2001) Racial variation in the proximal and distal femur: heritability and forensic utility. Journal of Forensic Sciences, 46: 791–799.
- Habu, J. (2004) Ancient Jomon of Japan. Cambridge University Press, Berkeley, CA.
- Hammer, M.F., Karafet, T.M., Parek, H., Omoto, K., Harihara, S., Stoneking, M., and Horai, S. (2006) Dual origins of the Japanese: common ground for hunter-gatherer and farmer Y chromosomes. Journal of Human Genetics, 51: 47–58.
- Haneji, K., Hanihara, T., Sunakawa, H., Toma, T., and Ishida, H. (2007) Non-metric dental variation of Sakishima Islands, Okinawa, Japan: a comparative study among Sakishima and other neighboring populations. Anthropological Science, 115: 35–45.
- Hanihara, K. (1991) Dual structure model for the population history of the Japanese. Japan Review, 2: 1–33.
- Hanihara, T. (2006) Interpretation of craniofacial variation and diversification of East and Southeast Asians. In: Oxenham, M., and Tayles, N. (eds.), Bioarchaeology of Southeast Asia. Cambridge University Press, Cambridge, pp. 91–111.
- Hanihara, T. (2008) Morphological variation of major human populations based on nonmetric dental traits. American Journal of Physical Anthropology, 136: 169–182.
- Hanihara, T., and Ishida, H. (2005) Metric dental variation of major human populations. American Journal of Physical Anthropology, 128: 287–298.
- Hanihara, T., and Ishida, H. (2009) Regional differences in craniofacial diversity and population history of Jomon Japan. American Journal of Physical Anthropology, 139: 311–322.
- Hirai, T., and Tabata, T. (1928) Anthropological studies on the skeleton of the recent Japanese. IV. Part. The Lower limb. No.1. About the femur, the patella, the tibia and the fibula. Journal of the Anthropological Society of Nippon, 43 (the 1st appendix): 1–82 (in Japanese).
- Holliday, T.W. (1997a) Body proportions in Late Pleistocene Europe and modern human origins. Journal of Human Evolution, 32: 423–448.
- Holliday, T.W. (1997b) Postcranial evidence of cold adaptation in Europe Neandertals. American Journal of Physical Anthropology, 104: 245–258.
- Holliday, T.W., and Hilton, C.E. (2010) Body proportions of circumpolar peoples as evidenced from skeletal data: Ipiutak and Tigara (Point Hope) versus Kodiak Island Inuit. American Journal of Physical Anthropology, 142: 287–302.
- Holliday, T.W., and Ruff, C.B. (2001) Relative variation in human proximal and distal limb segment lengths. American Journal of Physical Anthropology, 116: 26–33.
- Howells, W.W. (1989) Skull Shapes and the Map. Craniometric Analyses in the Dispersion of Modern Homo. Papers of the Peabody Museum of Archaeology and Ethnology, Vol. 79, Peabody Museum, Cambridge, MA, p. 189.
- Hudson, M.J. (2004) The perspective realities of change: world system incorporation and the Okhotsk culture in Hokkaido. Journal of Anthropological Archaeology, 23: 290–308.
- Ishida, H. (1990) Cranial morphology of several ethnic groups from the Amur basin and Sakhalin. Journal of the Anthropological Society of Nippon, 98: 137–148.
- Ishida, H. (1992) Flatness of facial skeletons in Siberian and other circum-Pacific populations. Zeitshrift für Morphologie und Anthropologie, 79: 53–67.
- Ishida, H. (1993) Populational affinities of the Peruvian with Siberians and North Americans: a nonmetric cranial approach. Anthropological Science, 101: 47–63.
- Ishida, H. (1994) Skeletal morphology of the Okhotsk people on Sakhalin Island. Anthropological Science, 102: 257–269.
- Ishida, H. (1995) Nonmetric cranial variation of Northeast Asian populations and their population affinities. Anthropological Science, 103: 385–401.
- Ishida, H. (1996) Metric and nonmetric cranial variation of the prehistoric Okhotsk people. Anthropological Science, 104: 233–258.
- Ishida, H. (1997) Craniometric variation of the Northeast Asian populations. Homo, 48: 106–124.
- Ishida, H., and Dodo, Y. (1996) Cranial morphology of the Siberians and East Asians. In: Akazawa, T., and Szathmary, E.J.E. (eds.), Prehistoric Mongoloid Dispersals. Oxford University Press, Oxford, pp. 113–124.
- Ishida, H., and Kondo, O. (1999) Nonmetric cranial variation of the Ainu and neighbouring human populations. Perspectives in Human Biology, 4: 127–138.
- Ishida, H., Dodo, Y., and Yamaguchi, B. (1987) Skeletons of Takasago Shell-Mound. The Anthropological Survey of Prehistoric Shell-Mounds on the Coast of Volcano Bay No. 2. Department of Anatomy (2), Sapporo Medical College, Sapporo, pp. 107–185.
- Ishida, H., Dodo, Y., Hanihara, T., Ohshima, N., Kida, M., and Matsumura, H. (1992) Jomon skeletal remains from Kotan-Onsen site, Yakumo, Hokkaido. In: Kotan-Onsen Site, Yakumo Educational Board, Yakumo, pp. 403–421.
- Ishida, H., Hanihara, T., Kondo, O., and Fukumine, T. (2009) Craniometric divergence history of the Japanese populations. Anthropological Science, 117: 147–156.
- Ishisawa, M. (1931) Anthropological studies on the skeleton of Yoshiko Stone Age People. III. Part. Lower limb. On the femur, the patella, the tibia and the fibula. Journal of the Anthropological Society of Nippon, 46 (the 1st appendix): 1–192 (in Japanese).
- Japanese Archipelago Human Population Genetics Consortium (2012) The history of human populations in the Japanese Archipelago inferred from genomewide SNP data with a special reference to the Ainu and the Ryukyuan populations. Journal of Human Genetics, 57: 787–795.
- Jorde, L.B., Watkins, W.S., Bamshad, M.J., Dixon, M.E., Ricker, C.E., and Seielstad, M.T. (2000) The distribution of human genetic diversity: a comparison of mitochondrial, autosomal, and Y-chromosome data. American Journal of Human Genetics, 66: 979–988.
- Kazuta, H., Sato, T., Dodo, Y., Matsumura, H., Amano, T., Ishida, H., and Masuda, R. (2011) Genotype frequencies of the ABCC11 gene in 2000–3000-year-old human bones from the Epi-Jomon and Jomon sites in Hokkaido, Japan. Anthropological Science, 119: 81–86.
- Kesterke, M.J. (2008) Heritability of subtrochanteric femur shape (platymeric index) in Papio hamadryasand implications for hominid and modern human postcranial variation and evolution. MA thesis, Department of Anthropology, University of Wyoming.
- Kiyono, K., and Hirai, T. (1928a) Anthropologische Untersuchungen über das skelett der Tsukumo-Steinzeitmenschen, III. Teil. Die Oberen Extremitaten. Journal of the Anthropological Society of Nippon, 43 (Suppl.): 179–285.
- Kiyono, K., and Hirai, T. (1928b) Anthropologische Untersuchungen über das skelett der Tsukumo-Steinzeitmenschen, IV. Tail. Die Unteren Extremitaten. Nr. 1. Über die Femur, die Patella, die Tibia und die Fibula. Journal of the Anthropological Society of Nippon, 43 (Suppl.): 303–390.
- Knussmann, R. (1988) Martin/Knussmann-Anthropologie: Handbuch der vergleichenden Biologie des Menschen, Bd. I. Gustav Fischer Verlag, Stuttgart.
- Koganebuchi, K., Katsumura, T., Nakagome, S., Ishida, H., Kawamura, S., and Oota, H.The Asian Archival DNA Repository Consortium (2012) Autosomal and Y-chromosomal STR markers reveal a close relationship between Hokkaido Ainu and Ryukyu islanders. Anthropological Science, 120: 199–208.
- Koganei, Y. (1893) Beiträge zur physischen Anthropologie der Aino, I. Untersuchungen am Skelet. Mittheilungen aus der Medicinischen Facultät der Kaiserlich-Japanischen Universität, Bd. 2. Kaiserlichen Universität, Tokyo (in German).
- Komesu, A., Hanihara, T., Amano, T., Ono, H., Yoneda, M., Dodo, Y., Fukumine, T., and Ishida, H. (2008) Nonmetric cranial variation in human skeletal remains associated with Okhotsk culture. Anthropological Science, 116: 33–47.
- Kozintsev, A. (1990) Ainu, Japanese, their ancestors and neighbours: cranioscopic data. Journal of the Anthropological Society of Nippon, 98: 247–267.
- Manica, A., Amos, W., Balloux, F., and Hanihara, T. (2007) The effect of ancient population bottlenecks on human phenotypic variation. Nature, 448: 346–349.
- Matsumura, H., and Hudson, M. (2005) Dental perspectives on the population history of Southeast Asia. American Journal of Physical Anthropology, 127: 182–209.
- Matsumura, H., Hudson, M.J., Kawamura, K., and Kashiwa, T. (2010) Morphometric features of femurs in the Okhotsk people. Anthropological Science (Japanese series), 118: 69–82.
- Mitsuhashi, K., and Yamaguchi, B. (1962a) Anthropological studies on the human remains from Omisaki, Hokkaido. II. Femur, tibia, and fibula. Sapporo Medical Journal, 21: 23–32 (in Japanese with English summary).
- Mitsuhashi, K., and Yamaguchi, B. (1962b) Anthropological studies on the human remains from Omisaki, Hokkaido. IV. Humerus, radius, and ulna. Sapporo Medical Journal, 22: 288–294 (in Japanese with English summary).
- Miyamoto, H. (1925) Anthropological studies on the skeleton of the recent Japanese. II. The Upper Limb. Journal of the Anthropological Society of Nippon, 40: 219–305 (in Japanese).
- Naito, Y.I., Chikaraishi, Y., Ohkouchi, N., Mukai, H., Shibata, Y., Honch, N.V., Dodo, Y., Ishida, H., Amano, T., Ono, H., and Yoneda, M. (2010) Dietary reconstruction of the Okhotsk culture of Hokkaido, Japan, based on nitrogen isotopic composition of amino acids: implication for the correction of radiocarbon marine reservoir effects on human bones. Radiocarbon, 52: 671–681.
- Ohba, H. (1934) On the upper extremities of human bones from the Susuya Shell-mounds, Saghalien. Journal of the Anthropological Society of Nippon, 49: 389–401, 493–504. (in Japanese)
- Ohba, H. (1935) Anthropological studies on the skeleton of Yoshiko-Stone Age people from the Prov. Mikawa, Japan. Part IV. the upper extremity. No.1. the Shoulder girdle. Journal of the Anthropological Society of Nippon, 50 (the 9th appendix): 99–169 (in Japanese).
- Olivier, G., (1960) Pratique anthropologieque. Vigot Freres, Paris.
- Omoto, K., and Saitou, N. (1997) Genetic origins of the Japanese: a partial support for the dual structure hypothesis. American Journal of Physical Anthropology, 102: 437–446.
- Powell, J.F., and Neves, W.A. (1999) Craniofacial morphology of the first Americans: pattern and process in the peopling of the New World. Yearbook of Physical Anthropology, 42: 153–188.
- Relethford, J.H. (1991) Genetic drift and anthropometric variation in Ireland. Human Biology, 63: 155–165.
- Relethford, J.H. (1994) Craniometric variation among modern human populations. American Journal of Physical Anthropology, 95: 53–62.
- Relethford, J.H. (1997) Hemispheric difference in human skin color. American Journal of Physical Anthropology, 104: 449–457.
- Relethford, J.H. (2002) Apportionment of global human genetic diversity based on craniometrics and skin color. American Journal of Physical Anthropology, 118: 393–398.
- Relethford, J.H., and Blangero, J. (1990) Detection of differential gene flow from patterns of quantitative variation. Human Biology, 62: 5–25.
- Relethford, J.H., and Harpending, H.C. (1994) Craniometric variation, genetic theory, and modern human origins. American Journal of Physical Anthropology, 95: 249–270.
- Relethford, J.H., and Harpending, H.C. (1995) Ancient differences in population size can mimic a recent African origin of modern humans. Current Anthropology, 36: 667–674.
- Relethford, J.H., Crawford, M.H., and Blangero, J. (1997) Genetic drift and gene flow in post-famine Ireland. Human Biology, 69: 443–465.
- Ruff, C.B. (1994) Morphological adaptation to climate in modern and fossil hominids. American Journal of Physical Anthropology, 37: 65–107.
- Ruff, C.B. (2002) Variation in human body size and shape. Annual Review of Anthropology, 31: 211–232.
- Sato, T., Amano, T., Ono, H., Ishida, H., Kodera, H., Matsumura, H., Yoneda, M., and Masuda, R. (2009) Mitochondrial DNA haplogrouping of the Okhotsk people based on analysis of ancient DNA: an intermediate of gene flow from the continental Sakhalin people to the Ainu. Anthropological Science, 117: 171–180.
- Sato, T., Kazuta, H., Amano, T., Ono, H., Ishida, H., Kodera, H., Matsumura, H., Yoneda, M., Dodo, Y., and Masuda, R. (2010) Polymorphisms and allele frequencies of the ABO blood group gene among the Jomon, Epi-Jomon, and Okhotsk people in Hokkaido, northern Japan revealed by ancient DNA analysis. Journal of Human Genetics, 55: 691–696.
- Shimoda, Y., Nagaoka, T., Moromizato, K., Sunagawa, M., Hanihara, T., Yoneda, M., Hirata, K., Ono, H., Amano, T., Fukumine, T., and Ishida, H. (2012) Degenerative changes of the spine in people from the Okhotsk culture and two ancient groups from Kanto and Okinawa, Japan. Anthropological Science, 120: 1–21.
- Snedecor, G.W., and Cochran, W.G. (1980) Statistical Methods, 7th edn. Iowa State University Press, Ames.
- Stock, J.T. (2006) Hunter-gatherer postcranial robusticity relative to patterns of mobility, climate adaptation, and selection for tissue economy. American Journal of Physical Anthropology, 131: 194–204.
- Sylvester, A.D., Kramer, P.A., and Jungers, W.L. (2008) Modern humans are not (quite) isometric. American Journal of Physical Anthropology, 137: 371–383.
- Tajima, A., Hayami, M., Juji, T., Matsuo, M., Marzuki, S., Omoto, K., and Horai, S. (2004) Genetic origins of the Ainu inferred from combined DNA analyses of maternal and paternal lineages. Journal of Human Genetics, 49: 187–193.
- Tanaka, M., Cabrera, V.M., González, A.M., Larruga, J.M., Takeyasu, T., Fuku, N., Li-Jun, G., Hirose, R., Fujita, Y., Kurata, M., Shinoda, K., Umetsu, K., Yamada, Y., Oshida, Y., Sato, Y., Hattori, N., Mizuno, Y., Tanaka, Y., Kawamori, R., Shamoto-Nagai, M., Maruyama, W., Shimokata, H., Suzuki, R., and Shimodaira, H. (2004) Mitochondrial genome variation in eastern Asia and the peopling of Japan. Genome Research, 14: 1832–1850.
- Temple, D.H., Auerbach, B.M., Nakatsukasa, M., Sciilli, P.W., and Larsen, C.S. (2008) Variation in limb proportions between Jomon foragers and Yayoi agriculturalists from Prehistoric Japan. American Journal of Physical Anthropology, 137: 164–174.
- Tokunaga, K., Ohashi, J., Bannai, M., and Juji, T. (2001) Genetic link between Asians and Native Americans: evidence from HLA genes and haplotypes. Human Immunology, 62: 1001–1008.
- Toma, T., Hanihara, T., Sunakawa, H., Haneji, K., and Ishida, H. (2007) Metric dental diversity of Ryukyu Islanders: a comparative study among Ryukyu and other Asian populations. Anthropological Science, 115: 119–131.
- Trinkaus, E. (1981) Neanderthal limb proportions and cold adaptation. In: Stringer, C. (ed.), Aspects of Human Evolution. Taylor & Francis, London, pp. 187–224.
- Turner, C.G.II (1987) Late Pleistocene and Holocene population history of East Asian based on dental variation. American Journal of Physical Anthropology, 73: 305–321.
- Turner, C.G.II (1989) Teeth and prehistory in Asia. Scientific American, 260: 70–77.
- Turner, C.G.II (1990) Major features of Sundadonty and Sinodonty, including suggestions about East Asian microevolution, population history, and late Pleistocene relationships with Australian aboriginals. American Journal of Physical Anthropology, 82: 295–317.
- Weaver, T.D., and Steudel-Numbers, K. (2005) Does climate or mobility explain the differences in body proportions between Neandertals and their upper Paleolithic successors? Evolutionary Anthropology, 14: 218–223.
- Wescott, D.J. (2005) Population variation in femur subtrochanteric shape. Journal of Forensic Sciences, 50: 286–293.
- White, T.D. (2000) Human Osteology, 2nd edn. Academic Press, San Diego, CA.
- Yamaguchi, B. (1982) A review of the osteological characteristics of the Jomon population in prehistoric Japan. Journal of the Anthropological Society of Nippon, 90 (Suppl.): 77–90.
- Yamaguchi, B. (1983) Postcranial bones of the human skeletal remains of the Jomon period from the Ebishima (Kaitori) shell mound in Hanaizumi, Iwate Prefecture. Memoirs of the National Science Museum, 16: 201–222.
- Yamaguchi, B. (1989) Limb segment proportions in human skeletal remains of the Jomon Period. Bulletin of the National Science Museum, Tokyo, Ser. D, 15: 41–48.
- Young, N.M., Wagner, G.P., and Hallgrimsson, B. (2010) Development and the evolvability of human limbs. Proceedings of the National Academy of Sciences of the USA, 107: 3400–3405.

