Original Articles
Ancient mitochondrial DNA sequences of Jomon teeth samples from Sanganji, Tohoku district, Japan
2013 Volume 121 Issue 2 Pages 89-103

Details
2013 Volume 121 Issue 2 Pages 89-103
We investigated mitochondrial DNA haplogroups of four Jomon individuals from the Sanganji shell mound in Fukushima, Tohoku district, Japan. Partial nucleotide sequences of the coding and control region of mitochondrial DNA were determined. The success rate of sequencing increased when we analyzed short DNA sequences. We identified haplogroups from all four samples that were analyzed; haplogroup frequencies were 50% (n = 2) for N9b and 50% (n = 2) for M7a2. Haplogroup N9b has been previously observed in high frequencies in the other Tohoku Jomon, Hokkaido Jomon, Okhotsk, and Ainu peoples, whereas its frequency was reported to be low in the Kanto Jomon and the modern mainland Japanese. Sub-haplogroup M7a2 has previously been reported in the Hokkaido Jomon, Okhotsk, and modern Udegey (southern Siberia) peoples, but not in the Kanto Jomon, Ainu, or Ryukyuan peoples. Principal component analysis and phylogenetic network analysis revealed that, based on haplogroup frequencies, the Tohoku Jomon was genetically closer to the Hokkaido Jomon and Udegey people, than to the Kanto Jomon or mainland modern Japanese. The available evidence suggests genetic differences between the Tohoku and Kanto regions in the Jomon period, and greater genetic similarity between the Tohoku Jomon and the other investigated ancient (Hokkaido Jomon, Okhotsk) and modern (Siberian, Udegey in particular) populations. At the same time, the Tohoku and Hokkaido Jomon seem to differ in sub-haplotype representations, suggesting complexity in Jomon population structure and history.
The question of the origin of the Jomon people has been debated for several decades. The Jomon are widely thought to have settled the Japanese archipelago c. 15700 to 2350 years BP (Kobayashi, 2008) and ranged geographically from Hokkaido to Okinawa. Morphological studies of dental variation have suggested that the Jomon people were of southern origin (Turner, 1987, 1990; Hanihara, 1991; Matsumura, 2007; Matsumura et al., 2009). On the other hand, archaeology, genetics, and recent cranial morphology studies suggest that the Jomon people were of northern origin (Nei, 1995; Imamura, 1996; Omoto and Saitou, 1997; Hanihara and Ishida, 2009; Nakashima et al., 2010).
To investigate more directly the origin of the Jomon from a genetic standpoint, mitochondrial (mt) DNA from ancient skeletal remains have been analyzed in the last few decades (Horai et al., 1989, 1991; Shinoda and Kanai, 1999; Shinoda, 2003; Adachi et al., 2008, 2009a, b, 2011). Analyses of ancient materials are useful, because they directly clarify maternally inherited mtDNA haplogroups. So far, Jomon materials from three regions, the Hokkaido, Tohoku, and Kanto regions (Figure 1), have been analyzed (Shinoda and Kanai, 1999; Shinoda, 2003; Adachi et al., 2008, 2009a, b, 2011). Comparisons of mtDNA haplogroup frequencies with other East and Northeast Asian populations indicate that the genetic structure of the Hokkaido Jomon (the northernmost of the Jomon populations) exhibited some similarities with indigenous modern Siberian populations inhabiting the lower Amur riverine system, particularly the Ulchi and Udegey people (Adachi et al., 2011). However, the genetic affinity of the other Jomon people, especially of the Tohoku Jomon, was not sufficiently classified in Adachi et al. (2009a). Furthermore, the mtDNA haplogroups N9b and M7a, characteristic of the Tohoku Jomon, are scarce in the other modern populations except the modern Japanese (including Ainu and Ryukyuan people) and Udegey. In order to further understand the origin of the Jomon people based on ancient DNA, additional analyses of the Tohoku Jomon are essential.
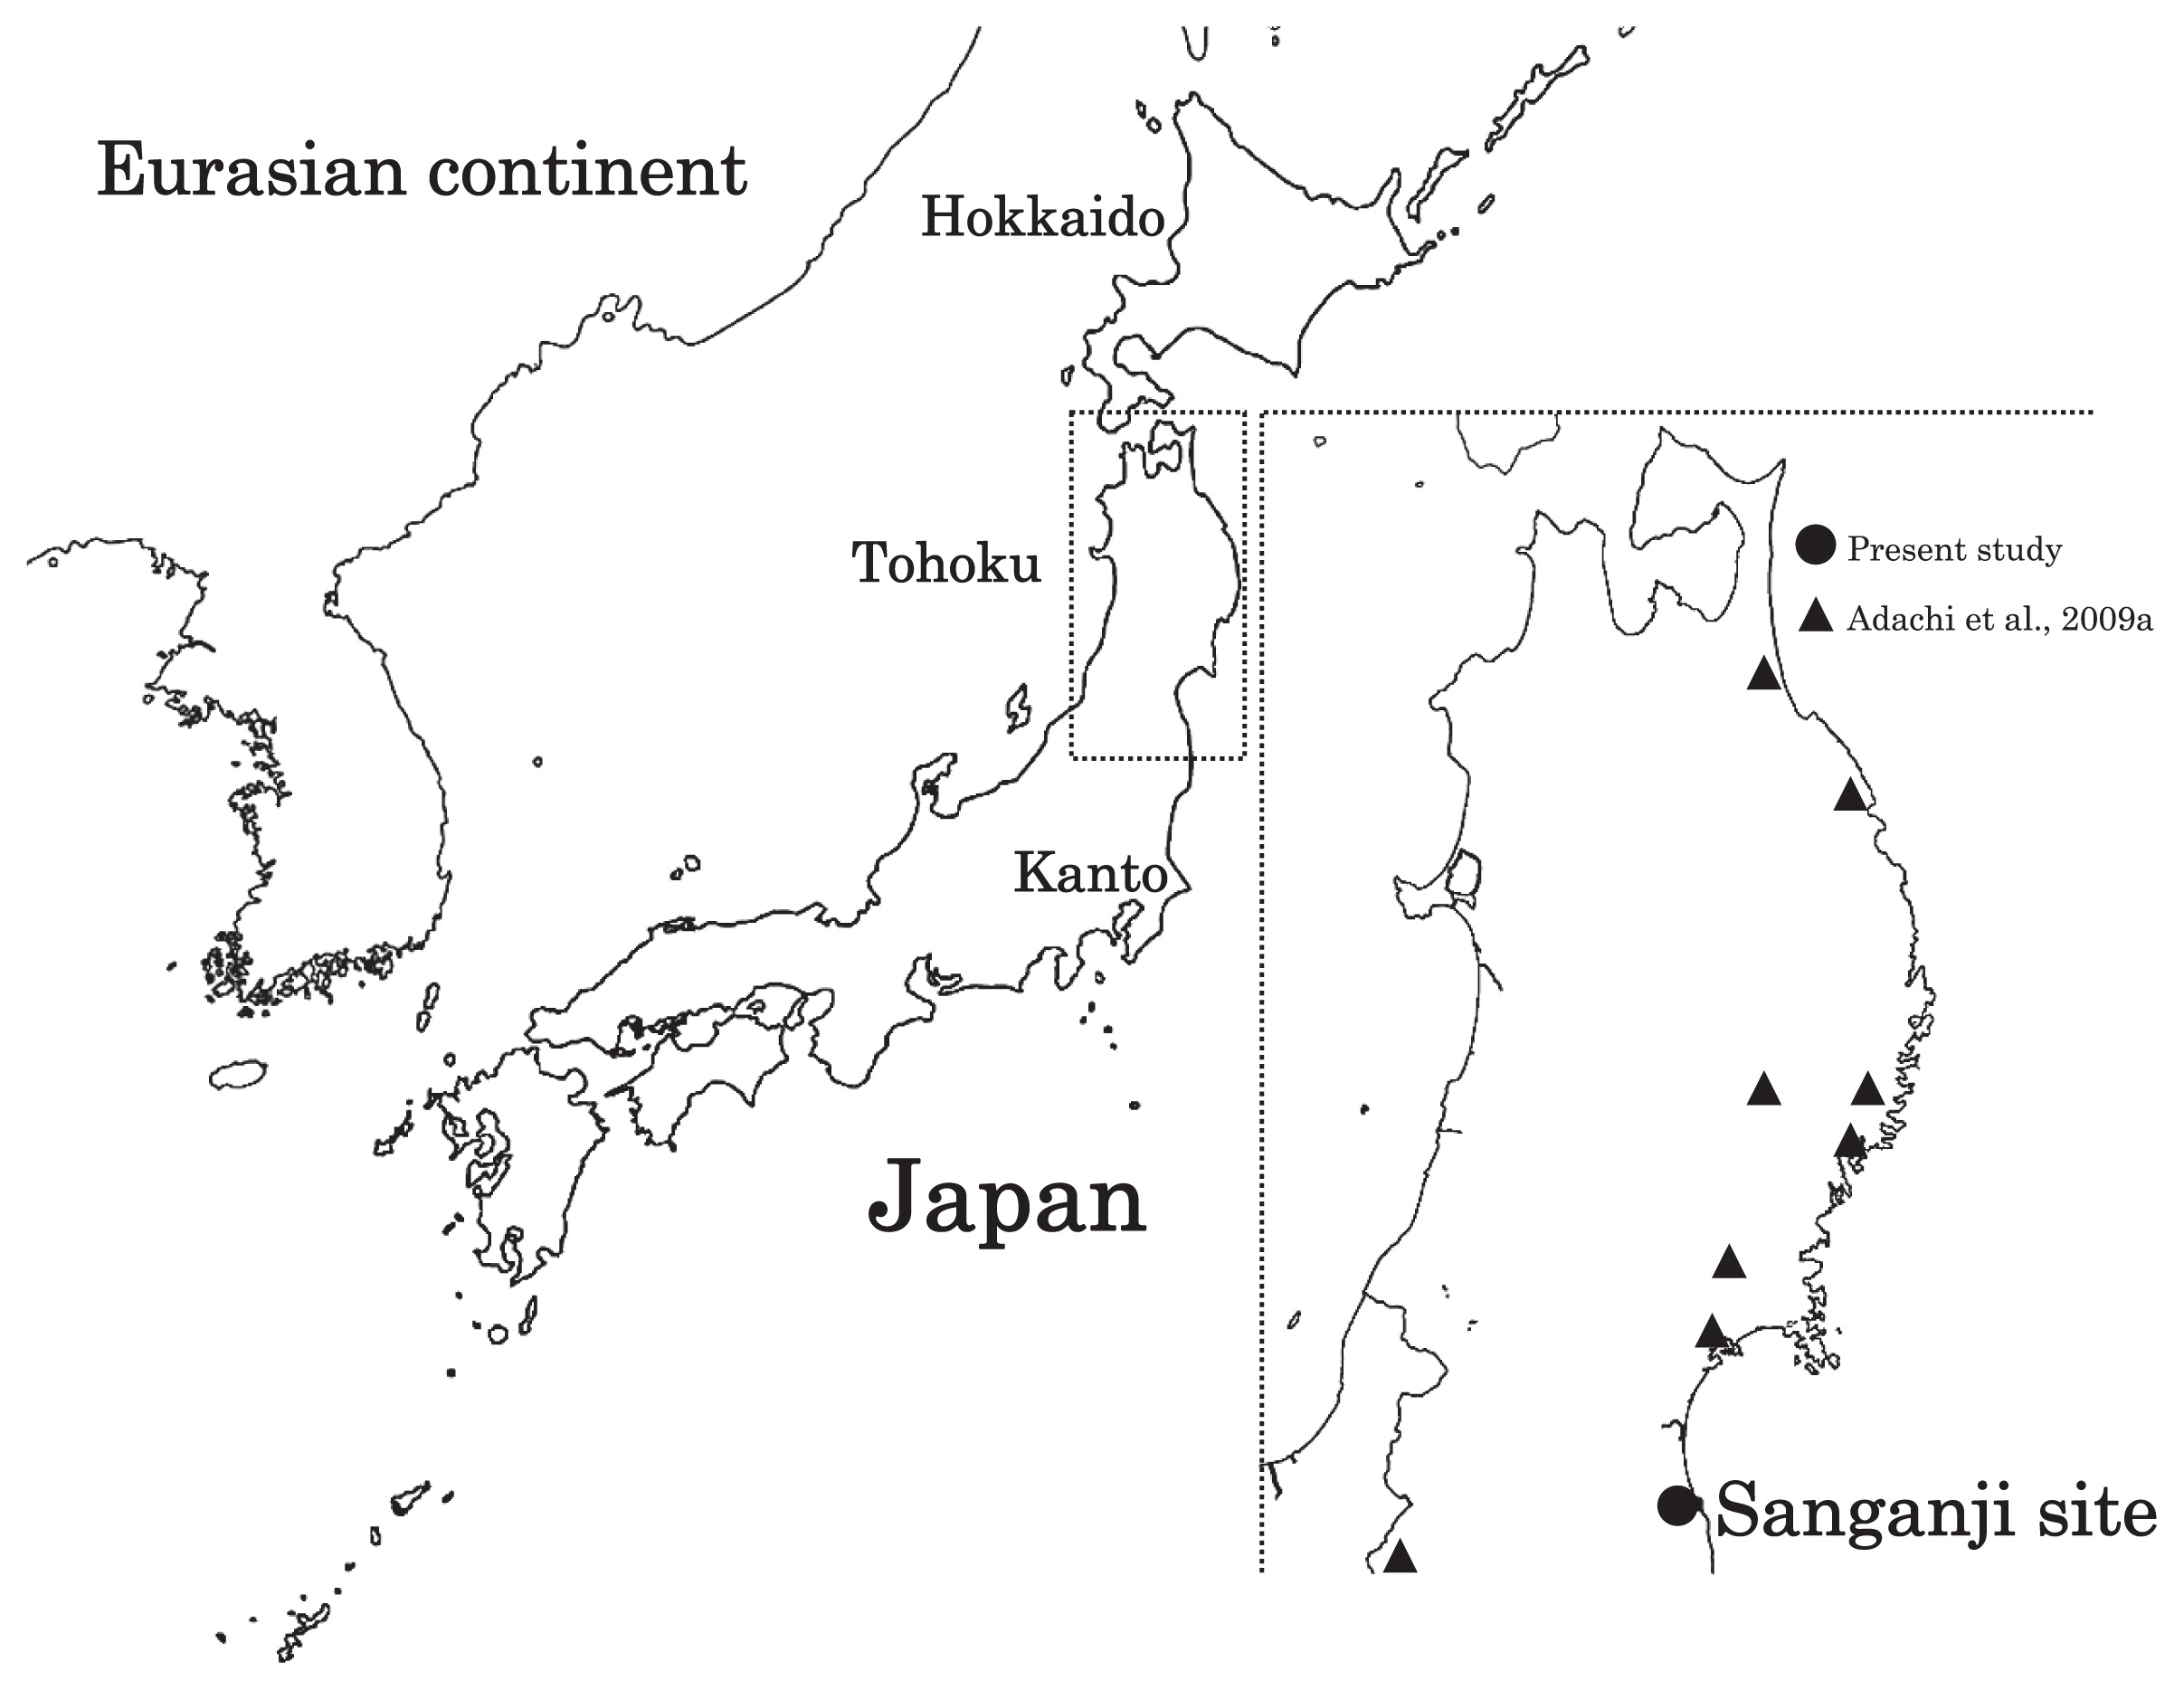
Geographical location of Sanganji site, and other sites of Tohoku Jomon people.
In this study, we analyzed samples taken from skeletal remains of the late to final Jomon period Sanganji shell mound site of Fukushima Prefecture, Tohoku district, Japan. The remains that we examined are part of the skeletal collection excavated in 1952 and 1954, and have been stored in The University Museum, The University of Tokyo for more than 50 years. It is known that excessive handling and long-term storage may influence the ability to obtain authentic endogenic DNA (Melchior et al., 2010). Because the success rates of ancient DNA studies increase when shorter DNA regions are analyzed (Pääbo et al., 2004; Haak et al., 2010), we focused on determining nucleotide sequences of the shorter mtDNA regions. As a result, in our sample of four, we were able to determine haplogroups with a 100% success rate. Our new results from the Sanganji Jomon materials, added to previous data (Adachi et al., 2009a), allow for more detailed population comparisons.
The Sanganji shell mound is located in the northern part of Fukushima Prefecture, Tohoku district (Figure 1). The chronological age of the burials, belonging to the late to final Jomon period, is considered to lie within the range from 4000 to 2500 years BP. The 1952–1954 excavations of the Sanganji Jomon skeletal remains were carried out by the Special Committee for Jomon Chronology of the Japanese Archaeological Association (1952 excavation), and by the Department of Anthropology, The University of Tokyo (1954 excavation). To analyze mtDNA haplogroups, we used teeth from four Sanganji Jomon individuals housed in The University Museum, The University of Tokyo (Table 1). Three of these came from skeletal remains catalogued as UMUT-131421 (Endo and Endo, 1979), which includes six to eight individuals from what is known as secondary burial C’ (Fukushima Museum, 1988). In the following analysis, we distinguish these three individuals by suffixes, 131421-1, 131421-2, and 131421-3. The fourth individual that we examined, UMUT-131464 (Endo and Endo, 1979), comes from secondary burial B, which includes approximately 10 individuals (Fukushima Museum, 1988). A single, well-preserved molar tooth was removed from the mandible of each individual (isolated teeth were excluded to avoid the possibility of sampling from the same individual). We chose mandibles which had both right- and left-side molars, so that the antimere of the analyzed tooth would remain available for general morphological studies. The ablation patterns of the Jomon people have been discussed in relation to population movement (Harunari, 2002; Funahashi, 2010). The tooth ablation type of individuals 131421-1 and 131421-2 (no mandibular teeth extracted) was probably 0-type (only the upper canine extracted, no mandibular tooth extraction). According to Harunari’s (2002) interpretations, this would indicate in-group status of the individuals and not immigration through marriage. If so, these two individuals may have been born at Sanganji, and it is possible that they were relatives.
| Sample ID | Sex | Tooth ablation type | Date of excavation | Analyzed tooth part |
|---|---|---|---|---|
| 131421-1 | Female? | 0a | 1954 | Right M3 |
| 131421-2 | Male | 0a | 1954 | Right M3 |
| 131421-3 | Male | ?b | 1954 | Right M2 |
| 131464 | Female | 2Cc | 1952 | Right M2 |
Tooth samples were soaked in a 13% sodium hypochlorite solution for 3 minutes, rinsed several times with HPLC-grade water (Wako, Japan), then treated with ultraviolet radiation at least overnight, and allowed to air-dry under ultraviolet radiation for 60 minutes. The outer surface of the samples was then removed using a heat-treated drill. Next, the samples were again rinsed with HPLC-grade water and allowed to air-dry under ultraviolet radiation for 60 minutes. The tip of the tooth root was cut horizontally using a cutting disk; the dental pulp was reduced to powder with a drill and collected in a tube. DNA extraction from the powdered samples was carried out based on the method of Rohland and Hofreiter (2007) with some modifications. The powdered samples were dissolved with 0.5 M EDTA (pH 8.0) (Wako, Japan) and 0.25 mg/ml proteinase K (TaKaRa, Japan) overnight at room temperature. The dissolved solution was centrifuged, and the supernatant was collected. The collected solution was concentrated using VivaSpin6 (Sartorius, Japan) to a volume less than 300 μl. The concentrated solution was added to 1.5 ml binding buffer (5 M GuSCN, 25 mM NaCl, and 50 mM Tris, pH 8.0) plus 100 μl silica suspension (Sigma) and incubated under agitation for 3 hours at room temperature. The silica pellet was collected via centrifugation, the supernatant was removed, and the pellet was washed twice with binding buffer. Subsequently, the pellet was dried at room temperature for 15 minutes. DNA was eluted with 50 μl 1 × TE buffer at room temperature for 10 minutes, and, after centrifugation, the aqueous solution was transferred to a new tube. DNA was eluted twice, and 100 μl of DNA extract was finally obtained from each sample.
PCR amplification and sequencingAncient DNA is invariably of shorter length, and the length of the DNA sequences that can be amplified by polymerase chain reaction (PCR) is limited (Pääbo et al., 2004; Haak et al., 2010). Moreover, as heavy handling and prolonged storage influence the ability to obtain authentic endogenic DNA (Melchior et al., 2010), we anticipated that the analysis of Sanganji Jomon samples, excavated in 1952 and 1954, would be difficult and the success rate would be low. To overcome this problem, in addition to the primers that target long DNA segments (158–195 bp), we used short lengths of target DNA (58–90 bp) containing haplogroup-specific SNPs, because shorter DNA regions are more readily amplified by PCR than longer DNA regions (Pääbo et al., 2004; Haak et al., 2010).
To determine mtDNA haplogroups, hypervariable region (HVR)-1, HVR-2, 28 haplogroup/sub-haplogroup-specific single nucleotide polymorphisms (SNPs), and a 9 bp repeat variation in the noncoding cytochrome oxidase II/tRNALys intergenic region, were analyzed following previous publications (Umetsu et al., 2005; van Oven and Kayser, 2008; Adachi et al., 2009a, b, 2011; Haak et al., 2010). The primers used to amplify HVR-1, HVR-2, and haplogroup-determining regions are listed in Table 2 and Table 3. Analyzed haplogroups were compared with those of modern Japanese and Jomon people (Horai et al., 1996; Shinoda and Kanai, 1999; Shinoda, 2003; Maruyama et al., 2003; Tajima et al., 2004; Tanaka et al., 2004; Adachi et al., 2008, 2009a, b, 2011; Matsukusa et al., 2010). To further characterize the sub-haplogroups within N9 and M7a, we used additional primers listed in Table 4.
| Primer | Nucleotide positionsb | Product size | |
|---|---|---|---|
| ID | Sequencea | ||
| L127 | AGCACCCTATGTCGCAGTAT | 128–256 | 169 |
| H257 | TCTGTGTGGAAAGCGGCTGT | ||
| L15998 | CCATTAGCACCCAAAGCTA | 15999–16141 | 182 |
| H16142 | ATGTACTACAGGTGGTCAAG | ||
| L16120 | TTACTGCCAGCCACCATGAA | 16121–16238 | 158 |
| H16239 | TGGCTTTGGAGTTGCAGTTG | ||
| L16208 | CCCCATGCTTACAAGCAAG | 16209–16366 | 195 |
| H16367 | CTGAGGGGGGTCATCCAT | ||
| Haplogroup | Haplogroup-defining mutations | Primer | Nucleotide positionsa | Product size | |
|---|---|---|---|---|---|
| ID | Sequence (5′–3′) | ||||
| M/D5 | 10400/10397 | M13-L10382 | (-21M13)b AAGTCTGGCCTATGAGTGACTACAA |
10383–10420 | 85 |
| M13R-H10421 | (M13RVN)c TGAGTCGAAATCATTCGTTTTG |
||||
| N | 10873 | M13-L10870 | (-21M13)CCACAGCCTAATTATTAGCATCATC | 10871–10887 | 67 |
| M13R-H10888 | (M13RVN)GCTAAATAGGTTGTTGTTGATTTGG | ||||
| A/G | 4824/4833 | M13-L4812 | (-21M13)TAGCCCCCTTTCACTTCTGA | 4813–4841 | 68 |
| M13R-H4842 | (M13RVN)AAGAAGCAGGCCGGATGT | ||||
| B | 8281–8289 deletion | M13-L8268 | (-21M13)AATAGGGCCCGTATTTACCCTATA | 8269–8294 | 78 |
| M13R-H8295 | (M13RVN)AGGTTAATGCTAAGTTAGCTTTACAGTG | ||||
| D | 5178 | M13-L5171 | (-21M13)ACCCTACTACTATCTCGCACCTGA | 5172–5203 | 76 |
| M13R-H5204 | (M13RVN)CTAGGGAGAGGAGGGTGGAT | ||||
| D4/E | 3010/3027 | M13-L3005 | (-21M13)CTCGATGTTGGATCAGGACA | 3006–3028 | 60 |
| M13R-H3029 | (M13RVN)TCGTTGAACAAACGAACCTT | ||||
| F | 10310 | M13-L10298 | (-21M13)CCCTACCATGAGCCCTACAA | 10299–10325 | 72 |
| M13R-H10326 | (M13RVN)GGATGATGATTAATAAGAGGGATGA | ||||
| M7 | 9824 | M13-L9816 | (-21M13)TTTTGTAGCCACAGGCTTCC | 9817–9850 | 74 |
| M13R-H9851 | (M13RVN)GGCGGATGAAGCAGATAGTG | ||||
| M7a | 2772 | M13-L2742 | (-21M13)GAGAAGACCCTATGGAGCTTTAAT | 2743–2777 | 83 |
| M13R-H2778 | (M13RVN)TAATGCAGGTTTGGTAGTTTAGGA | ||||
| M7c | 5442 | M13-L5434 | (-21M13)AAATGACAGTTTGAACATACAAAACC | 5435–5470 | 86 |
| M13R-H5471 | (M13RVN)AAAGGGGAGATAGGTAGGAGTAGC | ||||
| M8 | 15487T | M13-L15450 | (-21M13)GCCCTCGGCTTACTTCTCTT | 15451–15488 | 76 |
| M13R-H15489 | (M13RVN)CTGGGTCGCCTAGGAGGT | ||||
| M9 | 3394 | M13-L3376 | M13-GGCATTCCTAATGCTTACCG | 3377–3396 | 60 |
| M13R-H3397 | (M13RVN)GGGCCTTTGCGTAGTTGTAT | ||||
| M10 | 15071 | M13-L15057 | (-21M13)ATCGGGCGAGGCCTATATTA | 15058–15076 | 59 |
| M13R-H15077 | (M13RVN)ATGCCGATGTTTCAGGTTTC | ||||
| M12/M7b | 4170/4164 | M13-L4151 | (-21M13)GAACAGCATACCCCCGATT | 4152–4176 | 77 |
| M13R-H4177 | (M13RVN)TGCTAGGGTGAGTGGTAGGAA | ||||
| N9 | 5417 | M13-L5385 | (-21M13)TCCACCTCAATCACACTACTCC | 5386–5421 | 78 |
| M13R-H5422 | (M13RVN)TGGGGTGGGTTTTGTATGTT | ||||
| Haplogroup | Haplogroup-defining mutations | Primer | Nucleotide positionsa | Product size | |
|---|---|---|---|---|---|
| ID | Sequence (5′-3′) | ||||
| M7a1 | 14364 | M13-L14357 | (-21M13)b CCACCCCATCATACTCTTTCA |
14358–14398 | 83 |
| M13R-H14399 | (M13RVN)c GGTTGAGGTCTTGGTGAGTGT |
||||
| 16324 | M13-L16302 | (-21M13)CAAACCTACCCACCCTTAACA | 16303–16345 | 84 | |
| M13R-H16346 | (M13RVN)GGGACGAGAAGGGATTTGAC | ||||
| M7a2 | 15422 | M13-L15401 | (-21M13)CCTCCCATTCCGATAAAATCA | 15402–15426 | 65 |
| M13R-H15427 | (M13RVN)AAGTAAGCCGAGGGCGTCT | ||||
| 16140 | M13-L16119 | (-21M13)ATTACTGCCAGCCACCATGA | 16120–16169 | 90 | |
| M13R-H16170 | (M13RVN)AGGGGGTTTTGATGTGGATT | ||||
| N9a | 5231 | M13-L5217 | (-21M13)AATTCCATCCACCCTCCTCT | 5218–5237 | 58 |
| M13R-H5238 | (M13RVN)GGGCAAAAAGCCGGTTAG | ||||
| N9b | 13183 | M13-L13147 | (-21M13)CCCCCTAGCAGAAAATAGCC | 13148–13187 | 80 |
| M13R-H13188 | (M13RVN)AGACTGCTGCGAACAGAGTG | ||||
| N9b1 | 12501 | M13-L12492 | (-21M13)TCAGTCTCTTCCCCACAACA | 12493–12523 | 71 |
| M13R-H12524 | (M13RVN)GGCTCAGTGTCAGTTCGAGA | ||||
| N9b2 | 16294 | M13-L16292 | (-21M13)CACTAGGATACCAACAAACCTACCC | 16293–16326 | 84 |
| M13R-H16327 | (M13RVN)TTTGACTGTAATGTGCTATGTACGG | ||||
| N9b3 | 14996 | M13-L14965 | (-21M13)CCCACATCACTCGAGACGTA | 14966–14997 | 72 |
| M13R-H14998 | (M13RVN)AGAATATTGAGGCGCCATTG | ||||
| Y | 8392 | M13-L8380 | (-21M13)CAGTGAAATGCCCCAACTAAAT | 8381–8394 | 59 |
| M13R-H8395 | (M13RVN)GGAGTATGGGGGTAATTATGGTG | ||||
A total of 1 μl of the extracted DNA was used as the template for PCR. Amplifications were carried out in a total reaction volume of 20 μl containing of 0.5 μM of each primer, and the Multiplex PCR assay kit (TaKaRa) reagents. The PCR conditions were incubation at 94°C for 30 sec, followed by 42 cycles of 94°C for 30 sec, 54°C for 20 sec, 72°C for 15 sec, and 1 cycle of 72°C for 10 min. An aliquot (2.5 μl) of the PCR product was checked on a 2% agarose gel, and the remainder (17.5 μl) was then purified with Monofas (GL Sciences). The PCR products of SNP analysis were used as template for direct nucleotide sequencing, but we performed cloning of the PCR products of HVR-1 and HVR-2 because of these small quantities. Sequencing reactions were performed with BigDye Terminators v. 1.1 Cycle Sequencing kit (Applied Biosystems, Foster City, CA), and -21M13 and M13RVN primers were used in direct sequencing. All sequencing reactions were carried out using 3130 DNA Sequencer (Applied Biosystems), and the sequence of each region was compared with the revised Cambridge Reference Sequence (CRS) (Andrews et al., 1999).
Contamination precautionsDuring each sample-handling step, the following precautions were taken to minimize the risk of contamination.
1. The equipment used (drill, pipettes, centrifuge, vortex machine, and PCR rack) were treated with a DNA contamination removal solution (DNA-AWAY, Molecular BioProducts, San Diego, CA) and with ultraviolet irradiation.
2. Some heat-resistant implements (tube rack made of stainless steel, drill tips, cutting disk, and glass bottle) were treated with dry heat sterilization at 200°C for 12 hours.
3. Disposable equipment (tubes and filtered pipette tips) was irradiated with ultraviolet rays.
4. The working area was divided into pre-PCR and post-PCR areas.
5. The clean-bench was treated with overnight ultraviolet radiation.
6. Gloves, face masks, and clean-room items (coats, caps, shoes, and socks) were also used when ancient DNA samples were handled.
7. Clean-room items were treated with ultraviolet irradiation overnight.
8. To exclude any possible contamination from modern human DNA, simultaneous negative controls during DNA extraction and PCR amplification steps were added.
Data analysisTo investigate the relationship between the Tohoku Jomon people and the other ancient and modern East Asians, we compared mtDNA haplogroup frequencies (Appendix 1) using Arlequin v. 3.11 (Excoffier et al., 2005). For pairwise population comparisons, the Fst formula used in Arlequin is identical to the weighted average F-statistic over loci, θw, defined by Weir and Cockerham (1984) (Michalakis and Excoffier, 1996). The equation to calculate Fst-values is as follows:
| (1) |
| (2) |
| (3) |
| (4) |
where au, bu, and cu are the observed components of variance (au for between populations, bu for between individuals within populations, and cu for between gametes within individuals); n bar is the average sample size; nc is the squared coefficient of variation of sample sizes; p bar is the average sample frequency of alleles; s2 is the sample variance of allele frequencies over populations; h bar is the average heterozygote frequency for alleles. For further details, see Weir and Cockerham (1984).
Three ancient populations, the Hokkaido (Adachi et al., 2011), Tohoku (present study; Adachi et al., 2009a), and Kanto Jomon (Shinoda and Kanai, 1999; Shinoda, 2003), the Okhotsk people (Sato et al., 2009), and the following 14 modern populations were compared: Ainu (Tajima et al., 2004), mainland Japanese (Maruyama et al., 2003), Ryukyuan (Umetsu et al., 2005), Korean (Lee et al., 2006), northern Chinese (Yao et al., 2002), Yangtze River region Chinese (Yao et al., 2002), southern Chinese (Yao et al., 2002), Aboriginal Taiwanese (Trejaut et al., 2005), northern Siberians (Starikovskaya et al., 1998), Kamchatkans (Schurr et al., 1999), Ulchi (Starikovskaya et al., 2005), Udegey (Starikovskaya et al., 2005), Nivkhi (Starikovskaya et al., 2005), and Negidal (Starikovskaya et al., 2005). Principal component analysis (PCA) scatterplots and phylogenetic networks were constructed with R (R Development Core Team, 2010) and splitstree4 (Huson and Bryant, 2006), respectively, based on pairwise Fst-values.
We successfully determined the mtDNA haplogroup of all four individuals that we examined (Table 5), using the primer pairs targeting short DNA segments (58–90 bp). In each individual, all SNP sites were consistent with previously observed haplogroups, and this thus reduces the chance of contamination. When we used the primer pairs targeting long DNA segments (158–195 bp) in the analysis of HVR, the amplification efficiency and quantity of PCR products decreased dramatically, possibly due to the sample conditions. This corresponds to the observations of Pääbo et al. (2004) and Haak et al. (2010). To estimate the level of modern DNA contamination, long PCR products were sequenced with cloning. In these analysis, some PCR products contained sequences that were inconsistent with the SNP analysis. This indicates that, to reduce the effect of contamination in the analysis of ancient DNA, focusing on short DNA regions is better, and we need to reduce the number of PCR cycles.
| Haplogroup | Nucleotide positiona | Sample | Sanganji131421-1 | Sanganji131421-2 | Sanganji131421-3 | Sanganji131464 |
|---|---|---|---|---|---|---|
| Sex | F? | M | M | f | ||
| Tooth ablation type | 0 | 0 | 4I? | 2C | ||
| rCRSb | ||||||
| M | 10400 | C | T | T | C | C |
| N | 10873 | T | C | C | T | T |
| A | 4824 | A | A | A | A | A |
| B | 8281–8289 deletion | 2 | 2 | 2 | 2 | 2 |
| D | 5178 | C | C | C | C | C |
| D4 | 3010 | G | ND | ND | ND | ND |
| D5 | 10397 | A | A | A | A | A |
| E | 3027 | T | ND | ND | ND | ND |
| F | 10310 | G | G | G | G | G |
| G | 4833 | A | A | A | A | A |
| M7 | 9824 | T | C | C | T | T |
| M7a | 2772 | C | T | T | — | — |
| M7a1 | 14364 | G | G | G | — | — |
| 16324 | T | T | T | — | — | |
| M7a2 | 15422 | A | G | G | — | — |
| 16140 | T | C | C | — | — | |
| M7b | 4164 | C | C | C | C | C |
| M7c | 5442 | T | ND | ND | — | — |
| M8 | 15487T | A | A | A | A | A |
| M9 | 3394 | T | ND | ND | ND | ND |
| M10 | 15071 | T | T | T | T | T |
| M12 | 4170 | A | A | A | A | A |
| N9 | 5417 | G | G | G | A | A |
| N9a | 5231 | G | — | — | G | G |
| N9b | 13183 | A | — | — | G | G |
| N9b1 | 12501 | G | — | — | G | G |
| N9b2 | 16294 | C | — | — | C | — |
| N9b3 | 14996 | G | — | — | G | G |
| Y | 8392 | G | — | — | ND | ND |
| HVR | 128–256 | ND | 146 | ND | CRS | |
| 15999–16141 | ND | ND | ND | ND | ||
| 16121–16238 | ND | ND | ND | ND | ||
| 16209–16366 | ND | ND | ND | 16256, 16294 | ||
| Haplogroup | M7a2 | M7a2 | N9b* | N9b2 |
ND, not determined; —, not analyzed; diagnostic polymorphisms are emphasized by bold type. Haplogroup B has a 9 bp (CCCCCTCTA) deletion. ‘1’ denotes the presence of the 9 bp deletion, and ‘2’ denotes nondeletion (i.e. two repeats of the 9 bp fragment).
Two of the four Sanganji Jomon individuals belonged to haplogroup N9b (Table 5, Table 6). Haplogroup N9b has been observed in the northern Jomon populations at high frequencies: Hokkaido Jomon, 64.8% (Adachi et al., 2011); Tohoku Jomon, 63.2% (Adachi et al., 2009a); and we found this haplogroup in high frequency (50.0%) in the Sanganji Jomon, although based on a small sample size. On the contrary, the frequency of haplogroup N9b was low in the Kanto Jomon at 5.6% (Shinoda and Kanai, 1999, Shinoda, 2003). In modern populations, haplogroup N9b is present in the Japanese archipelago at low frequencies (<10%) (Maruyama et al., 2003; Tajima et al., 2004; Umetsu et al., 2005), but at a high frequency (30.4%) in the Udegey from southern Siberia. It seems that haplogroup N9b was one of the main haplogroups in ancient and modern Northeast Asian populations.
| Populations | |||||||||||
|---|---|---|---|---|---|---|---|---|---|---|---|
| Ancient East Asians | Southern Siberian | Modern East Asians | |||||||||
| Sanganji Jomon | Tohoku Jomon | Hokkaido Jomon | Kanto Jomona | Okhotsk | Ulchi | Udegey | Ainua | Mainland Japanese | Ryukyuan | Korean | |
| References | This study | Adachi et al., 2009a | Adachi et al., 2011 | Shinoda and Kanai, 1999; Shinoda, 2003 | Sato et al., 2009 | Starikovskaya et al., 2005 | Starikovskaya et al., 2005 | Tajima et al., 2004 | Tanaka et al., 2004 | Umetsu et al., 2005 | Lee et al., 2006 |
| n | 4 | 19 | 54 | 54 | 37 | 87 | 46 | 51 | 672 | 326 | 591 |
| N9b1 | (63.2)b | 55.6 | (5.6)b | (10.8)b | (6.9)b | (30.4)b | (7.8)b | 1.3 | (4.6)b | (0.3)b | |
| N9b2 | 25.0 | 0.6 | |||||||||
| N9b3 | 0.3 | ||||||||||
| N9b* | 25.0 | 9.3 | 0.4 | ||||||||
The sub-haplogroups observed at the highest frequency in each population are emphasized by bold type.
We further subdivided the haplogroup N9b observed in the two Sanganji Jomon individuals using specific primers into four sub-haplogroups (N9b1, N9b2, N9b3, and N9b*) (Table 4). Samples which could not be designated to sub-haplogroups N9b1, N9b2, and N9b3 were classified as sub-haplogroup N9b*. Of the two Sanganji Jomon samples, one was classified as sub-haplogroup N9b2 and another was classified as sub-haplogroup N9b*. In the Hokkaido Jomon, although sub-haplogroup N9b* was observed, sub-haplogroup N9b2 has so far not been observed. The Sanganji results may hint at some population differentiation among the northern Jomon populations.
Haplogroup M7a is classified into three sub-haplogroups, M7a1, M7a2, and M7a*. Individuals who were not classified into sub-haplogroups M7a1 and M7a2 were classified into sub-haplogroup M7a*. We found that two Sanganji individuals belonged to haplogroup M7a2 (Table 5, Table 7). In modern populations, haplogroup M7a1 was observed in modern Japanese populations at a high frequency: Ainu, 15.7% (Tajima et al., 2004); mainland Japanese, 9.5% (Maruyama et al., 2003); Ryukyuan, 26.6% (Horai et al., 1996, Matsukusa et al., 2010). However, haplogroup M7a2 was scarcely observed in the mainland Japanese (0.5%), and this haplogroup was not observed in the Ryukyuan. On the contrary, haplogroup M7a2 was observed in the Udegey from southern Siberia at high frequency (19.6%, Starikovskaya et al., 2005).
| Populations | ||||||||||
|---|---|---|---|---|---|---|---|---|---|---|
| Ancient East Asians | Modern populations | |||||||||
| Sanganji Jomon | Tohoku Jomon | Hokkaido Jomon | Kanto Jomona | Okhotsk | Udegey | Ainua | Mainland Japanese | Ryukyuana | Korean | |
| References | This study | Adachi et al., 2009a | Adachi et al., 2011 | Shinoda and Kanai, 1999; Shinoda, 2003 | Sato et al., 2009 | Starikovskaya et al., 2005 | Tajima et al., 2004 | Maruyama et al., 2003 | Horai et al., 1996; Matsukusa et al., 2010 | Lee et al., 2006 |
| n | 4 | 19 | 54 | 54 | 37 | 46 | 51 | 211 | 274 | 591 |
| M7a1 | 3.7 | 15.7 | 9.5 | 26.6 | 1.3 | |||||
| M7a2 | 50.0 | (31.6)b | 1.9 | 5.4 | 19.6 | 0.5 | ||||
| M7a*c | 5.6 | 1.1 | 0.2 | |||||||
The haplogroups observed at the highest frequency in each population are emphasized by bold type.
In ancient East Asian populations, haplogroup M7a (which includes M7a1, M7a2, and M7a*) is widely observed in the Jomon people (Hokkaido Jomon, 7.4%; Tohoku Jomon, 31.6%; Kanto Jomon, 3.7%). That the Sanganji Jomon (present study) also had this haplogroup apparently at high frequency (50.0%) supports the suggestion of Adachi et al. (2009b) that haplogroup M7a is a putative ‘Jomon genotype.’ However, we have now identified the occurrence of sub-haplogroup M7a2 for the first time in the Tohoku Jomon, which enables some further considerations.
Although the currently available data is still limited, interestingly, the frequencies of haplogroups M7a1 and M7a2 appear quite different among the Jomon people (Table 7). This may indicate that during the later Jomon period, M7a1 was mainly distributed in the middle to southern part of the Japanese archipelago, and haplogroup M7a2 (and also M7a*) was distributed further north, from the Tohoku and Hokkaido regions of the Japanese archipelago and southern Siberia. Adachi et al. (2011) suggested that haplogroup M7a was of southern origin, and that this haplogroup was introduced to Japan around the last glacial maximum (LGM). If we accept this suggestion, haplogroup M7a2, which is observed in the northern Jomon people, might have originated after the introduction of M7a into the Japanese archipelago. The sub-haplotype then subsequently became distributed further northward by migration, and must have reached southern Siberia.
The tooth ablation type of Sanganji individuals 13142-1 and 13142-2 was both probably the 0-type (only the upper canine extracted, no mandibular tooth extraction), which suggests an in-group status of the individuals according to Harunari’s (2002) interpretation of ablation patterns. On the other hand, individual 13142-3 did not exhibit a clear pattern and 131464 was the 2C-type, which suggests an out-group status. Therefore, individuals 13142-1 and 13142-2, both possibly born at Sanganji and with the same haplotype, could have been relatives. However, since sub-haplogroup M7a2 might have been the major type in that region, it is also possible that they shared the same haplotype without having any genealogical relationship.
The genetic transition from the Jomon people to modern Japanese is explained by the ‘dual structure model,’ according to which a substantial number of Yayoi people migrated into the Japanese archipelago via the Korean peninsula about 3000 years ago, and admixed with Jomon people (Hanihara, 1991). This model also suggests that the effect of the Yayoi immigrants is small in the Ainu and Ryukyuan peoples, who live at the margins of the Japanese archipelago and retain more Jomon components than the mainland Japanese. In fact, this expected pattern was recently observed from the comparison of genome-wide autosomal SNP data for the Ainu, the Ryukyuan, and the mainland Japanese populations (Japanese Archipelago Human Population Genetics Consortium, 2012). Therefore, high frequencies of the ‘Jomon genotype’ (haplogroup N9b and M7a) in the Ainu and Ryukyuan peoples have been considered to partially support this model (Adachi et al., 2009b). Thus, it is expected that the Ainu people who live in Hokkaido, the northernmost Japanese archipelago, would have haplogroups M7a* and M7a2 in high frequencies, because the northern Jomon populations have been so far shown to have these haplogroups. However, the Ainu people have only haplogroup M7a1 (Table 7). This may indicate either sample bias, or that the haplogroup M7a of the Ainu was not derived from the indigenous northern Jomon genotype, and that this haplogroup was introduced into the Ainu population after the Jomon period. The latter interpretation implies that the genetic effect from mainland Japan after the Jomon period was stronger than previously considered.
To investigate the relationships between the Jomon people from the Tohoku region (Sanganji Jomon, present study; the Tohoku Jomon, Adachi et al., 2011) and other East and Northeast Asian ancient and modern populations, a statistical analysis based on haplogroup frequencies (Appendix 1) was performed. In this analysis, we merged sub-haplogroups N9b1, N9b2, N9b3, and N9b* into haplogroup N9b, and sub-haplogroups M7a1, M7a2, and M7a* into haplogroup M7a, because sub-haplogroup frequency data were missing in some populations used in the statistical analysis (Table 6, Table 7). The approximate geographical locations of these populations are shown in Figure 1 and Figure 2.
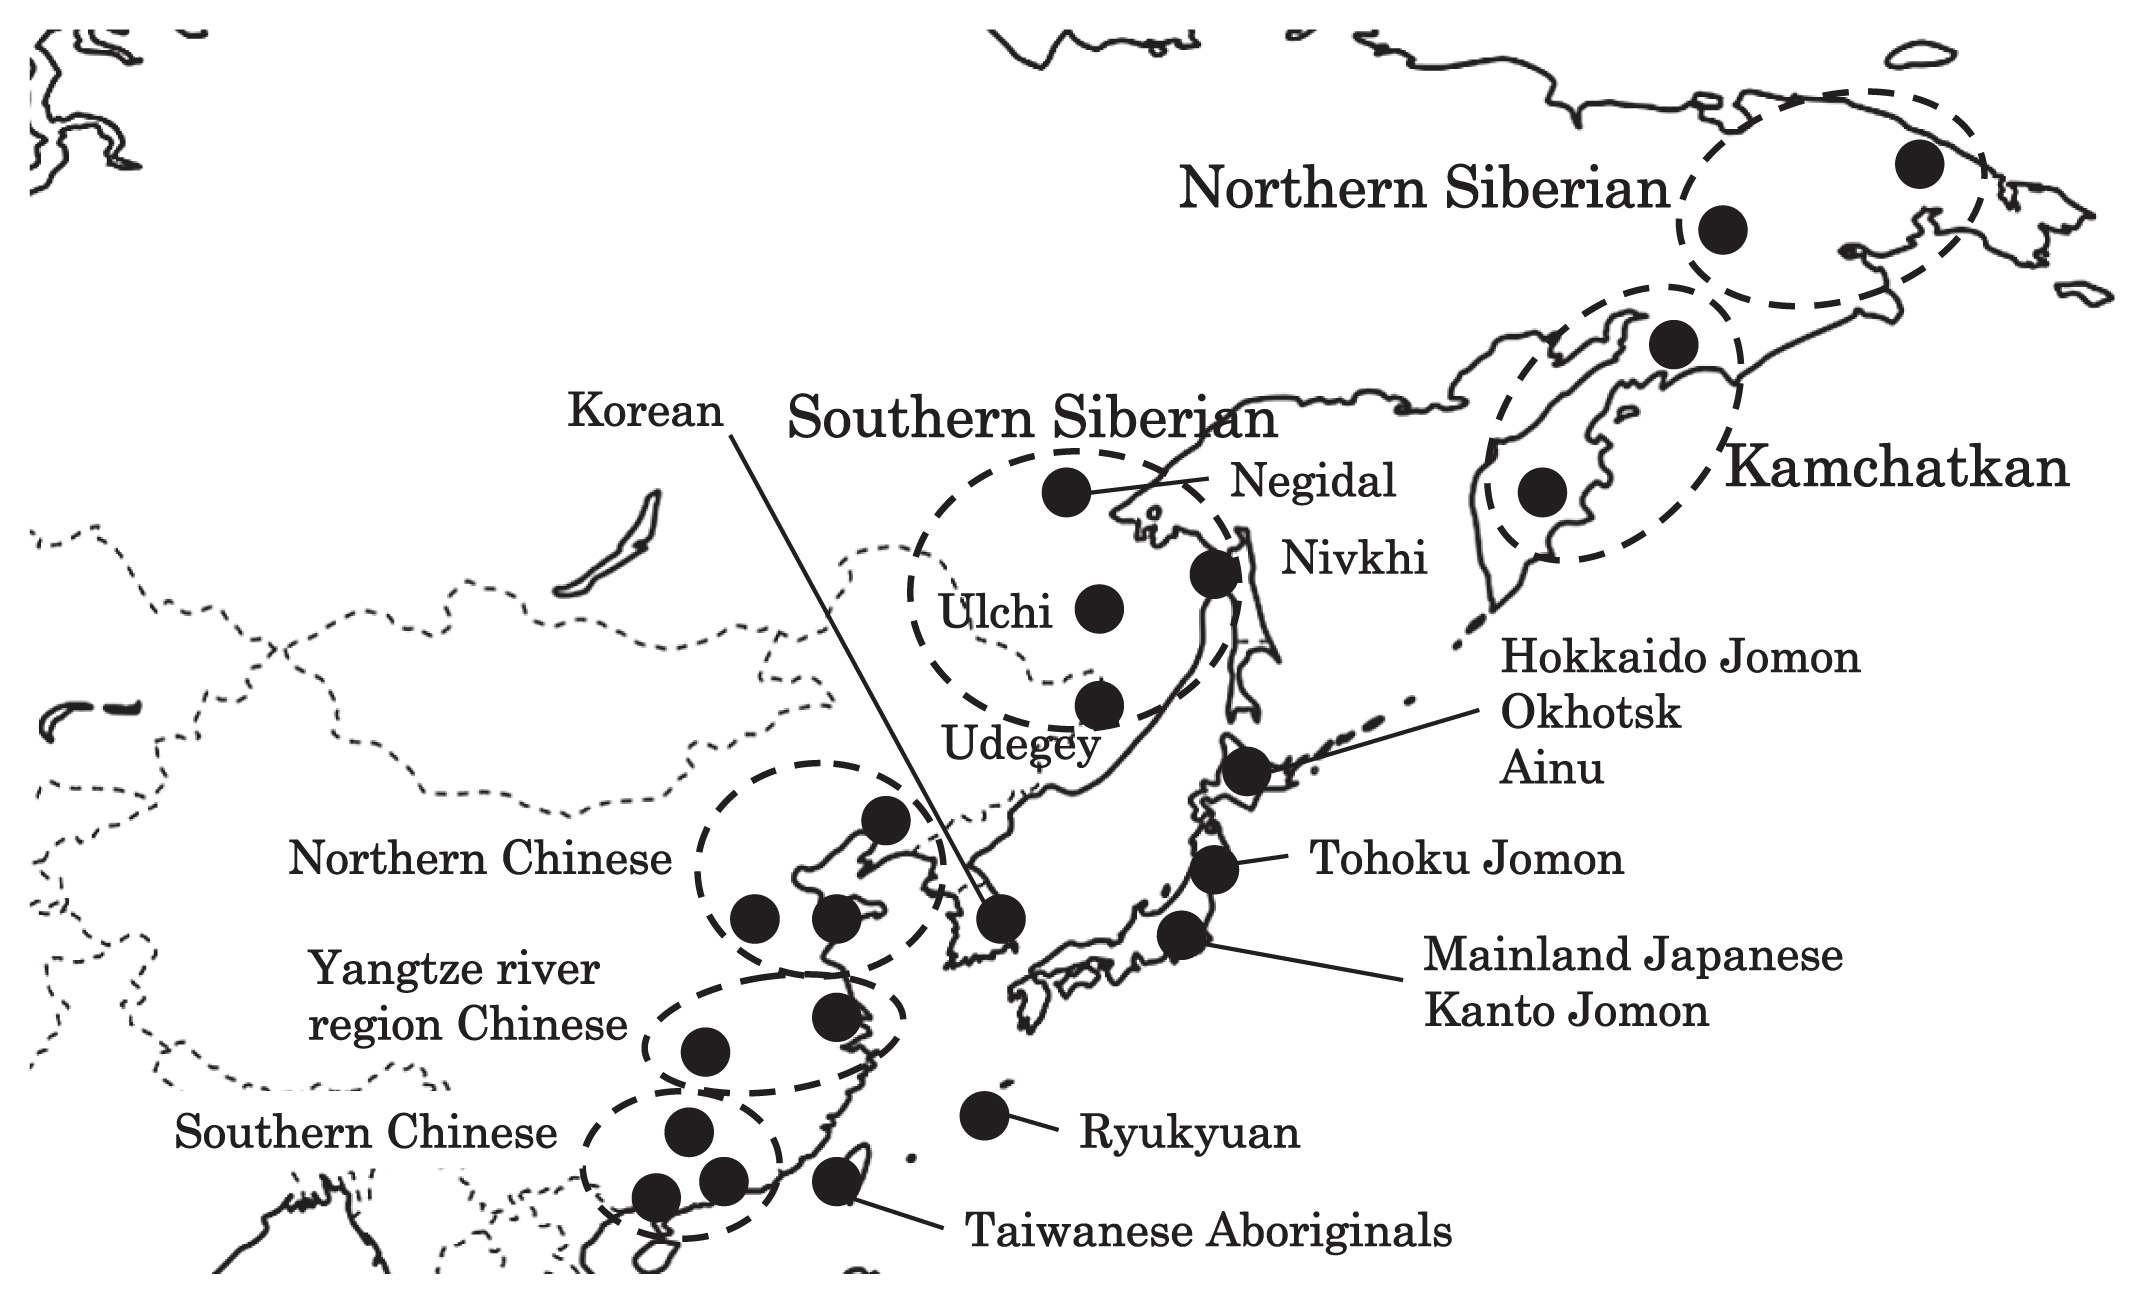
A map of East Eurasia and geographic locations of the East Asian and Siberian populations compared in the present study.
Within the Japanese archipelago, contrasting opinions on the population structure of the Jomon have been proposed: the Jomon people were relatively homogeneous (Dodo, 1982; Yamaguchi, 1982; Kondo, 1994; Ossenberg et al., 2006; Matsumura, 2007) or heterogeneous (Adachi et al., 2009a, b; Hanihara and Ishida, 2009; Nakashima et al., 2010). When comparing the ancient populations of the Japanese archipelago (Kanto, Tohoku, and Hokkaido Jomons and Okhotsk), the population differentiation test demonstrated that they were statistically different from each other (highest P-value was 0.007 between the Tohoku and Hokkaido Jomon). This indicates inter-regional heterogeneity of the ancient Japanese archipelago populations, consistent with results of recent genetic (Adachi et al., 2009a, b) and morphological (Hanihara and Ishida, 2009; Nakashima et al., 2010) research.
Next, in order to obtain, for the first time, an indication of overall genetic similarities of the Jomon regional populations as seen from the mtDNA haplotypes, we computed Fst values between population pairs. The P-values between the Tohoku Jomon and the other ancient or modern comparative populations were less than 5%, based on 100 permutations of the Arlequin software. The results showed a close genetic similarity between the Tohoku and Hokkaido Jomon people (Fst = 0.061, P = 0.036 ± 0.015) (Appendix 2), and support previous interpretations that the Jomon ancestors of the northern part of Japan (Hokkaido) might have expanded southward to Honshu Island with a series of bottlenecks (Hanihara and Ishida, 2009; Nakashima et al., 2010). However, genetic similarity between the Tohoku Jomon and the geographically adjacent Kanto Jomon was not observed (Fst = 0.268); the differences are shown in the PCA plot and the phylogenetic network (Figure 3, Figure 4). These results are an indication of genetic differences between the Kanto and northern Jomon populations.
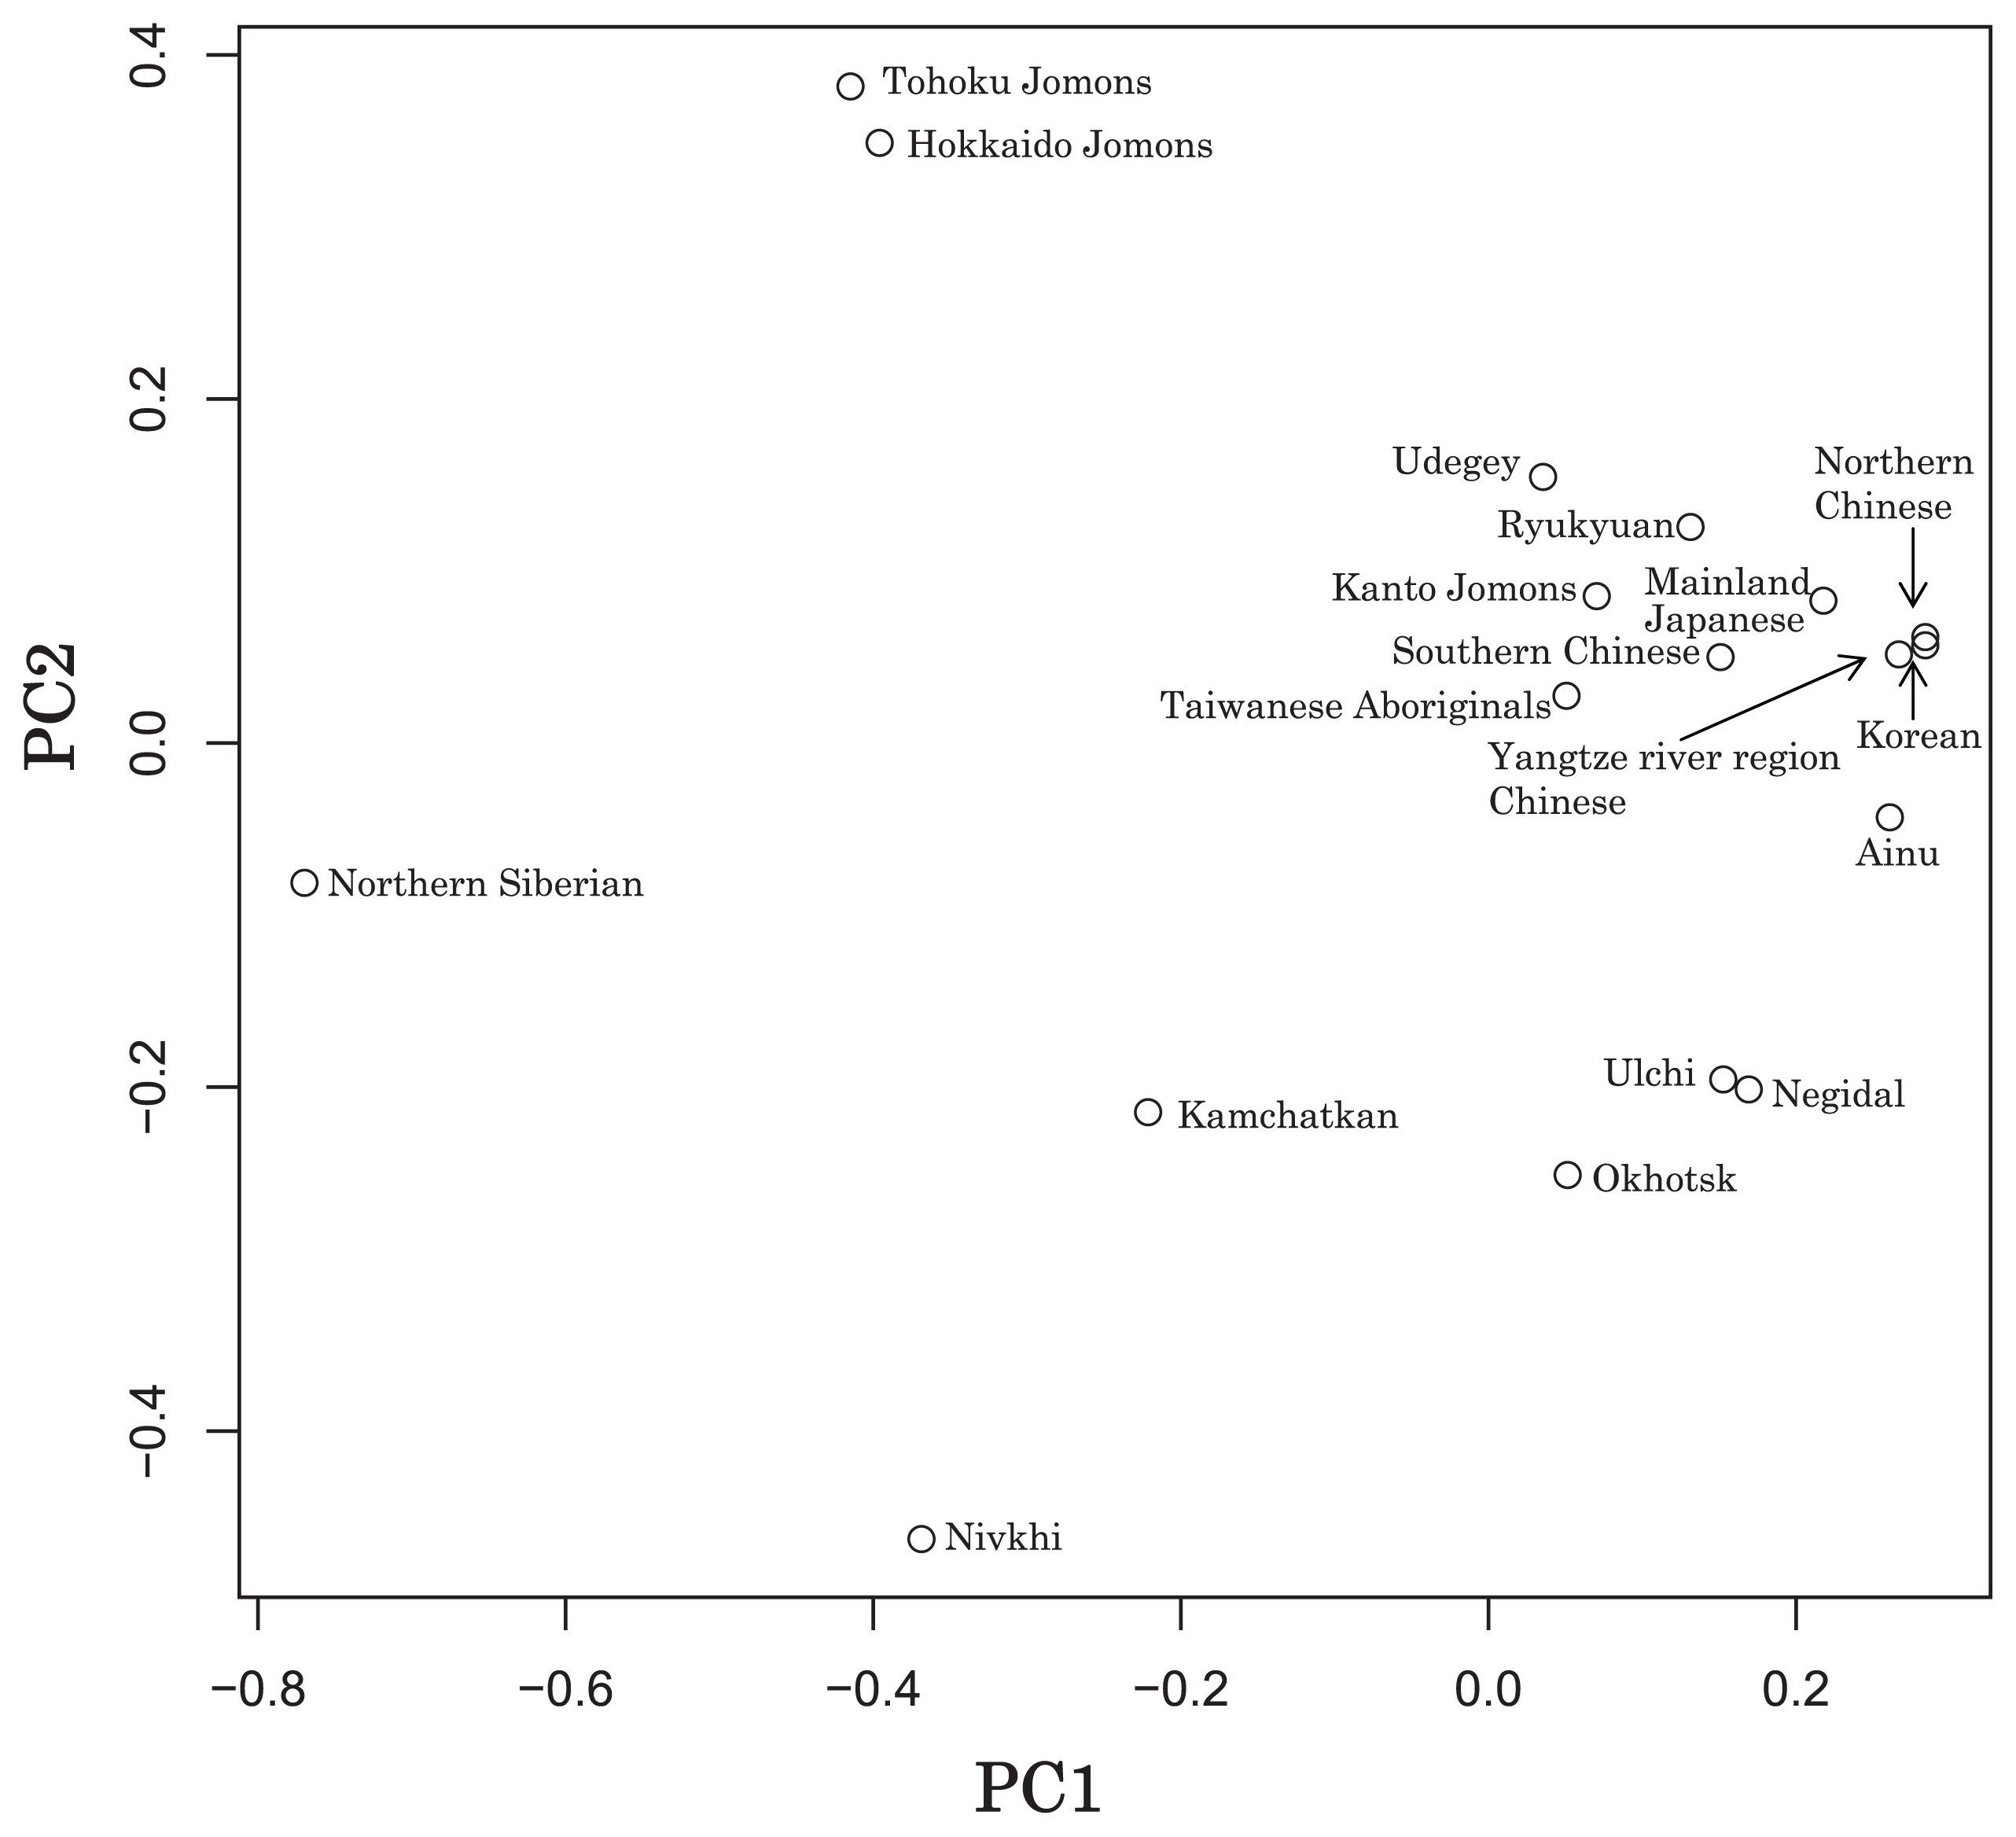
Principle Component Analysis of 18 East Asian populations based on Fst values.
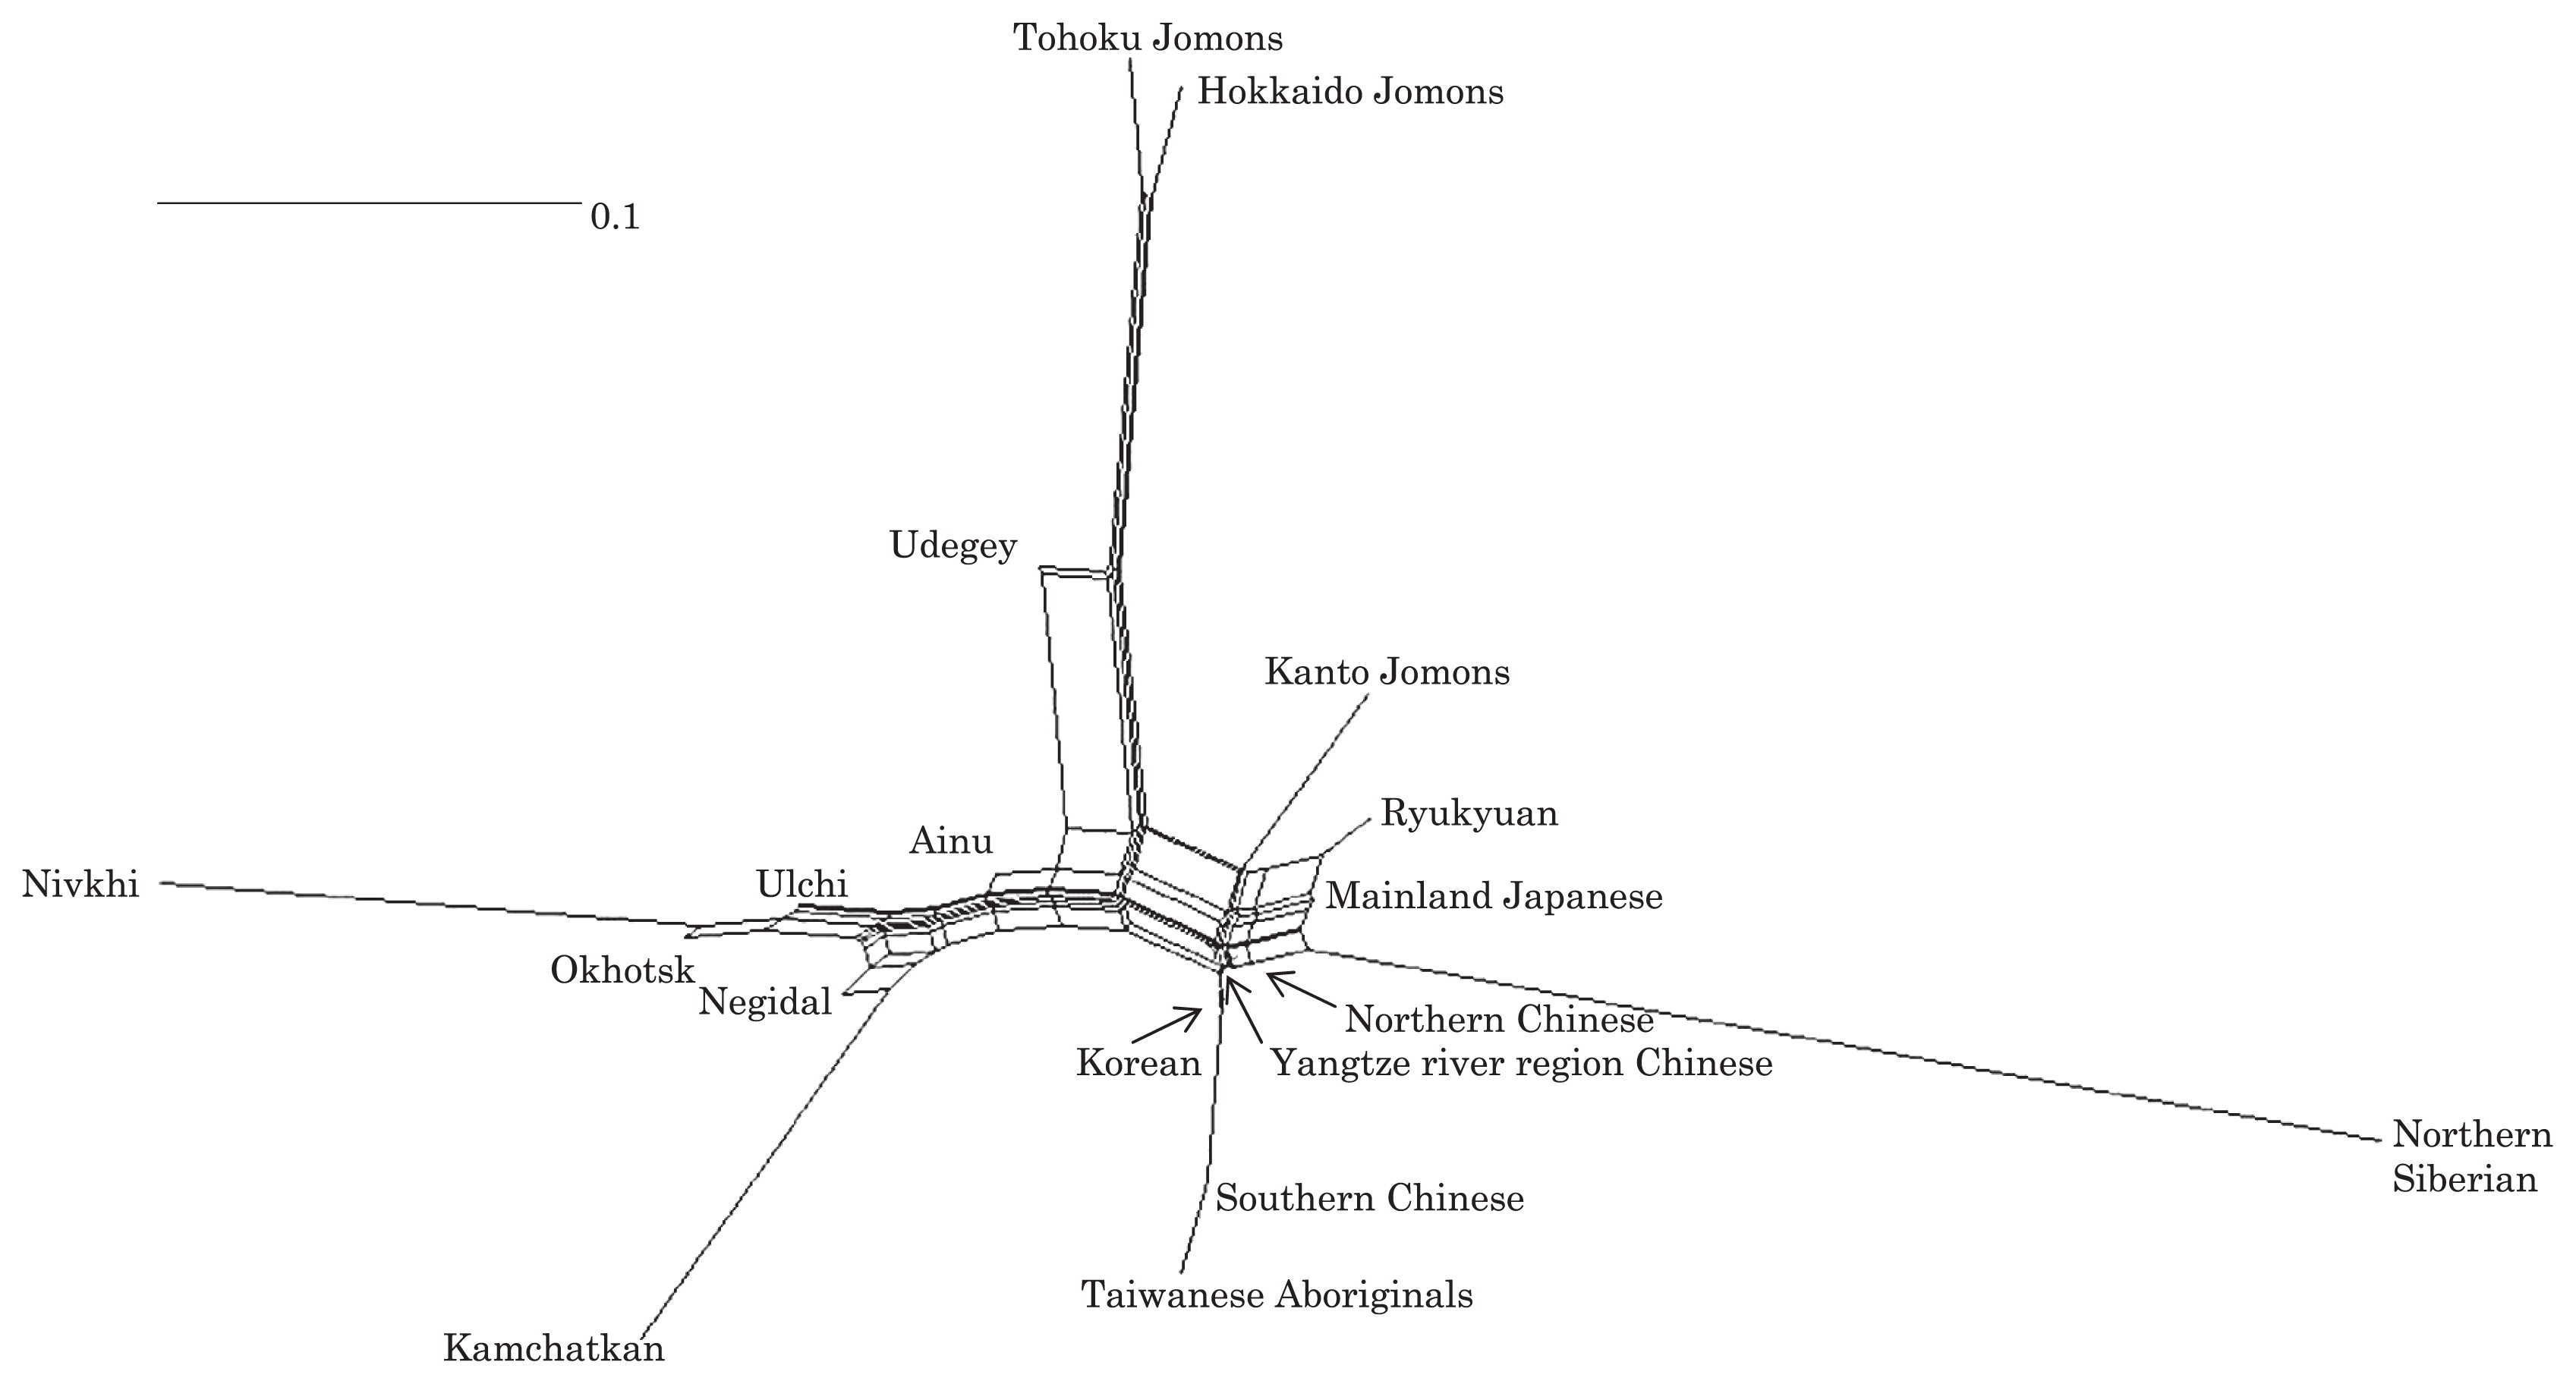
Phylogenetic network of 18 East Asian populations based on Fst values.
Adachi et al. (2009a) mentioned that three regional Jomon populations shared some haplogroups (M7a and N9b), and that genetic similarity decreased gradually with increased geographical distance. However, since sub-haplogroups M7a2 and N9b2 have so far not been shown to be shared between the Tohoku and Kanto Jomon people, it may be that, in terms of the maternal lineage, the gene flow between the geographically close Tohoku and Kanto regions was limited in the Jomon period. In addition, in the population comparison analysis, although we found genetic similarity between the Hokkaido and Tohoku Jomon, so far they lack shared haplogroups at the sub-haplogroup level (M7a*, D4h2, and G1b of the Hokkaido Jomon were not seen in the Tohoku Jomon, and N9b2 and D4b of the Tohoku Jomon were not seen in the Hokkaido Jomon). Again, this may be indicating comparatively limited gene flow in the Jomon period. This interpretation is consistent with the results of the population differentiation test, and the observation of inter-regional heterogeneity among the ancient Japanese archipelago populations. However, the above interpretations need to be confirmed and refined by larger samples of sub-haplogroup determinations and better temporal control of the Jomon materials.
Compared to modern East Asian populations, the Tohoku and Hokkaido Jomon people were genetically close to the Udegey of southern Siberia (Udegey and Tohoku Jomon, Fst = 0.088, P = 0.01; Udegey and Hokkaido Jomon, Fst = 0.138, P = 0.00) (Appendix 2). The Udegey is also geographically closer to the Jomon populations than are the other southern Siberian populations (Figure 2). In the phylogenetic network shown in Figure 4, based on shared mtDNA haplogroups M7a and N9b (Appendix 1), it seems possible that the Udegey represents admixture of southern Siberian populations and the northern (Hokkaido and Tohoku) Jomon people. This implies some degree of gene flow between the Udegey people ancestors and the northern Jomon. Moreover, as we mentioned earlier, haplogroups N9b and M7a2 are hardly observed in the other East Asian populations except in the Japanese archipelago (Table 6, Table 7). One interpretation would be that a northern population with haplogroups N9b and M7a2 migrated into the Tohoku region via Hokkaido, although a southern origin has been considered for the M7a haplotype (see above for discussion of the southern haplogroup hypothesis). This would be compatible with the conclusion of previous studies that the Jomon people were (largely) of northern origin (Nei, 1995; Omoto and Saitou, 1997; Hanihara and Ishida, 2009; Nakashima et al., 2010; Adachi et al., 2011).
The Sanganji results and related analyses presented above suggest that the history of the Jomon people is more complex than previously considered (see also Adachi et al., 2011). Our knowledge of Tohoku and Kanto Jomon sub-haplogroup representations is still limited, and we do not know the genetic background of the Jomon people from west of the Kanto region or the Sea of Japan coastal areas. Therefore, further data accumulation, not only mitochondrial DNA but also nuclear DNA (Sato et al., 2010; Kazuta et al., 2011), and ancient DNA analysis based on larger samples with both adequate temporal control and more extensive geographical regions are necessary to clarify an apparently complex Jomon population history.
Moreover, since next-generation sequencing technology makes it possible to analyze tiny amounts of ancient DNA (e.g. Green et al., 2010), it is quickly becoming practicable to analyze not only Jomon mtDNA, but also nuclear DNA, which contains much more genetic information. Since the success rate of mtDNA haplotyping of four Sanganji Jomon samples was 100%, skeletal remains materials from sites such as Sanganji may also contain nuclear DNA. With this prospect of an expanded range of materials suitable for ancient nuclear DNA analysis with the emergence of next-generation sequencing, further studies on the Tohoku and other Jomon materials may enable a better resolution to the issues discussed herein.
We (H.K.-K. and N.S.) initially suspected that the DNA analysis of materials such as those of the Sanganji Jomon would be difficult because of their prolonged storage in museums. However, albeit with a small sample size of four, the success rate of mtDNA haplogroup detection increased to 100% when focusing on short DNA regions.
Our observation of genetic similarity between the Tohoku Jomon and some of the indigenous southern Siberian peoples is compatible with previous interpretations that the Jomon people originated in Northeast Asia. However, statistical analysis of Jomon populations suggests: (1) the existence of inter-regional heterogeneity within the Jomon people; (2) genetic similarity among the two northern Jomon populations (Tohoku and Hokkaido) much more so than with the Kanto Jomon, implying comparatively limited gene flow between the Kanto and more northern regions; and (3) despite their relative closeness, the presence of sub-haplotype differences between the two northern Jomon populations. The emerging implication seems that the history of the Jomon people may have been more complex than previously considered.
In the modern Japanese, mtDNA haplogroups N9b and M7a2, common in the Sanganji and Hokkaido Jomons, are uncommon. Therefore, it seems that the genetic influence of the northern Jomon populations to the modern mainland Japanese is limited in the maternal linage. However, the samples analyzed in the present study are limited, and current and previous reports are confined mostly to Jomon skeletal materials of the east coast of the Tohoku region. In order to clarify the characteristics of the Tohoku Jomon as well as their genetic influence on modern populations, larger and geographically wider-based samples need to be investigated.
We would like to thank Dr. Shintaroh Ueda, Department of Biological Sciences, The University of Tokyo, Dr. Ryuichi Masuda, Department of Biological Sciences, Hokkaido University, and Dr. Kenta Sumiyama, National Institute of Genetics, for their suggestions about our experiments. We are also grateful to Drs. Tomoya Baba, Katsuhiko Yanagihara, and Yasuo Shirakibara of the National Institute of Genetics, for kindly providing us access to their experimental rooms.