Material Report
Metric traits of the crania and limb bones of medieval human skeletons from Kamakura City, Japan
2015 Volume 123 Issue 1 Pages 41-55

Details
2015 Volume 123 Issue 1 Pages 41-55
The aims of this study are to examine the human skeletal remains from the Yuigahama-chusei-shudan-bochi (seika-ichiba) site, or YCSB-SI, to provide data regarding the metrics of the crania and limb bones, to compare these metrics with those of ancient Japanese skeletons, and to discuss the population variability of the medieval Japanese. The results provided several findings regarding the cranial and limb-bone traits of the YCSB-SI sample: (1) the YCSB-SI remains shared dolichocephaly with the remains from the other medieval series, but the YCSB-SI remains had the highest faces of all the medieval series; (2) there is a distinction between the YCSB-SI remains and the Jomon remains in that the former had a larger length–breadth index of the crania, higher Virchow’s facial and upper facial indices, smaller maximum length of the ulnae and tibiae, and a smaller mid-shaft index of the femora than the latter; and (3) the estimated stature from Fujii’s equations using the maximum length of the femur for YCSB-SI males and females was 158.7 and 146.3 cm, respectively, which is nearly equal to that of other medieval series but several centimeters shorter than that of the Kofun series.
The medieval period of Japan spans nearly 400 years from 1185 AD to 1573 AD and is subdivided into the Kamakura (1185–1333 AD) and Muromachi (1338–1573 AD) periods. The medieval period is characterized by the rise of the warrior class to political power and the formation of military governments. Medieval Kamakura was an ancient capital where a military government, the Kamakura Shogunate, was established.
The first systematic study of medieval Japanese human skeletons was conducted by Suzuki (1956) on 910 individuals from a burial site at Zaimokuza in Kamakura City. Even though the medieval Kamakura people are the most likely ancestors of the modern Kanto Japanese from the perspectives of metric and nonmetric traits of crania and teeth (Suzuki, 1956; Dodo and Ishida, 1990, 1992; Matsumura, 1994), many of their skull measurements have been found to be outside the range of the local modern Kanto Japanese (Suzuki, 1956). The characteristics of the medieval Kamakura people, such as dolichocephaly, chameprosopy, and prognathism, have been explained by environmental factors, including dietary conditions and the effects of medical care (Suzuki, 1956).
In recent decades thousands of medieval human skeletons have been excavated from the archaeological sites of Gokurakuji (Suzuki, 1998), Seiyokan (Morimoto et al., 1984), Yuigahama-minami (Hirata et al., 2002; Matsushita, 2002), and Yuigahama-chusei-shudan-bochi (No. 372) (Hirata and Nagaoka, 2005) in Kamakura City and have been studied from the perspectives of bioarchaeology and morphology (e.g. Nagaoka et al., 2006, 2008). A survey of the Yuigahama-chusei-shudan-bochi (seika-ichiba) site, or YCSB-SI, in Kamakura City was further undertaken by the Kamakura Board of Education and the medieval human skeletal remains were excavated. Nagaoka et al. (2013) conducted paleodemographic and paleopathological analyses of the human skeletal remains from YCSB-SI and suggested the following findings: (1) the sample comprises at least 51 individuals; (2) the frequency of caries lesions was 5%, which is the lowest caries prevalence rate among Japanese populations; and (3) the presence of weapon-related trauma on the cranium and limb bones was demonstrated.
The aims of this study are to examine the human skeletal remains from the YCSB-SI site, to provide data of the metrics regarding their crania and limb bones, to compare these metrics with those of ancient Japanese skeletons, and to discuss the population variability of the medieval Japanese.
The materials used here were adult individuals from the YCSB-SI grave site on the Yuigahama seashore of the southern end of Kamakura City (Figure 1). They are housed in the Department of Anatomy, St Marianna University School of Medicine (Kawasaki, Japan). Ohkouchi (1986) published a brief report on the YCSB-SI site and considered that the human skeletons dated back to the 14th and 15th centuries AD, or the Muromachi period in the pottery sequence. Most of the human skeletons were found in articulated positions with entire-body skeletons and were not mixed with the remains of other individuals (Nagaoka et al., 2013). The medieval human remains from Kamakura City have usually been excavated from multiple burial sites and determining the age and sex of each isolated bone has been difficult because of the lack of an associated pelvis and cranium. Individually buried human skeletons such as those found at the YCSB-SI site have been rarely found in the other Kamakura medieval sites, and hence this study provides important data regarding both cranial and limb-bone measurements.
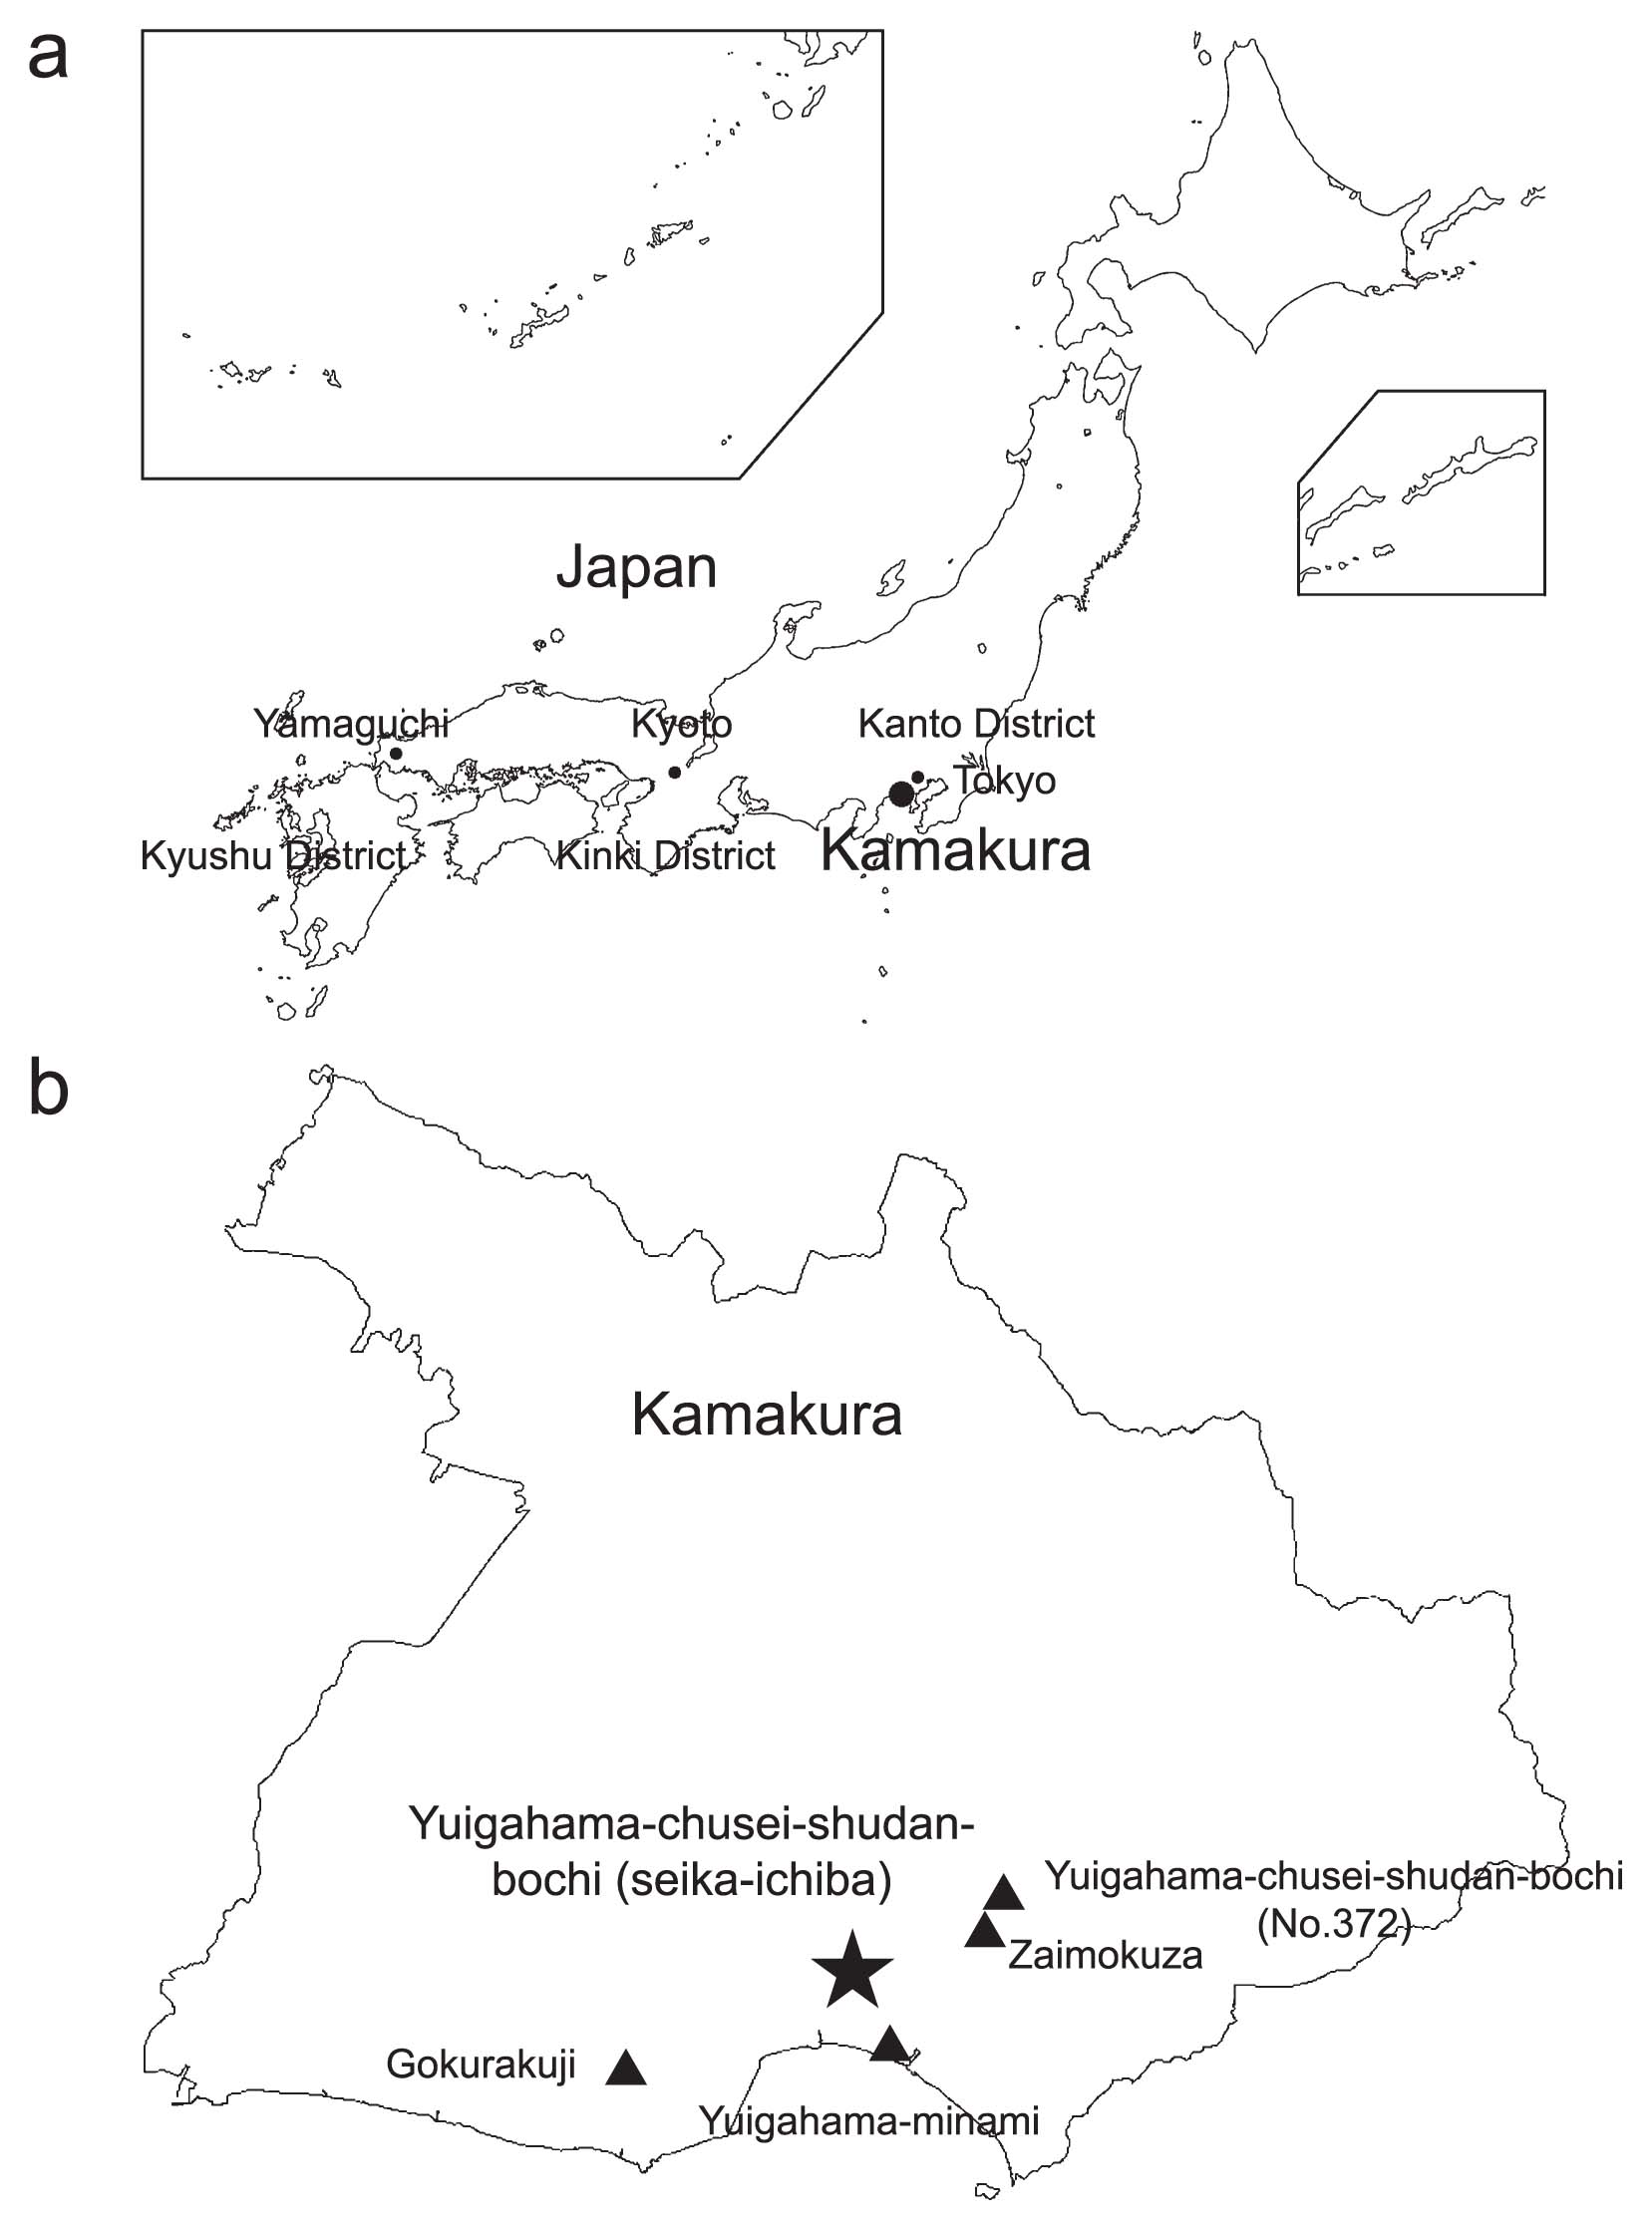
Map of Japan (a) and Kamakura City (b) showing the location of Yuigahama-chusei-shudan-bochi (seika-ichiba) and other medieval sites.
Comparative samples are the human skeletons from the Kanto District whose data are cited from the literature in Table 1. The Yuigahama-minami site included both individual and multiple burials, which are respectively referred to by Hirata et al. (2002) and Matsushita (2002). The chronological ages referred to in this study are the Jomon (14500–300 BC), Yayoi (300 BC–300 AD), Kofun (500–800 AD), medieval (1185–1573 AD), and early modern Edo (1603–1867 AD) periods. The medieval sites of Yuigahama-minami, Yuigahama-chusei-shudan-bochi (No. 372), Gokurakuji, and Zaimokuza belonged to an earlier age than the YCSB-SI and Muromachi samples (Table 1). The populations of Jomon, Kofun, Muromachi, and Fukagawa were composed of multiple archaeological sites.
| Population | Locality | Period | Approximate chronological age | Data source | Remarks |
|---|---|---|---|---|---|
| Medieval series | |||||
| Yuigahama-chusei-shudan-bochi (seika-ichiba) | Kamakura | Muromachi | 14–15th centuries AD | This study | |
| Yuigahama-minami (individual graves) | Kamakura | Kamakura | 13–14th centuries AD | Nagaoka et al. (2006, 2008) and this study | |
| Yuigahama-minami (multiple graves) | Kamakura | Kamakura | 13–14th centuries AD | Matsushita (2002) | |
| Yuigahama-chusei-shudan-bochi (No. 372) | Kamakura | Kamakura | 13–14th centuries AD | Nagaoka et al. (2006) | |
| Gokurakuji | Kamakura | Kamakura | 13–14th centuries AD | Nagaoka et al. (2006) | |
| Zaimokuza | Kamakura | Kamakura | 1333 AD | Kohara (1956), Suzuki (1956), and Hiramoto (1972) | |
| Muromachi | Tokyo | Muromachi | 15–16th centuries AD | Suzuki (1969) and Hiramoto (1972) | The Muromachi series is possibly composed of individuals from Kajibashi and Marunouchi sites in Tokyo. |
| Non-medieval series | |||||
| Jomon | Kanto | Jomon | 145001–300 BC | Suzuki (1969), Hiramoto (1972), and Kondo (1993a, b) | The materials were collected from sites in Kanto. The metric data of female crania were derived from the Ubayama shell-mounds in Chiba. |
| Kofun | Kanto | Kofun | 5–8th centuries AD | Suzuki (1969), Hiramoto (1972), and Yamaguchi (1986, 1987) | The materials were collected from sites in Kanto. |
| Hitotsubashi | Tokyo | Edo | 1657–1683 AD | Morimoto et al. (1985), Nagaoka et al. (2012), and this study | |
| Fukagawa | Tokyo | Edo | 17–19th centuries AD | Suzuki (1969) and Hiramoto (1972) | The Fukagawa series is composed of individuals from Joshinji and Unkoin temples in Tokyo. |
The determination of the sex of adult individuals was carried out based on macroscopic assessment of the pelvic and cranial characteristics (Phenice, 1969; Bruzek, 2002; Walker, 2008). Estimation of the age-at-death for adult individuals was based on the chronological metamorphosis of the pubic symphysis (Todd, 1920, 1921; Brooks and Suchey, 1990; Sakaue, 2006), and the chronological metamorphosis of the auricular surface of the ilium (Lovejoy et al., 1985; Buckberry and Chamberlain, 2002).
The measurement parameters of the cranium, humerus, radius, ulna, femur, and tibia used in this study were defined by Braüer (1988) except those of the upper facial height and transverse mid-shaft diameter of the tibia, which were respectively defined by Howells (1973) and Vallois (1938). The measurements of the YCSB-SI series were obtained by the first author (T.N.) alone and those of the Yuigahama-minami and Hitotsubashi series were obtained in part by T.N., Y.M., and N.N.
Principal-component analysis was conducted for six viscerocranial measurements (middle facial breadth, facial height, upper facial height, orbital breadth, orbital height, nasal breadth, and nasal height) based on the correlation matrix estimated from all the samples in order to transform a number of variables into smaller and uncorrelated principal components. The materials in the principal-component analysis were raw data of the 65 Kamakura-period individuals and 30 Muromachi-period individuals which had been used in part by Nagaoka et al. (2006). The Kamakura-period individuals were derived from the sites of Yuigahama-minami (individual burials) (Nagaoka et al., 2006), Yuigahama-chusei-shudan-bochi (Nagaoka et al., 2006), and Gokurakuji (Nagaoka et al., 2006), and the Muromachi-period individuals were derived from the sites of YCSB-SI (this study), Kajibashi (Nagaoka et al., 2006), and Marunouchi (Nagaoka et al., 2006). Both the Kajibashi and Marunouchi sites were located in Tokyo and dated back to the 15–16th centuries AD (Nagaoka et al., 2006).
The stature was estimated based on the equations of Fujii (1960) and Saso and Hanihara (1998) using the maximum length of the humerus, radius, femur, and tibia. Fujii’s equations for males and those of Fujii and Saso–Hanihara for females are the most suitable for estimating the stature of the medieval people (Nagaoka et al., 2008).
Basic statistics and principal component analysis were calculated using the statistical package, R.3.1.2. (R Core Team, 2014) and SPSS 22.0 J. (IBM Corp., Chicago, IL, USA, 2013).
Figure 2 shows a scatter plot of the maximum length and breadth of the crania. A larger maximum length, smaller maximum breadth, and smaller length–breadth index of the crania were observed in the YCSB-SI and other medieval series compared to the non-medieval series of Jomon, Kofun, and Hitotubashi (Figure 3, Table 2).

Maximum cranial length and maximum cranial breadth.

Length–breadth index (maximum cranial breadth/maximum cranial length × 100). Asterisks indicate significant difference from Yuigahama-chusei-shudan-bochi (seika-ichiba) on the basis of Student’s t-test (*P < 0.05).
| Population | No. 1 Maximum cranial length |
No. 8 Maximum cranial breadth |
No. 8/No. 1 Length-breadth index |
No. 17 Basion–bregma height |
No. 17/No. 1 Length–height index |
No. 17/No. 8 Breadth–height index | |
|---|---|---|---|---|---|---|---|
| Male | |||||||
| Yuigahama-chusei-shudan-bochi (seika-ichiba) (This study) | N | 11 | 9 | 9 | 2 | 2 | 2 |
| M | 187.2 | 138.8 | 74.6 | 139.0 | 75.5 | 99.4 | |
| SD | 8.3 | 4.8 | 4.0 | ||||
| Yuigahama-minami (individual graves) (Nagaoka et al., 2006) | N | 30 | 29 | 29 | 25 | 24 | 23 |
| M | 186.7 | 139.8 | 74.9 | 138.9 | 74.5 | 99.2 | |
| SD | 5.3 | 4.0 | 2.9 | 5.0 | 2.7 | 4.8 | |
| t-test | ns | ns | ns | ||||
| Yuigahama-minami (multiple graves) (Matsushita, 2002) | N | 79 | 85 | 79 | 61 | 58 | 61 |
| M | 184.4 | 138.3 | 75.1 | 138.1 | 74.6 | 99.8 | |
| SD | 6.3 | 5.1 | 3.1 | 6.4 | 3.0 | 4.6 | |
| t-test | ns | ns | ns | ||||
| Yuigahama-chusei-shudan-bochi (No.372) (Nagaoka et al., 2006) | N | 25 | 24 | 24 | 14 | 14 | 14 |
| M | 184.8 | 138.5 | 75.2 | 138.4 | 75.0 | 99.6 | |
| SD | 7.1 | 3.4 | 3.2 | 5.6 | 2.2 | 4.1 | |
| t-test | ns | ns | ns | ||||
| Zaimokuza (Suzuki, 1956) | N | 170 | 164 | 164 | 96 | 94 | 93 |
| M | 184.2 | 136.5 | 74.2 | 137.2 | 74.5 | 100.5 | |
| SD | 7.7 | 5.6 | 4.1 | 6.0 | 3.2 | 5.3 | |
| t-test | ns | ns | ns | ||||
| Gokurakuji (Nagaoka et al., 2006) | N | 29 | 26 | 25 | 2 | 2 | 2 |
| M | 187.8 | 139.3 | 74.4 | 131.0 | 72.0 | 96.7 | |
| SD | 6.0 | 5.7 | 2.9 | ||||
| t-test | ns | ns | ns | ||||
| Muromachi (Suzuki, 1969) | N | 67 | 66 | 61 | 49 | 48 | 49 |
| M | 183.6 | 138.7 | 75.9 | 136.6 | 74.7 | 97.9 | |
| SD | 5.1 | 4.7 | 3.3 | 5.4 | 2.9 | 4.1 | |
| t-test | ns | ns | ns | ||||
| Jomon (Suzuki, 1969) | N | 82 | 82 | 82 | 33 | 33 | 33 |
| M | 181.9 | 144.1 | 79.2 | 138.5 | 75.6 | 95.4 | |
| SD | 6.5 | 3.4 | 4.7 | 4.9 | 2.6 | 5.3 | |
| t-test | * | ** | ** | ||||
| Kofun (Suzuki, 1969) | N | 51 | 53 | 51 | 26 | 25 | 25 |
| M | 182.4 | 140.1 | 76.7 | 137.4 | 75.3 | 99 | |
| SD | 5.9 | 5.8 | 3.8 | 4.1 | 2.8 | 4.1 | |
| t-test | * | ns | ns | ||||
| Hitotsubashi (Nagaoka et al., 2012) | N | 52 | 52 | 52 | 50 | 50 | 50 |
| M | 182.9 | 138.2 | 75.6 | 137.6 | 75.2 | 99.5 | |
| SD | 6.5 | 5.4 | 3.5 | 4.9 | 2.9 | 4.2 | |
| t-test | ns | ns | ns | ||||
| Fukagawa (Suzuki, 1969) | N | 165 | 161 | 160 | 140 | 139 | 138 |
| M | 181.9 | 139.8 | 76.9 | 137.5 | 75.6 | 98.6 | |
| SD | 6.6 | 4.8 | 3.7 | 4.9 | 3.7 | 3.9 | |
| t-test | * | ns | ns | ||||
| Female | |||||||
| Yuigahama-chusei-shudan-bochi (seika-ichiba) (This study) | N | 6 | 7 | 6 | 2 | 1 | 2 |
| M | 182.3 | 134.4 | 74.3 | 122.5 | 71.1 | 92.5 | |
| SD | 8.2 | 4.8 | 4.2 | ||||
| Yuigahama-minami (multiple graves) (Matsushita, 2002) | N | 47 | 48 | 45 | 36 | 35 | 35 |
| M | 179.0 | 134.8 | 75.5 | 133.7 | 74.7 | 98.9 | |
| SD | 6.3 | 4.8 | 3.2 | 5.3 | 2.5 | 4.3 | |
| t-test | ns | ns | ns | ||||
| Zaimokuza (Suzuki, 1956) | N | 62 | 60 | 57 | 42 | 40 | 40 |
| M | 177.9 | 131.8 | 74.2 | 128.8 | 73.4 | 97.6 | |
| SD | 7.9 | 5.5 | 4.3 | 6.8 | 4.5 | 7.4 | |
| t-test | ns | ns | ns | ||||
| Jomon (Kondo, 1993b) | N | 23 | 24 | 22 | 8 | 7 | 8 |
| M | 176.5 | 139.4 | 79.2 | 135.0 | 76.7 | 96.4 | |
| SD | 6.1 | 4.9 | 3.9 | 4.6 | 1.6 | 3.0 | |
| t-test | ns | * | ** | ||||
| Kofun (Yamaguchi, 1987) | N | 27 | 21 | 15 | 26 | 20 | 15 |
| M | 174.9 | 138.3 | 78.8 | 131.3 | 74.9 | 95.6 | |
| SD | 4.9 | 5.1 | 4.1 | 3.5 | 2.7 | 5.1 | |
| t-test | ** | ns | * | ||||
| Hitotsubashi (Morimoto et al. 1985 and this study) | N | 22 | 22 | 22 | 20 | 20 | 20 |
| M | 175.4 | 136.8 | 78.1 | 131.2 | 74.9 | 96.1 | |
| SD | 5.0 | 4.8 | 3.6 | 4.1 | 3.0 | 2.7 | |
| t-test | * | ns | * | ||||
N: number of individuals; M: mean; SD: standard deviation; ns: not significant;
There was an interpopulation difference in the viscerocranial measurements in the medieval series. The upper facial height and facial height were larger in the YCSB-SI series than in the Zaimokuza series (Figure 4, Table 3). Furthermore, a larger upper facial height, larger Virchow’s upper facial index, larger nasal height, and smaller nasal breadth were observed in the YCSB-SI series compared to the Jomon series (Figure 4, Table 3).

Upper facial height. Asterisks indicate significant difference from Yuigahama-chusei-shudan-bochi (seika-ichiba), on the basis of Student’s t-test (*P < 0.05; **P < 0.01).
| Population | No. 45 Zygomatic breadth |
No. 46 Middle facial breadth |
No. 47 Facial height |
No. 48 Upper facial height |
No. 47/No. 45 Kollmann’s facial index |
No. 47/ No. 46 Virchow’s facial index |
No. 48/ No. 45 Kollmann’s upper facial index |
No. 48/ No. 46 Virchow’s upper facial index |
No. 51 Orbital breadth |
No. 52 Orbital height |
No. 52/ No. 51 Orbital index |
No. 54 Nasal breadth |
No. 55 Nasal height |
No. 54/ No. 55 Nasal index |
72. Total profile angle | 73. Nasal profile angle | 74. Alveolar profile angle | |
|---|---|---|---|---|---|---|---|---|---|---|---|---|---|---|---|---|---|---|
| Male | ||||||||||||||||||
| Yuigahama-chusei-shudan-bochi (seika-ichiba) (This study) | N | 1 | 4 | 5 | 6 | 1 | 4 | 1 | 4 | 5 | 6 | 5 | 4 | 6 | 4 | 1 | 1 | 1 |
| M | 148.7 | 102.5 | 122.0 | 71.3 | 86.1 | 118.0 | 47.9 | 67.9 | 41.8 | 34.4 | 80.4 | 25.1 | 52.1 | 48.4 | 81.3 | 85.0 | 63.5 | |
| SD | 5.0 | 7.2 | 4.8 | 9.4 | 6.0 | 2.3 | 3.3 | 7.6 | 1.9 | 5.3 | 5.0 | |||||||
| Yuigahama-minami (individual graves) (Nagaoka et al., 2006) | N | 14 | 20 | 22 | 20 | 11 | 18 | 10 | 16 | 22 | 24 | 21 | 25 | 23 | 20 | 18 | 18 | 18 |
| M | 135.4 | 102.9 | 118.3 | 68.2 | 88.0 | 114.8 | 50.7 | 66.5 | 43.6 | 33.8 | 76.5 | 26.5 | 51.5 | 50.7 | 82.1 | 90.3 | 62.2 | |
| SD | 4.6 | 5.4 | 4.4 | 3.7 | 4.1 | 7.1 | 2.7 | 3.6 | 1.5 | 1.7 | 4.2 | 1.9 | 3.3 | 4.6 | 4.2 | 4.3 | 6.1 | |
| t-test | ns | ns | ns | ns | ns | * | ns | ns | ns | ns | ns | |||||||
| Yuigahama-minami (multiple graves) (Matsushita, 2002) | N | 35 | 53 | 31 | 53 | 17 | 24 | 29 | 42 | 57 | 58 | 62 | 52 | 58 | 50 | 51 | 54 | 51 |
| M | 137.7 | 104.2 | 118.0 | 67.3 | 85.5 | 112.1 | 48.5 | 64.1 | 43.4 | 33.3 | 77.3 | 26.1 | 52.1 | 50.9 | 83.6 | 86.2 | 74.6 | |
| SD | 4.9 | 5.6 | 5.8 | 3.8 | 2.8 | 7.2 | 2.9 | 4.0 | 1.9 | 2.1 | 4.2 | 2.0 | 3.6 | 5.4 | 3.8 | 3.8 | 7.5 | |
| t-test | ns | ns | * | ns | ns | ns | ns | ns | ns | ns | ns | |||||||
| Yuigahama-chusei-shudan-bochi (No. 372) (Nagaoka et al., 2006) | N | 5 | 15 | 17 | 4 | 12 | 20 | 21 | 19 | 21 | 20 | 19 | 12 | 12 | 12 | |||
| M | 135.7 | 101.9 | 67.9 | 50.8 | 66.7 | 43.7 | 34.1 | 78.1 | 26.4 | 52.6 | 50.9 | 83.8 | 92.1 | 61.8 | ||||
| SD | 5.1 | 4.9 | 3.5 | 3.4 | 4.4 | 2.4 | 2.1 | 5.9 | 1.6 | 3.3 | 4.5 | 5.0 | 5.7 | 6.8 | ||||
| t-test | ns | ns | ns | ns | ns | ns | ns | ns | ns | |||||||||
| Zaimokuza (Suzuki, 1956) | N | 96 | 107 | 48 | 119 | 37 | 43 | 87 | 97 | 111 | 99 | 96 | 122 | 121 | 113 | 73 | 79 | 68 |
| M | 134.8 | 101.8 | 115.8 | 64.7 | 85.9 | 113.8 | 48.0 | 63.6 | 43.1 | 33.7 | 78.2 | 26.6 | 51.1 | 52.1 | 81.7 | 88.6 | 60.3 | |
| SD | 6.5 | 5.1 | 6.4 | 4.4 | 4.9 | 7.6 | 3.7 | 5.4 | 2.2 | 2.3 | 4.7 | 2.2 | 3.3 | 4.8 | 4.3 | 4.2 | 7.4 | |
| t-test | ns | * | ** | ns | ns | ns | ns | ns | ns | ns | ns | |||||||
| Gokurakuji (Nagaoka et al., 2006) | N | 3 | 5 | 5 | 1 | 3 | 11 | 9 | 9 | 9 | 9 | 8 | 5 | 5 | 5 | |||
| M | 135.3 | 101.6 | 65.8 | 46.0 | 62.0 | 42.8 | 33.0 | 76.9 | 25.4 | 50.8 | 50.0 | 84.0 | 90.6 | 63.0 | ||||
| SD | 4.6 | 6.0 | 3.4 | 2.0 | 2.8 | 2.1 | 6.3 | 1.8 | 3.1 | 3.5 | 3.4 | 2.9 | 7.1 | |||||
| t-test | ns | ns | ns | ns | ns | ns | ns | ns | ns | |||||||||
| Muromachi (Suzuki, 1969) | N | 38 | 46 | 8 | 44 | 5 | 7 | 34 | 41 | 47 | 46 | 46 | 51 | 48 | 48 | 44 | 43 | 44 |
| M | 136.2 | 101.6 | 118.3 | 68.7 | 87.5 | 115.3 | 50.7 | 67.7 | 43.2 | 34.3 | 79.3 | 26.2 | 51.7 | 51.4 | 82.3 | 89.4 | 62.6 | |
| SD | 4.1 | 4.5 | 7.2 | 4.4 | 5.3 | 7.4 | 3.3 | 4.2 | 1.7 | 2.1 | 4.4 | 2.1 | 3.2 | 4.0 | 3.3 | 3.7 | 4.4 | |
| t-test | ns | ns | ns | ns | ns | ns | ns | ns | ns | ns | ns | |||||||
| Jomon (Suzuki, 1969) | N | 40 | 46 | 35 | 46 | 28 | 33 | 38 | 41 | 36 | 36 | 36 | 47 | 45 | 45 | 17 | 21 | 17 |
| M | 144.6 | 104.8 | 115.5 | 66.0 | 80.2 | 110.2 | 45.4 | 63.2 | 43.2 | 33 | 76.9 | 27.1 | 49.6 | 54.8 | 81.9 | 87.8 | 67 | |
| SD | 5.2 | 4.2 | 6.7 | 4.5 | 5.0 | 7.3 | 3.2 | 4.0 | 1.9 | 2.0 | 5.5 | 1.8 | 3.4 | 5.1 | 5.0 | 4.2 | 8.8 | |
| t-test | ns | ns | ** | ns | * | ns | ns | ns | * | ns | * | |||||||
| Kofun (Suzuki, 1969) | N | 29 | 30 | 17 | 34 | 17 | 16 | 27 | 28 | 30 | 29 | 25 | 37 | 35 | 35 | 16 | 18 | 15 |
| M | 139.0 | 103.0 | 117.5 | 66.8 | 85.1 | 114.8 | 47.8 | 65.1 | 42.5 | 34.0 | 80.2 | 26.9 | 51.5 | 52.7 | 83.3 | 90.0 | 64.4 | |
| SD | 5.9 | 5.0 | 7.2 | 4.3 | 4.4 | 7.3 | 3.3 | 4.5 | 1.7 | 2.0 | 4.1 | 2.1 | 4.1 | 5.3 | 2.6 | 3.2 | 8.0 | |
| t-test | ns | ns | * | ns | ns | ns | ns | ns | ns | ns | ns | |||||||
| Hitotsubashi (Nagaoka et al., 2012) | N | 36 | 45 | 34 | 41 | 24 | 32 | 28 | 37 | 49 | 49 | 49 | 48 | 50 | 48 | |||
| M | 135.1 | 100.7 | 121.1 | 69.3 | 90.6 | 120.8 | 51.6 | 68.8 | 42.8 | 34.0 | 79.6 | 25.5 | 51.7 | 49.6 | ||||
| SD | 4.3 | 4.3 | 5.8 | 3.2 | 5.2 | 7.0 | 2.9 | 3.6 | 1.7 | 1.8 | 4.9 | 1.8 | 2.7 | 4.2 | ||||
| t-test | ns | ns | ns | ns | ns | ns | ns | ns | ns | ns | ns | |||||||
| Fukagawa (Suzuki, 1969) | N | 109 | 107 | 55 | 102 | 54 | 54 | 95 | 92 | 117 | 117 | 117 | 120 | 120 | 119 | 93 | 115 | 92 |
| M | 135.4 | 99.6 | 118 | 69.3 | 88.3 | 116.2 | 51.1 | 69.7 | 43.2 | 34.4 | 79.5 | 26.2 | 52.5 | 49.9 | 82.8 | 89.7 | 63.0 | |
| SD | 4.9 | 4.9 | 7.5 | 3.8 | 5.9 | 9.3 | 3.0 | 5.1 | 1.9 | 1.9 | 4.7 | 2.0 | 2.9 | 4.3 | 3.4 | 3.3 | 6.5 | |
| t-test | ns | ns | ns | ns | ns | ns | ns | ns | ns | ns | ns | |||||||
| Female | ||||||||||||||||||
| Yuigahama-chusei-shudan-bochi (seika-ichiba) (This study) | N | 2 | 2 | 1 | 3 | 1 | 1 | 2 | 2 | 2 | 2 | 2 | 3 | 3 | 2 | 1 | 1 | 1 |
| M | 129.1 | 101.2 | 112.3 | 62.9 | 85.6 | 110.0 | 47.5 | 60.6 | 41.0 | 34.1 | 83.3 | 25.6 | 47.2 | 55.0 | 86.8 | 87.8 | 75.1 | |
| SD | 2.8 | 1.3 | 3.7 | |||||||||||||||
| Yuigahama-minami (multiple grave) (Matsushita, 2002) | N | 20 | 30 | 15 | 24 | 9 | 14 | 16 | 23 | 30 | 30 | 30 | 32 | 29 | 28 | 25 | 27 | 26 |
| M | 129.4 | 99.6 | 109.7 | 63.0 | 84.8 | 110.4 | 49.0 | 63.5 | 41.4 | 32.5 | 77.8 | 25.5 | 48.2 | 53.1 | 81.9 | 86.4 | 65.9 | |
| SD | 3.8 | 4.2 | 6.8 | 4.0 | 5.8 | 6.4 | 3.6 | 4.3 | 2.0 | 1.6 | 5.2 | 1.9 | 3.4 | 5.0 | 3.0 | 3.4 | 7.0 | |
| t-test | ns | ns | ns | |||||||||||||||
| Zaimokuza (Suzuki, 1956) | N | 33 | 32 | 16 | 40 | 15 | 15 | 31 | 29 | 36 | 33 | 33 | 34 | 34 | 32 | 31 | 32 | 30 |
| M | 124.6 | 95.4 | 105.1 | 61.6 | 84.5 | 109.4 | 48.9 | 64.1 | 40.7 | 32.9 | 79.9 | 24.6 | 46.9 | 52.7 | 81.1 | 89.0 | 59.1 | |
| SD | 5.3 | 5.2 | 5.3 | 3.3 | 5.8 | 6.4 | 2.4 | 3.6 | 2.3 | 2.1 | 5.4 | 1.5 | 2.4 | 3.6 | 4.7 | 4.4 | 9.0 | |
| t-test | ns | ns | ns | |||||||||||||||
| Jomon (Kondo, 1993b) | N | 4 | 15 | 15 | 2 | 13 | 15 | 17 | 15 | 14 | 14 | 12 | 10 | 9 | 9 | |||
| M | 140.5 | 96.9 | 62.7 | 45.5 | 65.3 | 42.3 | 32.8 | 78.2 | 25.7 | 47.9 | 53.4 | 71.8 | 71.6 | 62.0 | ||||
| SD | 6.0 | 4.0 | 4.5 | 4.7 | 1.4 | 2.2 | 4.6 | 1.9 | 3.2 | 5.0 | 2.6 | 5.9 | 4.4 | |||||
| t-test | ns | ns | ns | |||||||||||||||
| Kofun (Yamaguchi, 1987) | N | 9 | 8 | 16 | 5 | 7 | 24 | 22 | 22 | 18 | 17 | 16 | ||||||
| M | 131.8 | 97.3 | 66.7 | 52.3 | 69.4 | 41.2 | 33.6 | 81.7 | 26.6 | 48.3 | 55.1 | |||||||
| SD | 5.6 | 4.8 | 3.7 | 3.4 | 3.4 | 1.3 | 1.5 | 3.9 | 1.0 | 2.2 | 3.3 | |||||||
| t-test | ns | ns | ns | |||||||||||||||
| Hitotsubashi (Morimoto et al. 1985 and this study) | N | 13 | 19 | 10 | 14 | 7 | 10 | 9 | 14 | 19 | 19 | 19 | 19 | 18 | 18 | |||
| M | 125.5 | 94.3 | 111.7 | 64.9 | 88.2 | 119.4 | 50.9 | 69.6 | 40.8 | 33.7 | 82.7 | 24.8 | 48.0 | 51.8 | ||||
| SD | 5.3 | 5.4 | 6.5 | 3.9 | 2.8 | 7.1 | 2.1 | 4.6 | 1.8 | 1.9 | 5.1 | 1.5 | 3.2 | 4.6 | ||||
| t-test | ns | ns | ns | |||||||||||||||
N: number of individuals; M: mean; SD: standard deviation; ns: not significant;
The maximum length of the humeri and mid-shaft index of the humeri were smaller in the YCSB-SI burials than in both the individual and multiple burials of Yuigahama-minami (Table 4). The maximum mid-shaft diameter of the humeri and mid-shaft index of the humeri were also smaller in the YCSB-SI series than in the Jomon series (Table 4). The maximum transverse shaft diameters of the radii and the sagittal shaft diameter of the radii and the maximum length of the ulnae were all smaller in the YCSB-SI series than in the Jomon series (Table 4).
| Population | Humerus | Radius | Ulna | ||||||||||
|---|---|---|---|---|---|---|---|---|---|---|---|---|---|
| No. 1 Maximum length |
No. 5 Maximum mid-shaft diameter |
No. 6 Minimum mid-shaft diameter |
No. 6/No. 5 Mid-shaft index |
No. 1 Maximum length |
No. 4 Max. transverse shaft diameter |
No. 5 Sagittal shaft diameter |
No. 5/No. 4 Shaft index |
No. 1 Maximum length |
No. 11 Dorso-ventral shaft diameter |
No. 12 Transverse shaft diameter |
No. 11/No. 12 Shaft index | ||
| Male | |||||||||||||
| Yuigahama-chusei-shudan-bochi (seika-ichiba) (This study) | N | 6 | 6 | 6 | 6 | 7 | 7 | 7 | 7 | 6 | 7 | 7 | 7 |
| M | 293.2 | 21.0 | 17.6 | 84.0 | 224.9 | 15.5 | 11.4 | 73.7 | 241.8 | 13.4 | 16.6 | 80.9 | |
| SD | 17.1 | 1.6 | 1.5 | 3.3 | 12.9 | 1.7 | 1.2 | 7.4 | 13.4 | 1.7 | 1.0 | 8.9 | |
| Yuigahama-minami (individual graves) (This study) | N | 35 | 34 | 34 | 34 | 36 | 42 | 42 | 42 | 34 | 42 | 42 | 42 |
| M | 299.5 | 22.5 | 17.2 | 76.5 | 231.0 | 16.2 | 12.3 | 76.9 | 248.9 | 13.4 | 16.6 | 81.4 | |
| SD | 12.3 | 1.5 | 1.0 | 6.0 | 12.2 | 1.3 | 1.2 | 10.1 | 13.7 | 0.9 | 1.4 | 7.0 | |
| t-test | ns | * | ns | ** | ns | ns | ns | ns | ns | ns | ns | ns | |
| Yuigahama-minami (multiple graves) (Matsushita, 2002) | N | 19 | 41 | 41 | 41 | 6 | 29 | 29 | 29 | 3 | 29 | 29 | 29 |
| M | 309.2 | 22.2 | 17.1 | 77.0 | 232.8 | 16.5 | 12.0 | 73.1 | 257.7 | 12.8 | 16.4 | 78.2 | |
| SD | 14.6 | 1.7 | 1.6 | 5.4 | 11.8 | 1.4 | 1.1 | 7.9 | 0.9 | 1.3 | 6.7 | ||
| t-test | * | ns | ns | ** | ns | ns | ns | ns | ns | ns | ns | ||
| Jomon (Takigawa, 2006) | N | 17 | 56 | 56 | 56 | 25 | 52 | 52 | 52 | 17 | 57 | 57 | 57 |
| M | 292.9 | 24.2 | 17.8 | 73.7 | 233.2 | 16.6 | 12.6 | 76.2 | 254.0 | 14.4 | 16.3 | 88.7 | |
| SD | 16.2 | 1.9 | 1.6 | 5.7 | 9.5 | 1.3 | 1.3 | 7.2 | 8.5 | 1.3 | 1.4 | 10.1 | |
| t-test | ns | ** | ns | ** | ns | * | * | ns | * | ns | ns | ns | |
| Hitotsubashi (Morimoto et al., 1985) | N | 40 | 53 | 56 | |||||||||
| M | 295.7 | 223.5 | 240.7 | ||||||||||
| SD | 11.6 | 10.4 | 11.6 | ||||||||||
| t-test | ns | ns | ns | ||||||||||
| Female | |||||||||||||
| Yuigahama-chusei-shudan-bochi (seika-ichiba) (This study) | N | 4 | 4 | 4 | 4 | 5 | 6 | 6 | 6 | 3 | 5 | 5 | 5 |
| M | 280.3 | 19.4 | 15.2 | 79.1 | 206.8 | 14.1 | 10.2 | 72.5 | 221.7 | 12.1 | 14.4 | 84.6 | |
| SD | 23.1 | 1.9 | 1.2 | 8.0 | 5.4 | 1.3 | 0.5 | 5.8 | 3.5 | 0.6 | 1.4 | 7.6 | |
| Yuigahama-minami (individual graves) (This study) | N | 29 | 29 | 29 | 29 | 32 | 39 | 39 | 39 | 32 | 41 | 41 | 41 |
| M | 278.2 | 20.2 | 15.2 | 75.3 | 209.1 | 15.1 | 10.3 | 68.6 | 227.5 | 11.4 | 14.8 | 77.2 | |
| SD | 12.8 | 1.8 | 1.5 | 5.1 | 11.9 | 1.5 | 0.9 | 4.7 | 10.8 | 1.2 | 1.2 | 7.1 | |
| t-test | ns | ns | ns | ns | ns | ns | ns | ns | ns | ns | ns | * | |
| Yuigahama-minami (multiple graves) (Matsushita, 2002) | N | 3 | 10 | 10 | 10 | 2 | 5 | 5 | 5 | 7 | 7 | 7 | |
| M | 279.3 | 20.4 | 14.8 | 72.9 | 207.5 | 14.4 | 10.6 | 73.4 | 11.1 | 14.6 | 76.4 | ||
| SD | 2.0 | 1.3 | 7.2 | 1.1 | 1.5 | 6.2 | 1.6 | 1.3 | 8.8 | ||||
| t-test | ns | ns | ns | ns | ns | ns | ns | ns | ns | ||||
| Jomon (Takigawa, 2006) | N | 14 | 46 | 46 | 46 | 15 | 47 | 47 | 47 | 13 | 49 | 48 | 48 |
| M | 274.1 | 21.1 | 14.7 | 70.1 | 214.3 | 15.0 | 10.4 | 69.5 | 226.6 | 12.4 | 14.3 | 87.1 | |
| SD | 13.7 | 1.6 | 1.3 | 5.5 | 12.4 | 1.1 | 0.8 | 4.7 | 9.7 | 1.3 | 1.3 | 12.6 | |
| t-test | ns | * | ns | ** | ns | ns | ns | ns | ns | ns | ns | ns | |
| Hitotsubashi (Morimoto et al., 1985) | N | 16 | 17 | 12 | |||||||||
| M | 266.1 | 198.5 | 213.5 | ||||||||||
| SD | 13.4 | 9.6 | 10.2 | ||||||||||
| t-test | ns | ns | ns | ||||||||||
N: number of individuals; M: mean; SD: standard deviation; ns: not significant;
The mid-shaft index of the femora was smaller in the YCSB-SI burials than in the Yuigahama-minami multiple burials (Figure 5, Table 5). The mid-shaft diameter of the femora and the mid-shaft index of the femora were also smaller in the YCSB-SI series than in the Jomon series and the transverse mid-shaft diameter of the femora was smaller in the YCSB-SI series than in the Kofun series (Figure 5, Table 5). The maximum length of the tibiae was smaller in the YCSB-SI series than in the Jomon and Kofun series and the mid-shaft index of the tibiae was larger in the YCSB-SI series than in the Jomon series (Table 5).

Mid-shaft index of femora (sagittal mid-shaft diameter/transverse mid-shaft diameter × 100). Asterisks indicate significant difference from Yuigahama-chusei-shudan-bochi (seika-ichiba), on the basis of Student’s t-test (*P < 0.05; **P < 0.01).
| Population | Femur | Tibia | ||||||||
|---|---|---|---|---|---|---|---|---|---|---|
| No. 1 Maximum length | No. 6 Sagittal mid-shaft diameter | No. 7 Transverse mid-shaft diameter | No. 6/No. 7 Mid-shaft index | No. 1 Total length | No. 1a Maximum length | No. 8 Maximum sagittal mid-shaft diameter | No. 9 Transverse mid-shaft diameter | No. 9/No. 8 Mid-shaft index | ||
| Male | ||||||||||
| Yuigahama-chusei-shudan-bochi (seika-ichiba) (This study) | N | 5 | 8 | 8 | 8 | 5 | 5 | 6 | 6 | 6 |
| M | 420.4 | 27.3 | 26.0 | 105.6 | 323.2 | 328.2 | 29.0 | 22.0 | 76.0 | |
| SD | 27.7 | 3.2 | 2.4 | 14.9 | 5.4 | 3.7 | 2.0 | 3.9 | 13.1 | |
| Yuigahama-minami (individual graves) (This study) | N | 30 | 33 | 33 | 33 | 29 | 29 | 24 | 24 | 24 |
| M | 416.5 | 28.3 | 26.6 | 106.3 | 333.0 | 337.7 | 30.3 | 21.2 | 70.1 | |
| SD | 19.0 | 1.8 | 1.3 | 6.2 | 16.2 | 16.5 | 1.9 | 1.6 | 5.5 | |
| t-test | ns | ns | ns | ns | ns | ns | ns | ns | ns | |
| Yuigahama-minami (multiple graves) (Matsushita, 2002) | N | 27 | 81 | 81 | 81 | 23 | 25 | 73 | 73 | 73 |
| M | 415.9 | 27.3 | 26.3 | 104.5 | 332.0 | 338.5 | 29.3 | 21.1 | 72.1 | |
| SD | 18.3 | 2.1 | 2.2 | 9.8 | 18.1 | 18.0 | 2.0 | 1.6 | 5.6 | |
| t-test | ns | ns | ns | ns | ns | ns | ns | ns | ns | |
| Zaimokuza (Kohara, 1956) | N | 10 | 65 | 65 | 65 | |||||
| M | 417.1 | 27.3 | 26.5 | 104.9 | ||||||
| SD | 26.0 | 2.3 | 1.7 | 7.8 | ||||||
| t-test | ns | ns | ns | ns | ||||||
| Jomon (Takigawa, 2006) | N | 29 | 66 | 66 | 66 | 17 | 61 | 61 | 61 | |
| M | 417.6 | 30.2 | 25.8 | 117.2 | 350.4 | 31.4 | 21.3 | 68.1 | ||
| SD | 19.1 | 2.2 | 1.5 | 8.5 | 17.2 | 21.3 | 1.6 | 5.1 | ||
| t-test | ns | ** | ns | ** | * | ns | ns | ** | ||
| Kofun (Yamaguchi, 1986) | N | 35 | 73 | 73 | 73 | 19 | 55 | 55 | 55 | |
| M | 427.2 | 28.9 | 28.4 | 102.2 | 349.4 | 30.6 | 22.6 | 73.8 | ||
| SD | 21.9 | 2.6 | 2.1 | 2.1 | 21.8 | 2.1 | 1.6 | 5.0 | ||
| t-test | ns | ns | ** | ns | * | ns | ns | ns | ||
| Hitotsubashi (Morimoto et al., 1985) | N | 51 | 85 | 85 | 85 | 42 | 43 | 77 | 77 | 77 |
| M | 405.7 | 26.4 | 26.3 | 100.4 | 325.9 | 329.3 | 28.4 | 20.3 | 71.6 | |
| SD | 18.9 | 2.0 | 2.1 | 10.0 | 15.1 | 15.4 | 2.6 | 1.7 | 5.7 | |
| t-test | ns | ns | ns | ns | ns | ns | ns | * | ns | |
| Female | ||||||||||
| Yuigahama-chusei-shudan-bochi (seika-ichiba) (This study) | N | 3 | 5 | 5 | 5 | 3 | 3 | 3 | 3 | 3 |
| M | 380.3 | 23.6 | 25.2 | 93.9 | 309.3 | 312.0 | 26.7 | 18.1 | 68.1 | |
| SD | 19.6 | 1.9 | 2.3 | 4.1 | 17.8 | 16.6 | 2.1 | 0.9 | 7.8 | |
| Yuigahama-minami (individual graves) (This study) | N | 24 | 32 | 32 | 32 | 29 | 29 | 28 | 27 | 27 |
| M | 382.4 | 23.8 | 24.8 | 96.1 | 304.8 | 309.2 | 25.5 | 18.9 | 74.3 | |
| SD | 17.1 | 2.1 | 2.0 | 7.7 | 16.0 | 16.0 | 2.0 | 1.3 | 5.9 | |
| t-test | ns | ns | ns | ns | ns | ns | ns | ns | ns | |
| Yuigahama-minami (multiple graves) (Matsushita, 2002) | N | 2 | 16 | 16 | 16 | 2 | 2 | 7 | 7 | 7 |
| M | 386.5 | 25.1 | 24.1 | 104.2 | 326.5 | 331.5 | 26.1 | 19.7 | 75.4 | |
| SD | 2.2 | 2.3 | 7.4 | 1.8 | 1.8 | 4.7 | ||||
| t-test | ns | ns | ** | ns | ns | ns | ||||
| Zaimokuza (Kohara, 1956) | N | 3 | 25 | 25 | 25 | |||||
| M | 380.7 | 23.4 | 23.6 | 100.2 | ||||||
| SD | 12.1 | 1.9 | 2.0 | 10.9 | ||||||
| t-test | ns | ns | ns | ns | ||||||
| Jomon (Takigawa, 2006) | N | 12 | 45 | 45 | 45 | 8 | 47 | 47 | 45 | |
| M | 393.6 | 26.7 | 24.2 | 110.4 | 325.6 | 27.8 | 19.5 | 69.0 | ||
| SD | 18.5 | 2.0 | 1.5 | 7.5 | 17.0 | 1.7 | 2.0 | 12.6 | ||
| t-test | ns | * | ns | ** | ns | * | ns | ns | ||
| Kofun (Yamaguchi, 1986) | N | 15 | 33 | 33 | 33 | 8 | 29 | 29 | 29 | |
| M | 396.1 | 24.4 | 26.7 | 91.9 | 322.4 | 26.9 | 20.0 | 74.7 | ||
| SD | 14.4 | 1.6 | 1.6 | 6.5 | 10.4 | 1.4 | 1.3 | 5.0 | ||
| t-test | ns | ns | ns | ns | ns | ns | * | * | ||
| Hitotsubashi (Morimoto et al., 1985) | N | 17 | 38 | 38 | 38 | 14 | 15 | 29 | 29 | 29 |
| M | 366.0 | 22.1 | 22.9 | 96.3 | 295.4 | 300.1 | 23.7 | 16.7 | 70.9 | |
| SD | 17.1 | 1.8 | 2.3 | 9.2 | 13.4 | 13.0 | 2.4 | 1.6 | 6.2 | |
| t-test | ns | ns | * | ns | ns | ns | * | ns | ns | |
N: number of individuals; M: mean; SD: standard deviation; ns: not significant;
A principal-component analysis was performed for six viscerocranial measurement parameters and the factor loading of each measurement was calculated for the first two principal components that had eigenvalues greater than 1.0 (Table 6). The first and second principal components account for 62.82% of the total variance. The first principal component, accounting for 38.65% of the total variance, was related to all measurement items positively. The first principal component was interpreted as indicating facial size. On the other hand, the second principal component, accounting for 24.17% of the total variance, was associated with the height and breadth of the facial skeletons. The measurements related to breadth had positive factor loadings and those related to height had negative factor loadings. The second principal component was interpreted as indicating either high and narrow or low and wide faces.
| Measurement item | First principal component | Second principal component |
|---|---|---|
| No. 46 Middle facial breadth | 0.51 | 0.57 |
| No. 48 Upper facial height | 0.87 | −0.23 |
| No. 51 Orbital breadth | 0.49 | 0.49 |
| No. 52 Orbital height | 0.59 | −0.34 |
| No. 54 Nasal breadth | 0.33 | 0.70 |
| No. 55 Nasal height | 0.78 | −0.47 |
| Eigenvalue | 2.32 | 1.45 |
| Contribution rate (%) | 38.65 | 24.17 |
The scatter diagram of the principal-component scores of the populations was expressed according to the first two components (Figure 6). The null hypothesis for distributional normality was not rejected at the 5% level by the Kolmogorov–Smirnov test for the first two principal-component scores (P > 0.05). There was no significant difference in the first principal-component scores between the Kamakura and Muromachi samples (P > 0.05). Meanwhile, in the second principal-component scores, the Muromachi series was significantly lower than the Kamakura series (P < 0.05), which demonstrated the change from broad and low faces to narrow and high faces with chronological age.

First and second principal-component scores. Principal-component analysis was conducted on six viscerocranial measurements using 57 medieval male individuals. Their first and second principal scores were plotted. Black triangles: Yuigahama-chusei-shudan-bochi (seika-ichiba); white circles: Kamakura-period individuals; black squares: Muromachi-period individuals other than Yuigahama-chusei-shudan-bochi (seika-ichiba).
When the eigenvectors of the second principal component were applied to the basic statistics of the present and comparative data, the principal-component scores were obtained (Figure 7). The YCSB-SI series showed contrasts with the Jomon and other medieval series and had the lowest second principal-component scores, which were equivalent to those of the Fukagawa and Hitotsubashi series. The YCSB-SI samples had the narrowest and highest faces in the present and comparative data and there was an interpopulation difference in viscerocranial morphology within the medieval period.

The estimated stature of the YCSB-SI skeletons was 158.7 cm for males and 146.3 cm for females using Fujii’s equations based on the maximum length of the right femur, and 144.2 cm in females using Saso and Hanihara’s equations based on the maximum length of the right femur (Table 7). This was not significantly different from the estimated stature of the Yuigahama-minami skeletons (individual and multiple burials) and the Zaimokuza skeletons (P > 0.05), but was several centimeters shorter than that of the Kofun skeletons (P < 0.05) (Table 8).
| Humerus No. 1 Maximum length Right |
Humerus No. 1 Maximum length Left |
Radius No. 1 Maximum length Right |
Radius No. 1 Maximum length Left |
Femur No. 1 Maximum length Right |
Femur No. 1 Maximum length Left |
Tibia No. 1a Maximum length Right |
Tibia No. 1a Maximum length Left | ||
|---|---|---|---|---|---|---|---|---|---|
| Estimation using Fujii’s equations | |||||||||
| Male | N | 6 | 5 | 7 | 6 | 5 | 2 | 5 | 3 |
| M | 155.0 | 157.7 | 156.9 | 157.7 | 158.7 | 160.4 | 155.1 | 155.4 | |
| SD | 4.8 | 3.3 | 4.2 | 4.4 | 6.8 | 1.2 | 0.9 | 0.2 | |
| Female | N | 5 | 4 | 6 | 3 | 4 | 3 | 4 | 5 |
| M | 148.8 | 146.6 | 147.6 | 149.4 | 146.3 | 145.4 | 146.5 | 145.6 | |
| SD | 5.1 | 3.4 | 1.5 | 1.8 | 3.6 | 2.7 | 3.0 | 4.5 | |
| Estimation using Saso and Hanihara’s equations | |||||||||
| Female | N | 5 | 4 | 6 | 3 | 4 | 3 | 4 | 5 |
| M | 146.8 | 144.5 | 146.4 | 147.9 | 144.2 | 143.1 | 145.1 | 144.2 | |
| SD | 4.7 | 3.9 | 1.6 | 1.9 | 3.5 | 2.4 | 3.3 | 4.8 | |
N: number of individuals; M: mean; SD: standard deviation.
| Population | Male | Female | ||||||
|---|---|---|---|---|---|---|---|---|
| N | M (cm) | SD (cm) | t-test | N | M (cm) | SD (cm) | t-test | |
| Yuigahama-chusei-shudan-bochi (seika-ichiba) (This study) | 5 | 158.7 | 6.8 | 4 | 146.3 | 3.6 | ||
| Yuigahama-minami (individual graves) (Nagaoka et al., 2008) | 36 | 157.8 | 4.6 | ns | 31 | 147.3 | 4.3 | ns |
| Yuigahama-minami (multiple graves) (Matsushita, 2002) | 42 | 157.8 | 4.3 | ns | 4 | 147.0 | 4.3 | ns |
| Zaimokuza (Hiramoto, 1972) | 17 | 159.0 | 4.3 | ns | 5 | 144.9 | 3.3 | ns |
| Muromachi (Hiramoto, 1972) | 26 | 156.8 | 4.7 | ns | 17 | 146.6 | 3.8 | ns |
| Jomon (Hiramoto, 1972) | 11 | 159.1 | 4.2 | ns | 9 | 148.1 | 3.0 | ns |
| Kofun (Hiramoto, 1972) | 22 | 163.1 | 5.5 | ns | 9 | 151.5 | 4.8 | * |
| Edo (Hiramoto, 1972) | 95 | 157.1 | 4.5 | ns | 45 | 145.6 | 3.9 | ns |
N: number of individuals; M: mean; SD: standard deviation; ns: not significant;
This study revealed several findings regarding the metric traits of the crania and limb bones of the medieval Japanese: (1) the YCSB-SI series shared dolichocephaly with other medieval series, but they had the highest faces in the medieval series; (2) there is a distinction between the YCSB-SI series and the Jomon series in that the former had a larger length–breadth index of the crania, a higher Virchow’s facial and upper facial indices, a smaller maximum length of the ulnae and tibiae, and a smaller mid-shaft index of the femora than the latter; and (3) the estimated stature of the YCSB-SI skeletons is 158.7 cm in males and 146.3 cm in females using Fujii’s equations based on the maximum length of the femur, which are almost equal to other medieval skeletons but several centimeters shorter than that of the Kofun skeletons.
The first finding is consistent with the previous study by Suzuki (1956) which demonstrated that the Zaimokuza crania were characterized by dolichocephaly, chameprosopy, and prognathism. The peculiarity of the medieval crania has been repeatedly observed throughout Japan (e.g. Nakahashi and Nagai, 1985) and this study again confirms the peculiarity of the medieval people. Although Suzuki (1956) and subsequent studies have emphasized this peculiarity, virtually no attention has been paid to among-site differences in the medieval series. An examination of the variations in cranial metric traits in medieval populations, however, showed that the Zaimokuza series had more dolichocephalic and chameprosopic crania than other medieval series (Nagaoka et al., 2006). Nagaoka et al. (2006) demonstrated that the peculiarity of the medieval series appeared more strongly in the human skeletons of the Kamakura period than in those of the Muromachi period and that the craniometric variations among them reflected chronological differences. This study showed that the YCSB-SI series had a larger upper facial height and smaller nasal breadth than the Zaimokuza series and that the peculiarity appeared more strongly in the human skeletons of the Kamakura period than in those of the Muromachi period. The results of this study clearly demonstrate the presence of a metric variation in the medieval series and that this inhomogeneity can be attributed to chronological age.
The second finding is consistent with previous studies of the secular trends in Japanese morphological features. There is a clear difference between the Jomon series and post-Yayoi series in the incidence of nonmetric cranial and dental traits, and a genetic continuity can be assumed among the post-Yayoi populations (Dodo and Ishida, 1990, 1992; Matsumura, 1994). The distinctive features of the Jomon skeletons, as compared with modern Japanese, can be seen in the longer, broader, and lower braincases, broader and lower faces, larger radiohumeral and tibiofemoral indices, and larger femoral midshaft indices due to stronger pilaster formation on the posterior surfaces of the femora (Yamaguchi, 1982). On the other hand, the YCSB-SI samples exhibited contrasts with the Jomon samples in having higher faces, shorter distal extremities, and a smaller femoral mid-shaft index. A distinction between the YCSB-SI series and the Jomon series strongly supports the finding of previous studies (Dodo and Ishida, 1990, 1992; Matsumura, 1994) and implies that the medieval Japanese are a part of the ancestral lineage of the modern Japanese.
The estimated statures of the medieval people of both sexes generally showed significant differences within the populations from the Yayoi and Kofun periods and there is a gradually decreasing trend in estimated stature from the Kofun period to the medieval and early modern eras (Nagaoka et al., 2008). These secular trends in Japanese stature have been confirmed by previous studies by Hiramoto (1972), Nakahashi (1993), and Wada and Motomura (2000). This third finding confirms the previous finding of a gradually decreasing trend in estimated stature from the Kofun period to the medieval period.
In summary, an examination of the metric traits of the crania and limb bones in the YCSB-SI samples confirmed the typical features of the medieval people and supports the previous findings on the secular trends in morphological traits. This further implies population variability in the metric traits within the medieval series and the peculiarity of the medieval series was more strongly expressed in the Zaimokuza series than in the YCSB-SI series. The population variation is likely to correspond to the chronological ages and therefore the metric traits in the facial skeletons changed with age from broader and lower faces to narrower and higher faces. This study confirms the presence of short-term secular trends in the metric traits even within the medieval period. The metric data of the YCSB-SI human skeletons provides important information on the secular trends in the metric traits of the medieval period.
This study is partially supported by a Grant in-Aid for Young Scientists (B) (No. 23770284) from the Ministry of Education, Culture, Sports, Science and Technology, Japan.
The materials and methods of this study did not include anything that required approval by the ethical committee of our institution.
None