Abstract
The present study aims to outline the genetic makeup of the current population of the town of Yanga (Veracruz State, Mexico), the first Latin American settlement founded by African slaves in Mexico. For this purpose, we carried out the genetic characterization of 60 individuals from Yanga, analysing 15 autosomal short tandem repeats (STRs) and interpreting the results in the context of the admixed population known as Mexican mestizos. The genetic contribution from the three most important human groups in the current admixed Yanga population was calculated using Structure software. We detected a high percentage of Amerindian (48%) and European inheritance (44.7%), and a much less important African contribution (7.3%). These results were then compared with 10 other Mexican mestizo populations. The results fit the tri-hybrid model for admixture characterized by a high genetic contribution from Europeans and Africans in the north—though the African influence is lower—and a decreasing contribution from these two populations to the south and southeast. Conversely, the Amerindian component presents maximum values in the south and minimum values in the north. The Amerindian and European genetic traces are related to their ancestral settlements, but the African contribution can be explained by other parameters. To understand the current African genetic traces, we have to assume that there was a redistribution of these population groups and an important admixture phenomenon which led to the dilution of the African ancestral genetic pool. Furthermore, admixture was favoured by conditions that allowed individuals who intermarried to ascend in social status. These reasons would explain why despite the fact that Yanga was founded by black slaves, high levels of African ancestry are not found in the current population.
Introduction
The genetic composition of Latin American mestizo populations is one of the most fascinating questions facing anthropology today. Most of these populations have Amerindian, European, and African components in different proportions. This is known as the tri-hybrid admixture model (Lisker et al., 1996) based on the separate arrival of the three human groups to the New World.
Although there is still controversy about when the initial peopling of the American continent took place, the latest research supports the hypothesis of a recent settlement (18000 before present (BP)) across the Bering Strait (Tamm et al., 2007; O’Rourke and Raff, 2010).
The first European contact occurred in the late 15th century when the first Spanish explorers arrived in the New World. From this moment on the number of Europeans grew steadily, and by 1820 (Eltis, 1983) some 2.4 million had migrated to America. In the case of Mexico, the vast majority of these immigrants came from the Spanish regions of Andalusia and Extremadura.
The first African slaves were brought to America as an alternative source of labour to the native peoples who had been decimated by epidemics and pressure from the Europeans. The earliest references describe the presence of Africans in the Caribbean in 1520 and in large numbers in continental America by the 16th century. It is estimated that in total between 12 and 15 million African slaves were brought to America (Lovejoy, 1982).
From then on, therefore, Africans, Europeans, and aboriginal Amerindians coexisted in the same territory, although with very different social structures and behaviour. For example, the first chroniclers described the behaviour of the natives as submissive, while Africans were generally considered to be disobedient, and escapes and insurrections were frequent. These African rebels were known as maroons (in Spanish ‘cimarrones’), that is to say, fugitive black slaves, and the self-governing communities they founded were called ‘palenques’ (Landers, 2006).
The Palenque de San Basilio (Colombia) is considered to be the first free, black town in the New Continent (Sudarkasa, 1980). In 1713, the King of Spain, through the ‘Cédula del Perdón,’ granted the escaped slaves their freedom and assigned them the ownership of certain territories. However, according to other authors (Cruz-Carretero, 2005; Vinson and Restall, 2009), by 1630 there was already a free palenque, San Lorenzo de los Negros, which until 1932 was referred to as Yanga (Veracruz State, Mexico) in memory of the ‘cimarron’ chief who led the first rebellion. In 1609, after 20 years of rebellion, the colonial government gave permission to Yanga to found a settlement (Memoria Política de México, 2014) for the first free African slaves in America. Since its foundation, and even today, Yanga acquired a symbolic value as a refuge for African fugitives and a landmark for African identity in Mexico (Rinaudo, 2011). The current population of Yanga is over 16000 and the economy of the area is based on growing corn and sugar cane.
The main objective of this work is to determine the proportion of African ancestry that currently exists in the town of Yanga using short tandem repeats (STRs); in other words, whether or not the history and the African identity of Yanga is reflected in its current genetic composition. The results will be interpreted in the context of Mexican mestizo populations.
Materials and Methods
Samples
Sixty samples were selected without considering donor phenotype or other characteristics. We chose this strategy because the objective of the study was not to trace the ancestry of individual donors, but rather to determine the genetic composition of a population with African origins and to find the parameters that could explain this distribution. Hair samples were plucked with tweezers from 60 healthy individuals whose four grandparents were all born in the town of Yanga (Veracruz). In order to avoid underestimating the genetic diversity, the donors chosen were unrelated. To be sure of this, the names from the surveys were compared and donors were asked if any other family members were included in the study. We received written consent from each of the donors and also carried out a survey to obtain more information about their family origins.
Genetic markers
Traditionally, these markers have been used in forensic genetics (Butler, 2006), which has resulted in the characterization of a large number of population groups worldwide. This allows us to compare our results with those obtained in other studies and integrate the information in a geographical context, and therefore to study population characteristics such as admixture, genetic structure, and migration (Wang et al., 2008). In this study 13 common markers have been used for the populations (all except D2S1338 and D19S433).
DNA was extracted using the Chelex® method, and amplifications were carried out with the AmpFlSTR® IdentifilerTM kit. Genotypes were analysed by means of capillary gel electrophoresis using an ABI PrismTM 310 Genetic Analyzer (Applied Biosystems).
The ancestral populations
In order to estimate the admixture composition of the Yanga population and another 10 mestizo groups from Mexico (Table 1, Figure 1), individual genotypes were compared to three ancestral populations, which should represent as closely as possible the populations from the tri-hybrid model.
Table 1
Geographical origins, sample size and bibliographical references of the admixture and ancestral populations used in this work
| Population |
Geographical region |
Sample size |
Reference |
| Admixed population |
| Chihuahua |
North Center |
162 |
Martínez-González et al., 2005 |
| Nuevo Leon |
Northeast |
143 |
Cerda-Flores et al., 2002a |
| Jalisco |
West |
309 |
Rubi-Castellanos et al., 2009 |
| Guanajuato |
Center West |
331 |
Rangel-Villalobos et al., 2010 |
| Yanga |
Center–East |
60 |
This study |
| Metztitlán |
Center |
104 |
Gorostiza et al., 2007 |
| México City |
Center |
234 |
Luna-Vázquez et al., 2005 |
| Puebla |
Center |
313 |
Rubi-Castellanos et al., 2009 |
| Veracruz |
Center–East |
200 |
Rangel-Villalobos et al., 2010 |
| Campeche |
Southeast |
106 |
Sánchez et al., 2005 |
| Yucatán |
Southeast |
262 |
Rubi-Castellanos et al., 2009 |
| Ancestral populations |
| Fang |
Africa |
115 |
Calzada et al., 2004 |
| Andaluces |
Spain |
198 |
Sanz et al., 2001 |
| Purepechas |
Center |
57 |
Rubí-Castellanos et al., 2009 |
The European population is represented by Andalusians from the southwest of Spain (Carvajal-Carmona et al., 2000). The African population selected was the Fangs (Calzada et al., 2004) from western central Africa (Equatorial Guinea) because a large proportion (approximately 34.5%) of the slaves came from this region (Salas et al., 2004). As regards the Amerindian reference, the Purépecha indigenous group was chosen because it was the indigenous population with the highest genetic distances relative to Fangs and Andalusians, FST = 0.08 and 0.05, respectively (data not shown).
Statistical analysis
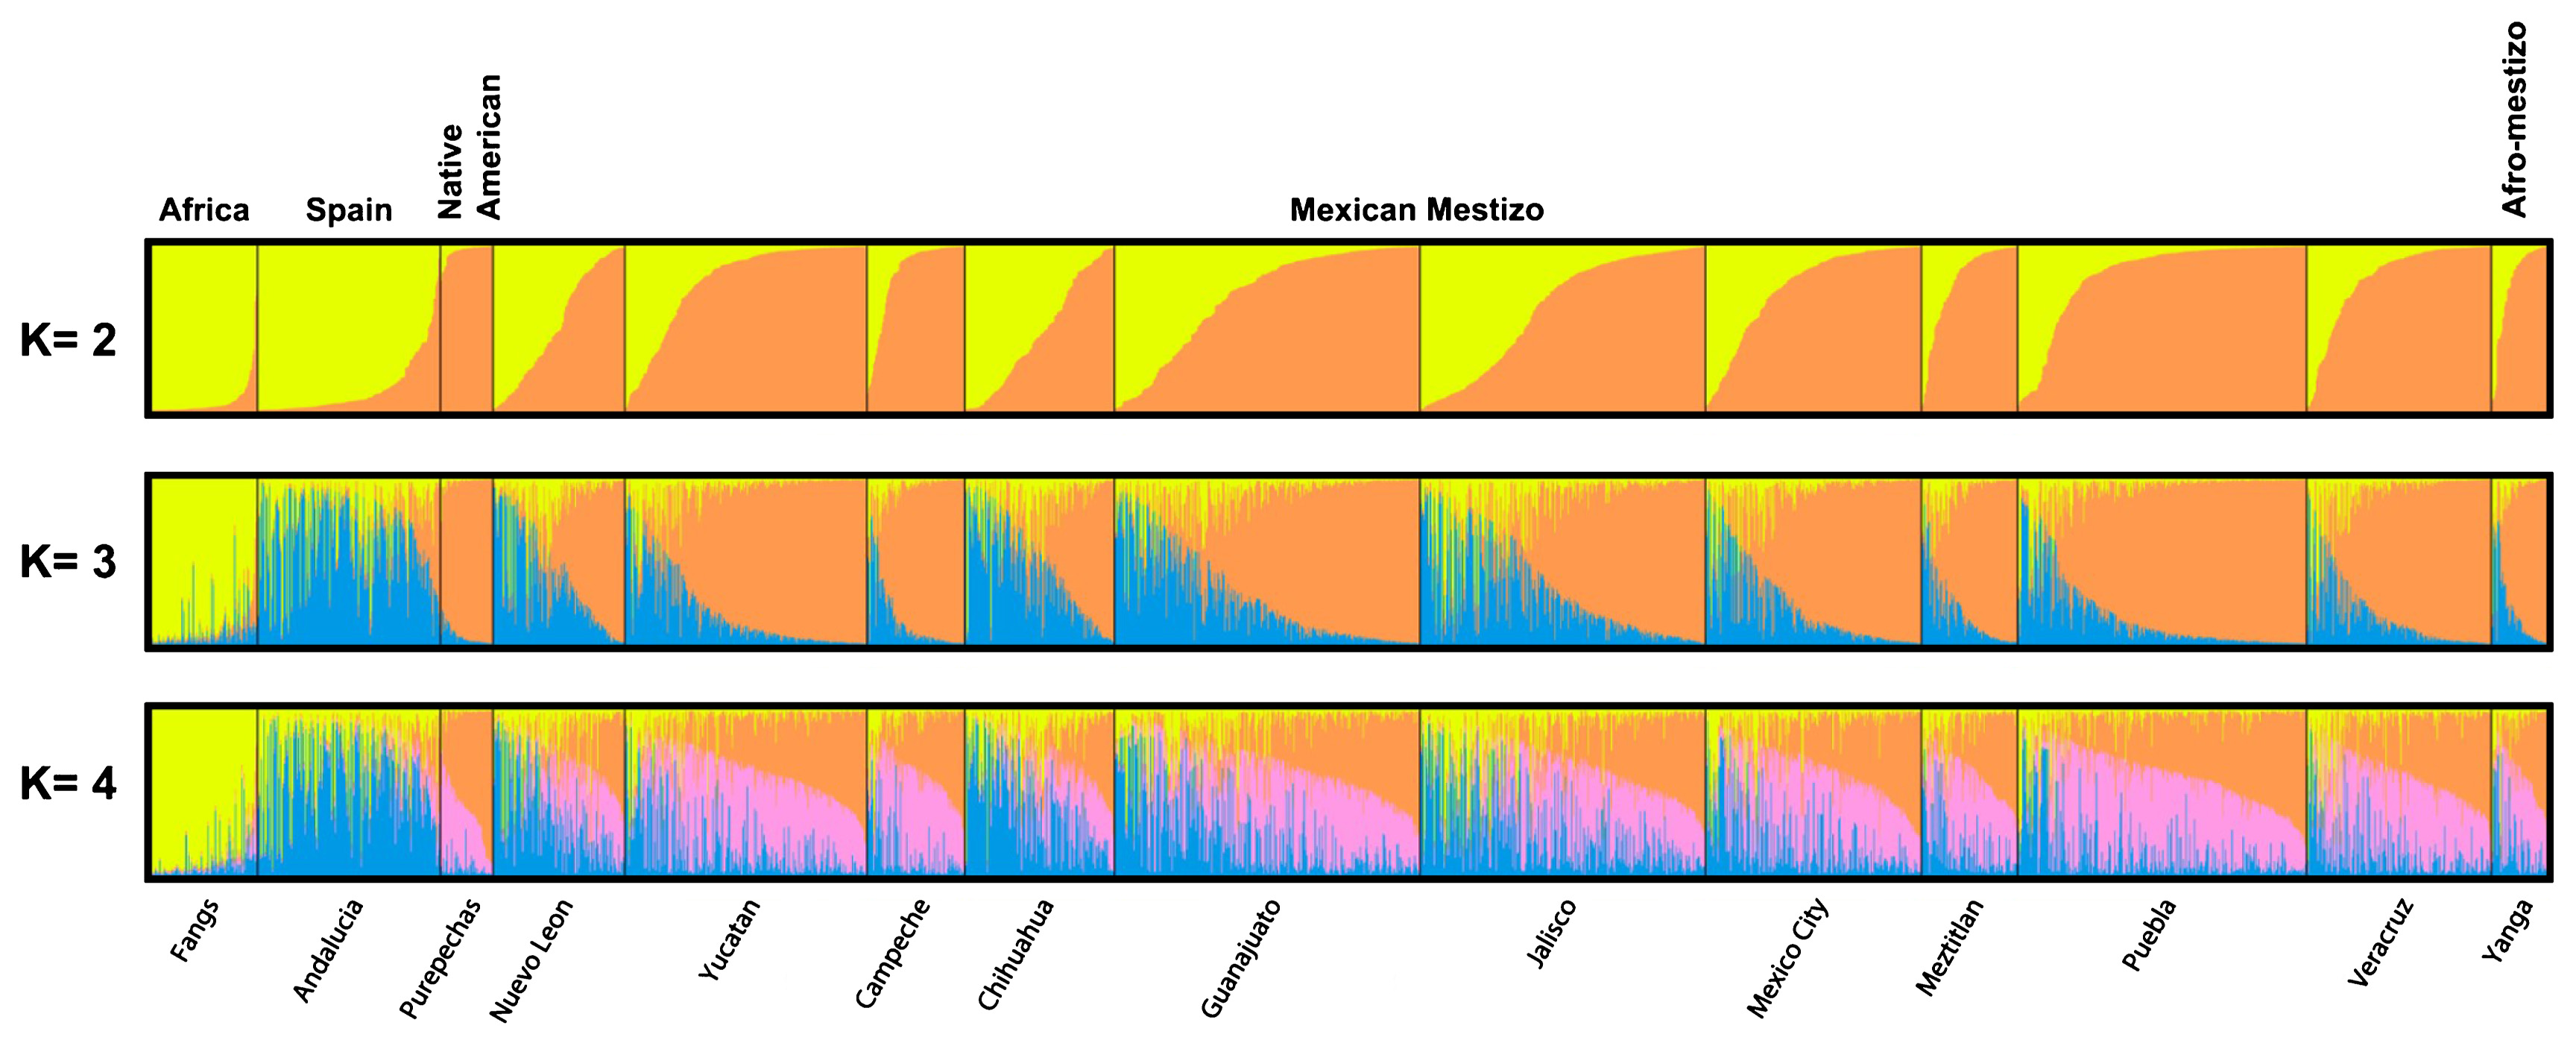
Allele frequencies, Hardy–Weinberg equilibrium, genetic distances (FST) and AMOVAs (molecular analysis of variance) were performed with the Arlequin 5.5.1.2 program (Excoffier et al., 2005). Admixture estimates were obtained by applying the Structure programme (Falush et al., 2003) using the admixture model with correlated frequencies and a separate α value to manage the asymmetric admixture observed in Mexican mestizo populations. We ran 35000 replications of the proposed tri-hybrid model (K = 3), with 25 iterations after a burn-in period of 5000. Thereafter, the output was analysed using CLUMPP software (Jakobsson and Rosenberg, 2007) and the DISTRUCT programme (Rosenberg, 2004). Genetic distances and the Pearson’s correlation coefficient (r) were plotted by means of multidimensional scaling (MDS) using XLSTAT.
Results
Allele frequencies for 15 STRs in the Yanga population are shown in Table 2. For some samples incomplete profiles were obtained, perhaps because of the Chelex extraction; however, good results for plucked hair samples were included in other studies (Sánchez et al., 2005; Barrot et al., 2007). Structure software was used to determine the individual and population admixture components depending on the contribution from parental populations. The results are displayed in a bar graph (Figure 1). These analyses show that Mexican admixed populations have a high percentage of Amerindian and European ancestry and a low percentage of African ancestry, ranging from 6.8% to 9.7%.
Table 2
Allele frequencies for the 15 STRs characterized for the Yanga population. All markers are under Hardy–Weinberg equilibrium, including D13S317 and FGA after the application of Bonferroni correction (α = 0.008 and α = 0.001, respectively)
| Alelle |
D8S1179
n = 58 |
D21S11
n = 58 |
D7S820
n = 57 |
CSF1PO
n = 54 |
D3S1358
n = 59 |
TH01
n = 55 |
D13S317
n = 60 |
D16S539
n = 55 |
D2S1338
n = 54 |
D19S433
n = 57 |
vWA
n = 59 |
TPOX
n = 46 |
D18S51
n = 55 |
D5S818
n = 60 |
FGA
n = 51 |
| 6 |
|
|
|
|
|
0.318 |
|
|
|
|
|
|
|
|
|
| 7 |
|
|
0.018 |
|
|
0.409 |
|
|
|
|
|
|
|
0.083 |
|
| 8 |
|
|
0.044 |
|
|
0.027 |
0.075 |
|
|
|
|
0.402 |
|
0.008 |
|
| 9 |
|
|
0.035 |
0.019 |
|
0.055 |
0.183 |
0.109 |
|
|
|
0.076 |
|
0.042 |
|
| 9.3 |
|
|
|
|
|
0.191 |
|
|
|
|
|
|
|
|
|
| 10 |
0.078 |
|
0.289 |
0.306 |
|
|
0.100 |
0.218 |
|
|
|
0.033 |
0.009 |
0.067 |
|
| 11 |
0.078 |
|
0.281 |
0.306 |
|
|
0.250 |
0.282 |
|
|
|
0.359 |
|
0.542 |
|
| 11.2 |
|
|
|
|
|
|
|
|
|
0.009 |
|
|
|
|
|
| 12 |
0.147 |
|
0.219 |
0.306 |
|
|
0.200 |
0.300 |
|
0.017 |
|
0.130 |
0.136 |
0.192 |
|
| 12.2 |
|
|
|
|
|
|
|
|
|
0.026 |
|
|
|
|
|
| 13 |
0.310 |
|
0.096 |
0.046 |
|
|
0.117 |
0.073 |
|
0.140 |
|
|
0.136 |
0.067 |
|
| 13.2 |
|
|
|
|
|
|
|
|
|
0.123 |
|
|
|
|
|
| 14 |
0.250 |
|
0.018 |
0.019 |
0.034 |
|
0.075 |
0.018 |
|
0.281 |
0.076 |
|
0.145 |
|
|
| 14.2 |
|
|
|
|
|
|
|
|
|
0.061 |
|
|
|
|
|
| 15 |
0.112 |
|
|
|
0.500 |
|
|
|
|
0.175 |
0.051 |
|
0.145 |
|
|
| 15.2 |
|
|
|
|
|
|
|
|
|
0.079 |
|
|
|
|
|
| 16 |
0.026 |
|
|
|
0.254 |
|
|
|
|
0.044 |
0.415 |
|
0.082 |
|
|
| 16.2 |
|
|
|
|
|
|
|
|
|
0.035 |
|
|
|
|
|
| 17 |
|
|
|
|
0.169 |
|
|
|
0.137 |
|
0.305 |
|
0.200 |
|
|
| 17.2 |
|
|
|
|
|
|
|
|
|
0.009 |
|
|
|
|
|
| 18 |
|
|
|
|
0.034 |
|
|
|
0.059 |
|
0.102 |
|
0.055 |
|
0.010 |
| 19 |
|
|
|
|
0.008 |
|
|
|
0.304 |
|
0.051 |
|
0.036 |
|
0.098 |
| 20 |
|
|
|
|
|
|
|
|
0.196 |
|
|
|
0.009 |
|
0.069 |
| 21 |
|
|
|
|
|
|
|
|
0.010 |
|
|
|
0.018 |
|
0.069 |
| 22 |
|
|
|
|
|
|
|
|
0.088 |
|
|
|
0.018 |
|
0.118 |
| 23 |
|
|
|
|
|
|
|
|
0.127 |
|
|
|
|
|
0.118 |
| 24 |
|
|
|
|
|
|
|
|
0.069 |
|
|
|
0.009 |
|
0.147 |
| 25 |
|
|
|
|
|
|
|
|
0.010 |
|
|
|
|
|
0.176 |
| 26 |
|
|
|
|
|
|
|
|
|
|
|
|
|
|
0.157 |
| 27 |
|
|
|
|
|
|
|
|
|
|
|
|
|
|
0.039 |
| 28 |
|
0.052 |
|
|
|
|
|
|
|
|
|
|
|
|
|
| 29 |
|
0.172 |
|
|
|
|
|
|
|
|
|
|
|
|
|
| 30 |
|
0.284 |
|
|
|
|
|
|
|
|
|
|
|
|
|
| 31 |
|
0.078 |
|
|
|
|
|
|
|
|
|
|
|
|
|
| 31.2 |
|
0.138 |
|
|
|
|
|
|
|
|
|
|
|
|
|
| 32 |
|
0.034 |
|
|
|
|
|
|
|
|
|
|
|
|
|
| 32.2 |
|
0.190 |
|
|
|
|
|
|
|
|
|
|
|
|
|
| 33.2 |
|
0.034 |
|
|
|
|
|
|
|
|
|
|
|
|
|
| 34.2 |
|
0.009 |
|
|
|
|
|
|
|
|
|
|
|
|
|
| 35.2 |
|
0.009 |
|
|
|
|
|
|
|
|
|
|
|
|
|
| p value |
0.514 |
0.377 |
0.919 |
0.184 |
0.384 |
0.179 |
0.049 |
0.709 |
0.937 |
0.523 |
0.836 |
0.752 |
0.793 |
0.103 |
0.033 |
In order to show easily the tri-hybrid model and clearly understand the individual variation in each ancestral contribution, Figure 2 represents individual admixtures taking into consideration different numbers of clusters (K = 3).
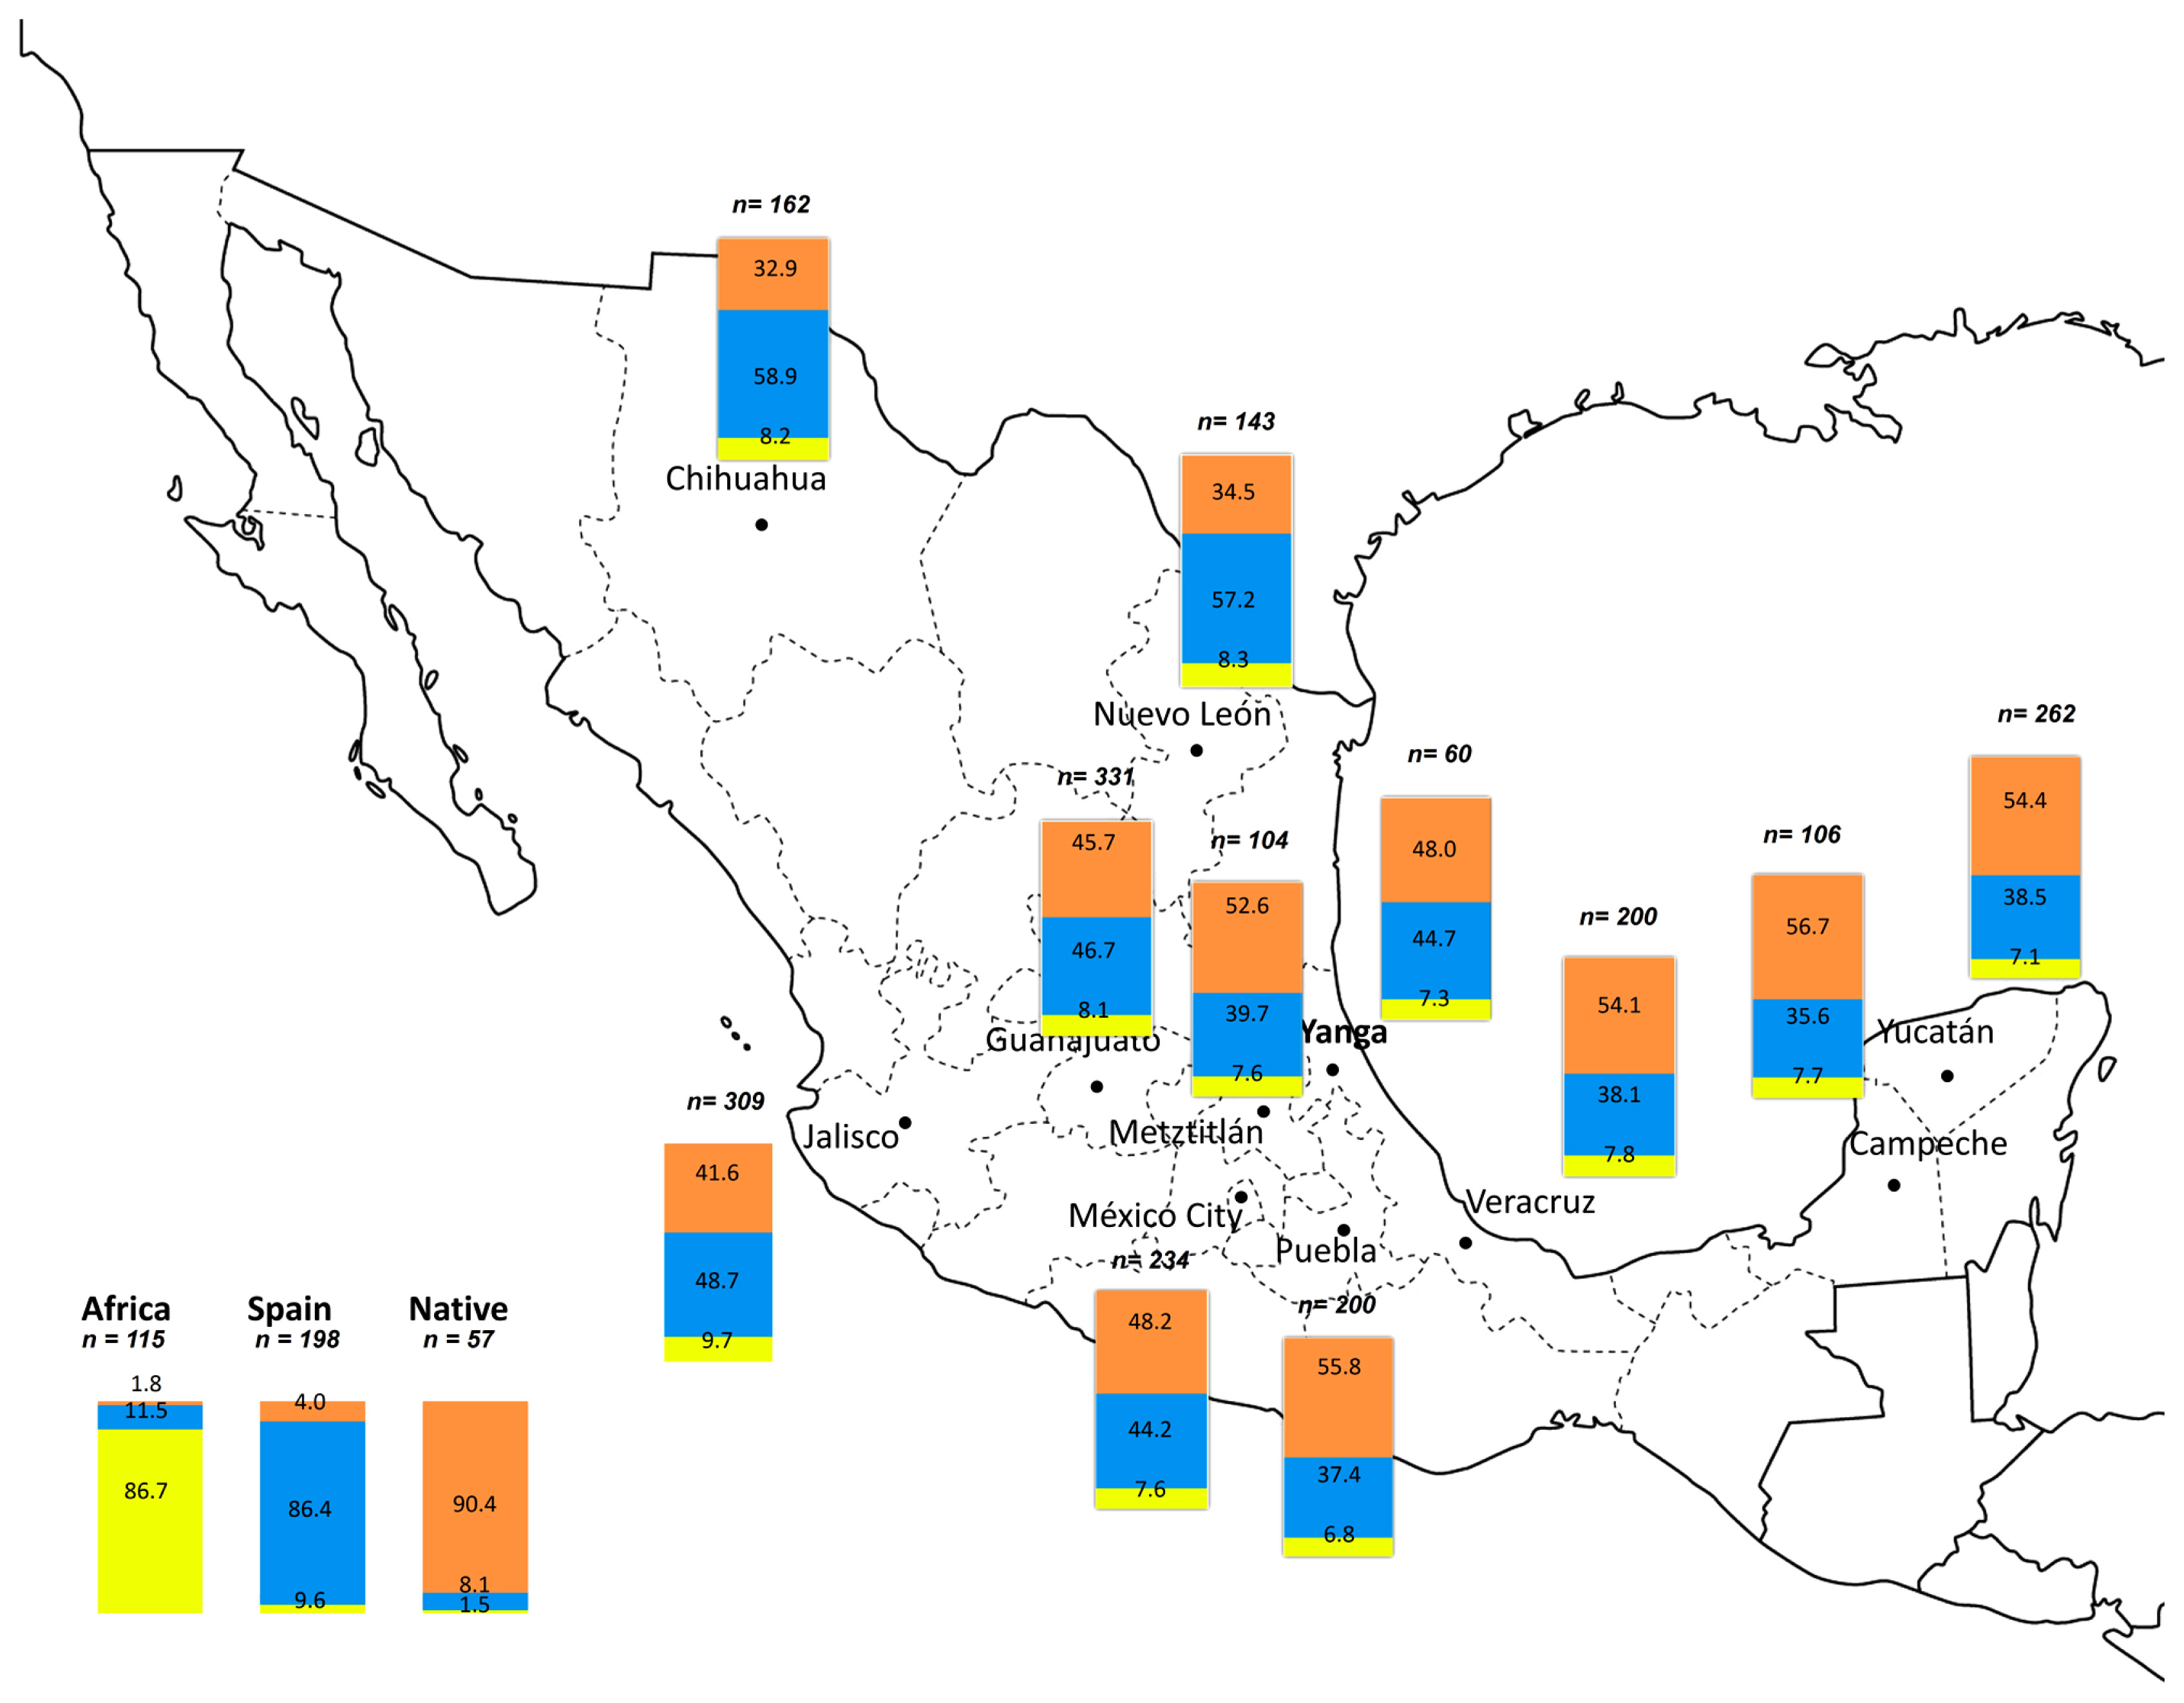
The main genetic contribution from ancestral populations to Yanga is Amerindian (48%) and European (44.7%), whereas only 7.3% is of African ancestry. In general the Amerindian ancestry is the major lineage detected in the south and centre of the Mexican Republic: 56.7% in Campeche, 55.8% in Puebla, and 54.4% in Yucatán.
The populations that have a higher African contribution are the ones from the northwest: Jalisco (9.7%), Nuevo León (8.3%), and Chihuahua (8.2%). These also show a higher European contribution (48.7%, 57.2%, and 58.9%, respectively).
In fact, the distribution pattern of African ancestry is similar to that of the European contribution, although it has much lower values for these same populations. This pattern is reversed when considering the Amerindian influence, i.e. it is higher in the south and lower in the north. The frequency distribution for African ancestry correlates inversely with the Amerindian one (r = −0.619; P = 0.042) and the latter also inversely with European ancestry (r = −0.997; P = 0.0001).
The genetic distances (FST) have been represented in an MDS with a level of stress = 0.197, which is a suitable value for the 14 populations studied (Sturrock and Rocha, 2000). The graph in Figure 3 shows that the mestizo populations form a homogeneous cluster. The vast majority of these populations are found around the area of European and Amerindian influence and coincide with the results obtained using Structure software (Figure 1). Yanga appears in the display close to the reference Amerindian group, and to a lesser extent to the Europeans. Moreover, the populations in the south and the southeast are closer to the Amerindian reference.
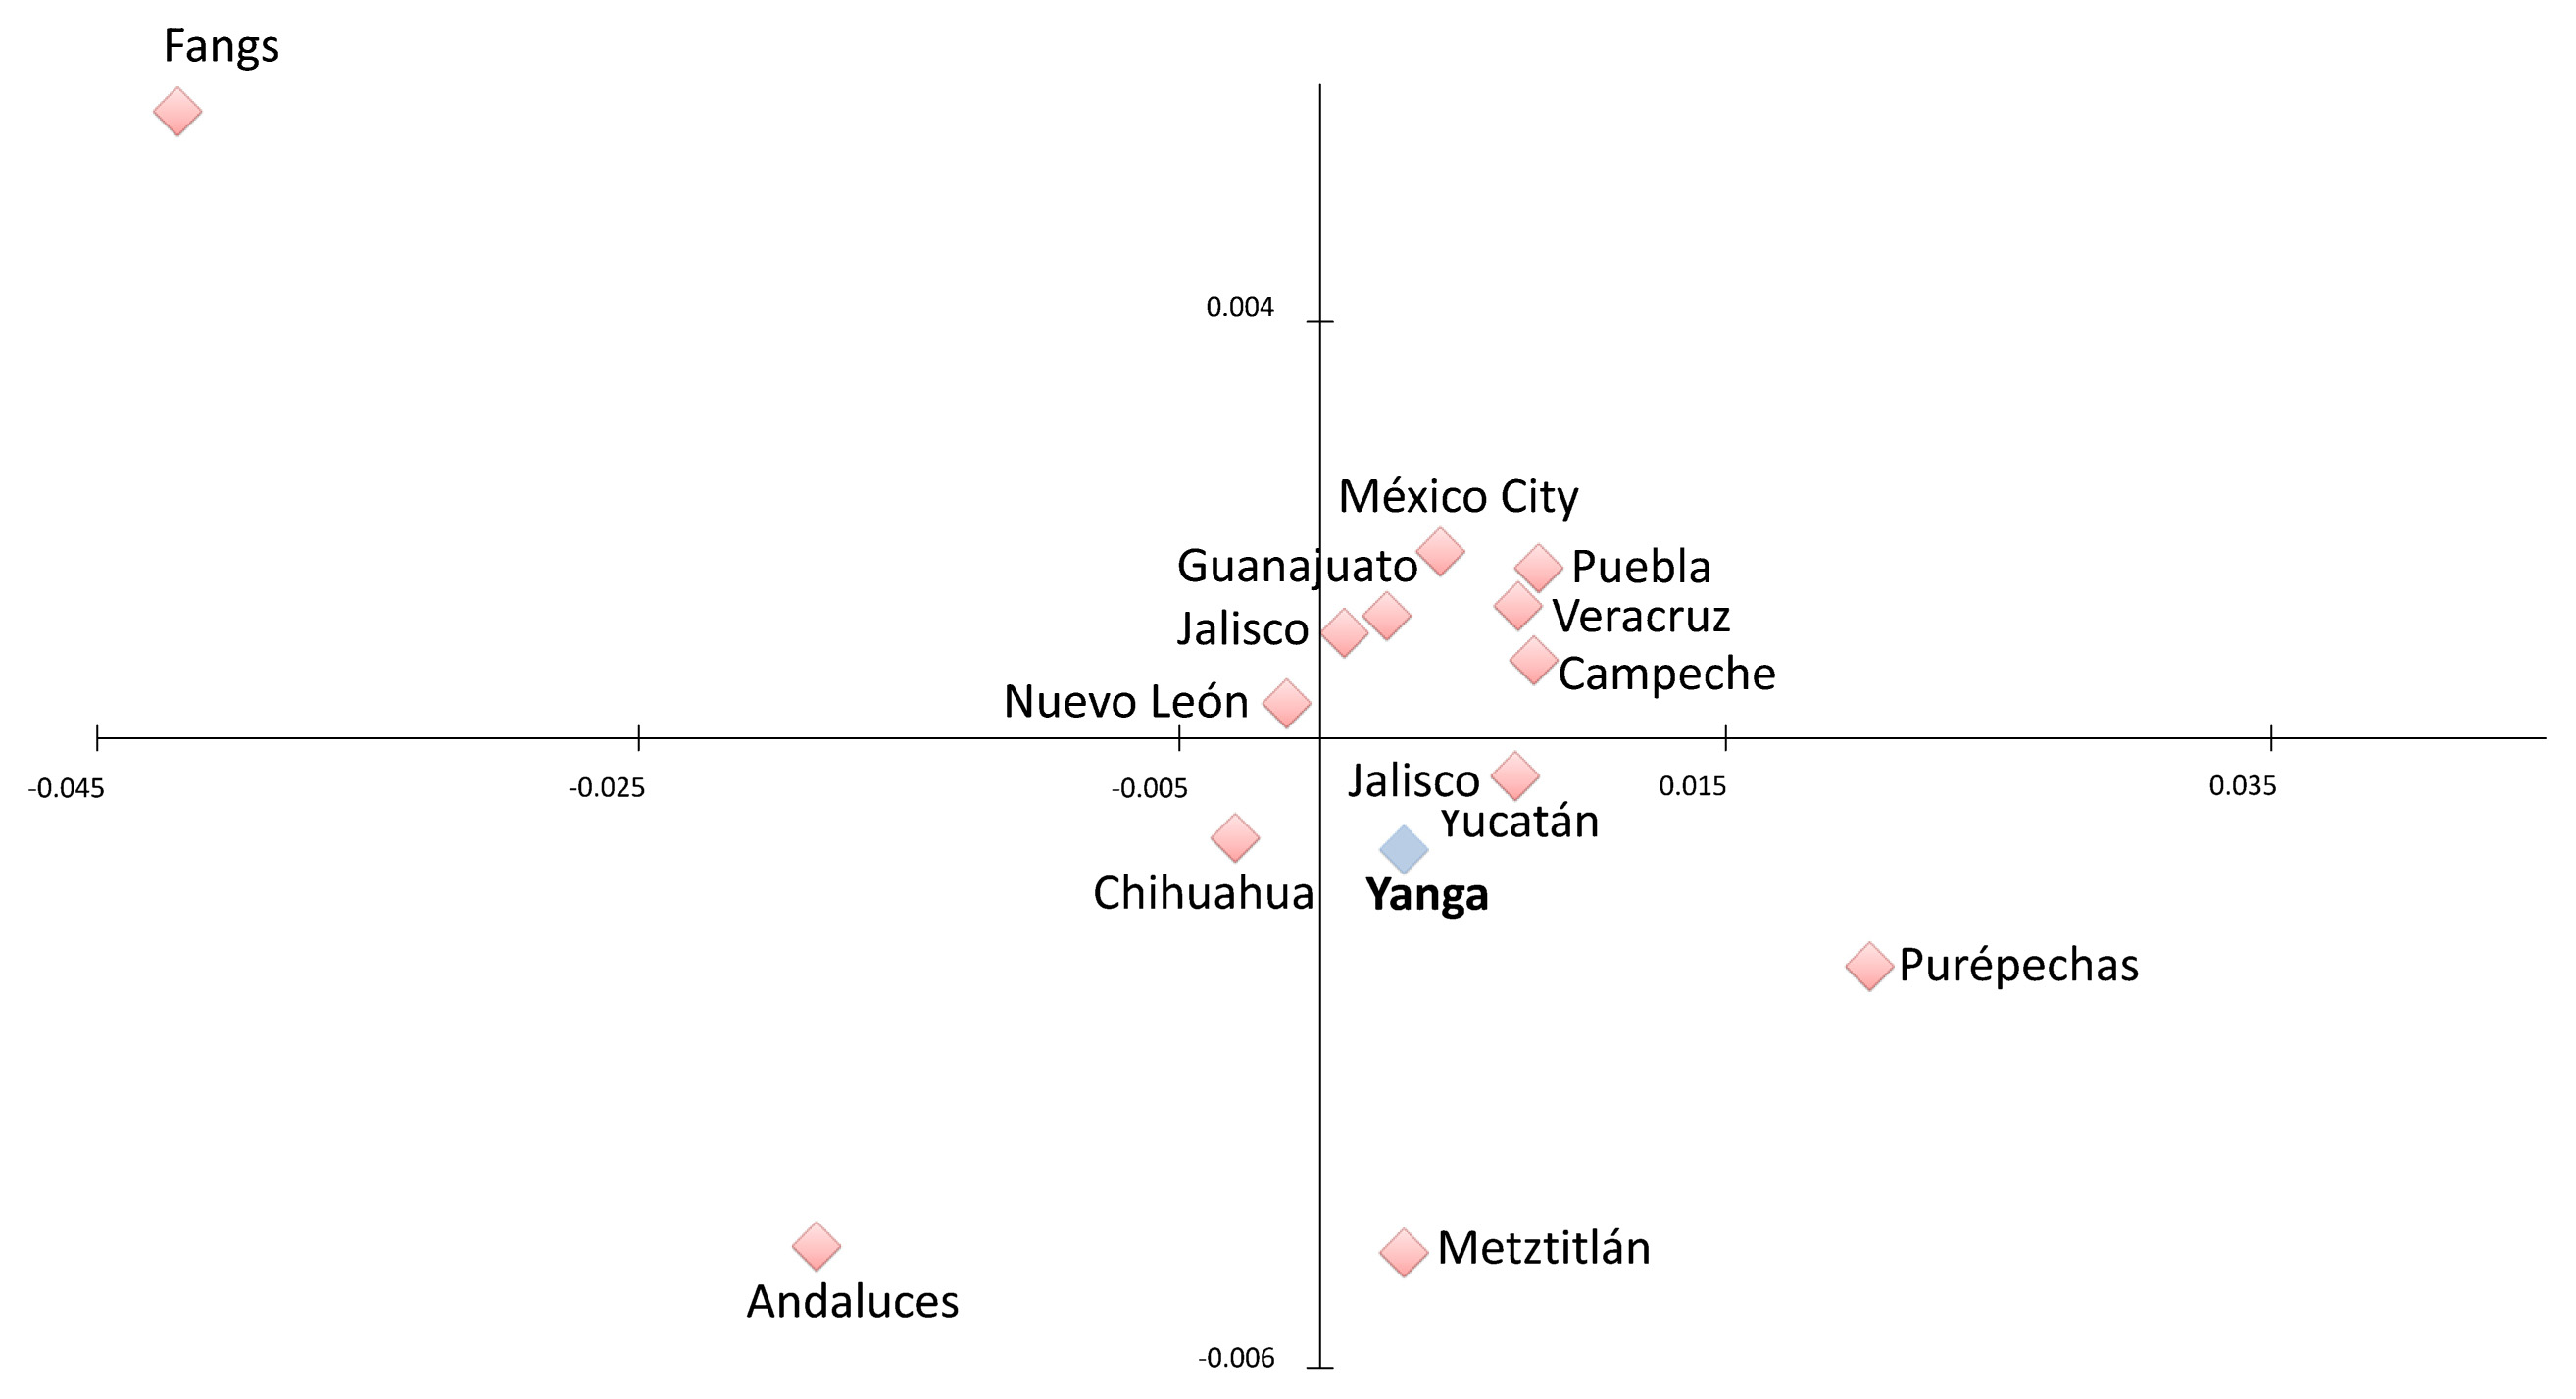
In this context Metztitlan is worthy of special mention as it lies at a considerable distance from the cluster formed by the other admixed populations. In fact, its position indicates that the influence of Amerindian and European ancestors is significant. In general in these latitudes the proportion of Amerindian ancestry in the gene pool of the populations tends to decrease and the European contribution to rise. However, the results show that the Metztitlan population has a relatively high percentage of Native American ancestry.
In order to determine whether any genetic structure exists among the Mexican admixed populations, AMOVAs based on geographical area criteria were conducted (Table 3). The cumulative variability among groups, in both cases, was not significant (FCT = 0.0018, P = 0.0580 and FCT = 0.0018, P = 0.0540).
Table 3
Results of AMOVAs applied to different criteria of the geographical groups
| Grouping criteria |
Groups |
Populations |
|
Variance |
Fixation index |
P |
| Geography I |
North |
Nuevo León, Chihuahua, Jalisco, Guadalajara |
Within populations |
99.72 |
FST = 0.0028 |
0.000 |
| Center |
Metztitlán, México City, Veracruz, Yanga |
Among populations within groups |
0.10 |
FSC = 0.0010 |
0.000 |
| South |
Campeche, Yucatán, Puebla |
Among groups |
0.18 |
FCT = 0.0018 |
0.058 |
| Geography II |
North |
Nuevo León, Chihuahua |
Within populations |
99.72 |
FST = 0.0028 |
0.000 |
| Central north |
Jalisco, Guadalajara |
Among populations within groups |
0.10 |
FSC = 0.0010 |
0.000 |
| Oriental coast |
Veracruz, Yanga |
Among groups |
0.18 |
FCT = 0.0018 |
0.054 |
| Center |
Metztitlán, México City, Puebla |
|
|
|
|
| Southeast |
Campeche, Yucatán |
|
|
|
|
* Significant results (
P < 0.005).
Discussion
Fifteen autosomal STRs have been used for the genetic characterization of the population. Previous studies demonstrate the robustness of these markers when analysing the phenomenon of admixture (de Assis Poiares et al., 2010; González-Herrera et al., 2010; Kraaijenbrink et al., 2014).
Two models can describe the different contributions from the ancestral groups to the Mexican mestizo populations. The first model presupposes that the African contribution should be lowest on the central high plateau and highest on the coast (Serrano, 1993), coinciding with the coastal regions of Veracruz and Acapulco that were collectors of African population. Veracruz was the principal slave harbour in the American continent. Acapulco’s importance was based on the fact that it was the starting point and destination for the Manila Galleons (Schurtz et al., 1992), whose stevedores were usually of African origin (Campos, 1999). This hypothesis was based on classical markers which showed that the African contribution varied between 25.6% and 40.5% in Veracruz (Lisker and Babinsky, 1986) and 33.7% in Guerrero (Lisker, 1981). However, it was almost absent in the northern populations (Cerda-Flores and Garza-Chapa, 1989). The 7.2% of African contribution detected in Yanga does not fit this model.
The second hypothesis, based on new molecular techniques, describes a model in which there is a north–south gradient between a high frequency of European and African ancestry in the north and a significant Amerindian ancestry presence in the south. This distribution is justified by the presence of African slaves in the North who had escaped from the cotton plantations in the south of the USA (Green et al., 2000) and the preference of the European population to settle in the north (Licea-Cadena et al., 2006). On the other hand, the southeast was more hostile for Africans and Europeans (Menegus, 2006), as evidenced by the frequent revolts against these groups.
Studies based on uniparental markers, such as chromosome Y (xYAP), show an African contribution of only 1% in Guerrero (Bonilla et al., 2005), and similar low frequencies were detected in Costa Grande of Oaxaca (Rangel-Villalobos et al., 2008). Others studies, in this case based on sequencing of the hypervariable I region of the mitochondrial DNA, support this idea, detecting African variants in Chihuahua with values between 4.1% and 5% (Green et al., 2000). Analysis of autosomal markers has shown that the African contribution in Nuevo León (3.2%) was higher than the one obtained using classical markers (Cerda-Flores et al., 2002a). Human leucocyte antigen (Human Leukocyte antigen) studies also support the relatively high African gene presence in the northern Mexican states, reaching a level of 5.02% in Nuevo León (Cerda-Flores et al., 2002b). Results of studies based on STRs provide further support for this idea and show a positive correlation between European and African contributions, while confirming an inverse correlation between these two contributions and the Amerindian one.
The interesting question, therefore, is what happened to the African populations to bring about the current distribution? Two complementary possibilities can be proposed, one methodological and one historical. Regarding the first, some authors consider that STRs underestimate the African contribution (Callegari-Jacques et al., 2003). However, this explanation seems unlikely given that analyses performed using 1814 ancestry informative markers (AIMs) agree with our results (Silva-Zolezzi et al., 2009). Another aspect is to consider the origin of the samples. During the 18th century the European and African populations were concentrated in urban areas (Cook and Borah, 1974), meaning that it would be interesting to determine if samples are from rural or urban regions.
The historical contributions are closely related to the dilution of the African genetic component and may be summarized in the following points: (i) the misconception that the founding population of Yanga was exclusively African, since chronicles describe that it was composed of 80 black men and 24 black women, some children and a few indigenous people (Laurencio and Pasquel, 1974); (ii) the high mobility of African people during the 18th century and the large number of Spanish people who settled in the city in 1768 (Cruz-Carretero, 2005); (iii) the introduction of slaves in America ceases after the 18th century (Aguirre-Beltrán, 1989); and (iv) social pressure in favor of admixing between Africans and other colonial groups in order to attain a higher status for their descendants (Barquera and Acuña-Alonzo, 2012).
Despite this model, a certain degree of geographical oscillation in the African contribution can be detected. The results of AMOVAs confirm that no genetic structure exists among mestizo populations, since the differences in their ancestral composition are not of sufficient importance for subdivisions to be created. In this sense, therefore, admixture behaves as a continuous variable.
Identity is a very complex concept and is related both to group membership and the perception of oneself (McNamara, 2012). Although this is a matter far beyond the objectives of this study, a brief comment on the results and their relation to the defence of identity in Yanga is of interest: the community of Yanga is proud of its history and its African roots, giving its members unique identity traits (Pérez Monfort, 2007). The results presented here confirm that identity—individual and collective—goes beyond the biological and genetic reality.
Conclusions
This study confirms, on the one hand, the value of STRs as a tool with which to study the admixture phenomenon in Latin America. In addition, the results support the existence of a tri-hybrid model that varies across Mexico depending on the contribution of the three ancestral populations (Amerindian, European, and African). In brief, it detects the existence of a north–south gradient in the contribution of European and African genetic components, although much less intense in the case of the latter. This gradient coincides inversely with the Amerindian contribution, which presents a maximum value in the south and southeast and a minimum value in the north.
On the other hand, it also confirms that the parameters that explain the distribution of European and indigenous contributions are related to their demographic and historical past, whereas the African contribution reflects the geographical redistribution that took place of the people of African descent, together with an important phenomenon of genetic dilution. In this context, Yanga would represent an interesting example as a collection centre of African population— given its uniqueness as the first free palenque of America— and a reference for Afro-American community identity despite its relatively low African genetic imprint.
Acknowledgments
We thank the Consejo Nacional de Ciencia y Tecnología (grant CONACyT 129693) for their partial support to this project for H.R.-V. The authors report no conflicts of interest.
References
- Aguirre-Beltrán G. (1989) La población negra de México, estudio etnohistórico. Fondo de cultura económica, México (in Spanish).
- Barquera R. and Acuña-Alonzo V. (2012) The African colonial migration into Mexico: history and biological consequences. In: Crawford M.H. and Campbell B.C. (eds.), Causes and Consequences of Human Migration: An Evolutionary Perspective. Cambridge University Press, Cambridge, pp. 201– 223.
- Barrot C., Simili C., Sánchez C., Brandt-Casadevall C., González-Martín A., Xifró A., Ortega M., Huguet E., Corbella J. and Gené M. (2007) Haplotype frequencies of eight Y-chromosome short tandem repeats loci in four Amerindian populations (state of Hidalgo, Mexico). Journal of Forensic Science, 52: 504–506.
- Bonilla C., Gutiérrez G., Parra E.J., Kline C. and Shriver M.D. (2005) Admixture analysis of a rural population of the state of Guerrero, Mexico. American Journal of Physical Anthropology, 128: 861–869.
- Butler J.M. (2006) Genetics and genomics of core short tandem repeat loci used in human identity testing. Journal of Forensic Science, 51: 253–265.
- Callegari-Jacques S.M., Grattapaglia D., Salzano F.M., Salamoni S.P., Crossetti S.G., Ferreira M.E. and Hutz M.H. (2003) Historical genetics: spatiotemporal analysis of the formation of the Brazilian population. American Journal of Human Biology, 15: 824–834.
- Calzada P., Suárez I., García S., Barrot C., Sánchez C., Ortega M., Mas J., Huguet E., Corbella J. and Gené M. (2004) The Fang population of Equatorial Guinea characterised by 15 STR-PCR polymorphisms. International Journal of Legal Medicine, 119: 107–110
- Campos L.E. (1999) Negros y morenos. La población afromexicana de la Costa Chica de Oaxaca. In: Barabas A.M. and Bartolomé, M.A. (eds.), Configuraciones étnicas en Oaxaca: Perspectivas etnográficas para las autonomías. Instituto Nacional Indigenista. Instituto Nacional de Antropología e Historia. México, pp. 145–182 (in Spanish).
- Carvajal-Carmona L.G., Soto I.D., Pineda N., Ortíz-Barrientos D., Duque C., Ospina-Duque J., McCarthy M., Montoya P., Alvarez V.M., Bedoya G. and Ruiz-Linares A. (2000) Strong Amerind/white sex bias and a possible Sephardic contribution among the founders of a population in northwest Colombia. American Journal of Human Genetics, 67: 1287–1295.
- Cerda-Flores R.M. and Garza-Chapa R. (1989) Variation in the gene frequencies of three generations of humans from Monterrey, Nuevo León, Mexico. Human Biology, 61: 249–261.
- Cerda-Flores R.M., Budowle B., Jin L., Barton S.A., Deka R. and Chakraborty R. (2002a) Maximum likelihood estimates of admixture in northeastern Mexico using 13 short tandem repeat loci. American Journal of Human Biology, 14: 429–439.
- Cerda-Flores R.M., Villalobos-Torres M.C., Barrera-Saldaña H.A., Cortés-Prieto L.M., Barajas L.O., Rivas F., Carracedo A., Zhong Y., Barton S.A. and Chakraborty R. (2002b) Genetic admixture in three Mexican Mestizo populations based on D1S80 and HLA-DQA1 loci. American Journal of Human Biology, 14: 257–263.
- Cook F.S. and Borah W. (1974) Essay in Population History. Mexico and the Caribbean. University of California Press, Los Angeles, Vol. 2.
- Cruz-Carretero S. (2005) Yanga and the Black Origins of Mexico. Review of Black Political Economy, 33: 73–77.
- de Assis Poiares L., de Sá Osorio P., Spanhol F.A., Coltre S.C., Rodenbusch R., Gusmão L., Largura A., Sandrini F. and da Silva C.M.D. (2010) Allele frequencies of 15 STRs in a representative sample of the Brazilian population. Forensic Science International: Genetics, 4: 61–63.
- Eltis D. (1983) Free and coerced transatlantic migrations: some comparisons. American Historical Review, 88: 251–278.
- Excoffier L., Laval G. and Schneider S. (2005) Arlequin (version 3.0): an integrated software packaged for population genetics data analysis. Evolution Bioinformatic Online, 1: 47–50.
- Falush D., Matthew S. and Pritchard J.K. (2003) Inference of population structure using multilocus genotype data: extensions to linked loci and correlated allele frequencies. Genetics, 164: 1567–1587.
- González-Herrera L., Vega-Navarrete L., Roche-Canto C., Canto-Herrera J., Virgen-Ponce D., Moscoso-Caloca G. and Cerda-Flores R.M. (2010) Forensic parameters and genetic variation of 15 autosomal STR loci in Mexican Mestizo populations from the states of Yucatan and Nayarit. Forensic Science Journal, 3: 57–63.
- Gorostiza A., González-Martín A., Ramírez C.L., Sánchez C., Barrot C., Ortega M., Huguet E., Corbella J. and Gené M. (2007) Allele frequencies of the 15 AmpF/Str Identifiler loci in the population of Metztitlán (Estado de Hidalgo), México. Forensic Science International, 166: 230–322.
- Green L.D., Derr J.N. and Knight A. (2000) mtDNA Affinities of the peoples of North–Central Mexico. American Journal of Human Genetics, 66: 989–998.
- Jakobsson M. and Rosenberg N.A. (2007) CLUMPP: a cluster matching and permutation program for dealing with label switching and multimodality in analysis of population structure. Bioinformatics, 23: 1801–1806.
- Kraaijenbrink T., van der Gaag K.J., Zuniga S.B., Xue Y., Carvalho-Silva D.R., Tyler-Smith C., Jobling M.A., Parkin E.J., Su B., Shi H., Xiao C.J., Tang W.R., Kashyap V.K., Trivedi R., Sitalaximi T., Banerjee J., Gaselô K.T., Tuladhar N.M., Opgenort J.R., van Driem G.L., Barbujani G. and de Knijff P. (2014) A linguistically informed autosomal STR survey of human populations residing in the greater Himalayan region. PLoS ONE, 9(3): e91534.
- Landers J.G. (2006) Cimarrón and citizen: African ethnicity, corporate identity, and the evolution of free black towns in the Spanish circum-Caribbean. In: Lander J.G. and Robinson B.M. (eds.), Slaves, Subjects, and Subversives: Blacks in Colonial Latin America. University of New Mexico Press, Albuquerque, pp. 111–145.
- Laurencio J.B. and Pasquel L. (1974) Campaña contra Yanga en 1608. Colección Suma veracruzana. Veracruz (in Spanish).
- Licea-Cadena R.A., Rizzo-Juarez R.A., Muñiz-lozano E., Páez-Riberos L.A. and Rangel-Villalobos H. (2006) Population data of nine STRs of Mexican-mestizos from Veracruz (Central South-Eastern, Mexico). Legal Medicine, 8: 251–252.
- Lisker R. (1981) Estructura genética de la población Mexicana: Aspectos médicos y antropológicos. Salvat Mexicana de Ediciones. México City (in Spanish).
- Lisker R. and Babinsky V. (1986) Admixture estimates in nine Mexican Indian groups and five east coast localities. Revista de Investigaciones Clínicas, 38: 145–149.
- Lisker R., Ramírez E. and Babinsky V. (1996) Genetic structure of autochthonous populations of Meso-America: Mexico. Human Biology, 68: 395–404.
- Lovejoy P.E. (1982) The volume of the Atlantic slave trade: a synthesis. Journal of African History, 23: 473–501.
- Luna-Vázquez A., Vilchis-Dorantes G., Aguilar-Ruiz M.O., Bautista-Rivas A., Rojo-Nava A.L., Rios-Barrios E. and Rangel-Villalobos H. (2005) Population data for 15 loci (Identifiler ® Kit) in a sample from the Valley of Mexico. Legal Medicine, 7: 331–333.
- Martínez-González L.J., Martínez-Espín E.M., Fernández-Rosado F., Moguel M.A., Entrala C., Álvarez J.C., Lorente J.A. and Budowle B. (2005) Mexican population data on fifteen STR loci (Identifiler® kit) in a Chihuahua (North Central Mexico) sample. Journal of Forensic Science, 50: 236–238.
- McNamara T. (2012) Theorizing social identity; what do we mean by social identity? Competing frameworks, competing discourses. TESOL Quarterly, 31: 561–567.
- Memoria Política de México. 2014. http://www.inep.org
- Menegus M. (2006) Los indios en la historia de México, siglos XVI al XIX: Balance y perspectivas. CIDE-FCE, México (in Spanish).
- O’Rourke D.H. and Raff J.A. (2010) The human genetic history of the Americas: the final frontier. Current Biology, 20(4): R202– R207.
- Pérez Monfort R. (2007) El ‘negro’ y la negritud en la formación del estereotipo del jarocho durante los siglos XIX y XX. In: Pérez Monfort R. (ed.), Expresiones populares y estereotipos culturales en México, siglos XIX y XX: diez ensayos. Centro de Investigaciones y Estudios Superiores en Antropología Social, México, pp. 175–210 (in Spanish).
- Rangel-Villalobos H., Muñoz-Valle J.F., González-Martín A., Gorostiza A., Magaña M.T. and Páez-Riberos L.A. (2008) Genetic admixture, relatedness and structure patterns among Mexican populations revealed by the Y-chromosome. American Journal of Physical Anthropology, 135: 448–461.
- Rangel-Villalobos H., Rubi-Castellanos R., Morales-Vallejo M.E., Molina-Araujo V., Licea-Cadena R.A., Rizzo-Juarez S., Muñiz-Lozano F.E., Nuño-Arana I. and Muñoz-Valle J.F. (2010) Admixture estimates and statistical parameters of forensic importance based on PowerPlex® 16 system in Mexican-Mestizos from the States of Guanajuato (Center) and Veracruz (East). Forensic Science International Genetics, 4: 271–272.
- Rinaudo C. (2011) Más allá de la identidad negra: mestizaje y dinámicas raciales en la ciudad de Veracruz. In: Cunin E. (ed.), Mestizaje y diferencia. Lo negro en América Central y el Caribe. Instituto Nacional de Antropología e Historia. Centro de Estudios Mexicanos y Centroamericanos. Universidad Nacional Autónoma de México. Institut de Recherche pour le Développement, México, pp. 226–266 (in Spanish).
- Rosenberg N.A. (2004) DISTRUCT: a program for the graphical display of population structure. Molecular Ecology Notes, 4: 137–138.
- Rubi-Castellanos R., Anaya-Palafox M., Mena-Rojas E., Bautista-España D., Muñoz-Valle J.F. and Rangel-Villalobos H. (2009) Genetic data of 15 autosomal STRs (Identifiler kit) of three Mexican Mestizo population samples from the states of Yucatan (Southeast), Jalisco (West), and Puebla (Center). Forensic Science International Genetics, 3: e71–e73.
- Salas A., Richards M., Lareu M.V., Scozzari R., Coppa A., Torroni A., Macaulay V. and Carracedo A. (2004) The African diaspora: mitochondrial DNA and the Atlantic slave trade. American Journal of Human Genetics, 74: 454–465.
- Sánchez C., Barrot C., Ortega M., González-Martin A., Gorostiza A., Corbella J., Huguet E. and Gené M. (2005) Genetic diversity of 15 STRs in Choles from northeast of Chiapas (Mexico). Journal of Forensic Science, 50: 1499–1501.
- Sanz P., Prieto V., Flores I., Torres Y., Lopez-Soto M. and Farfan M.J. (2001) Population data of 13 STRS in southern Spain (Andalusia). Forensic Science International. 119: 113–115.
- Schurtz W.L., Cabrera L. and Armengol P.O. (1992) El Galeón de Manila. Ediciones de Cultura Hispánica, Madrid (in Spanish).
- Serrano C. 1993. Bioantropología de la población Mexicana. In: Arizpe L. (ed.), Antropología breve en México. Academia de la Investigación Científica. Centro Regional de Investigaciones Multidisciplinarias. UNAM, Mexico, pp. 147–164 (in Spanish).
- Silva-Zolezzi I., Hidalgo-Miranda A., Estrada-Gil J., Fernandez-Lopez J.C., Uribe-Figueroa L., Contreras A., Balam-Ortiz E., del Bosque-Plata L., Velazquez-Fernandez D., Lara C., Goya R., Hernandez-Lemus E., Davila C., Barrientos E., March S. and Jimenez-Sanchez G. (2009) Analysis of genomic diversity in Mexican Mestizo populations to develop genomic medicine in Mexico. Proceedings of the National Academy of Science, USA, 106: 8611–8616.
- Sturrock K. and Rocha J. (2000) A multidimensional scaling stress evaluation table. Field Methods, 12: 49–60.
- Sudarkasa N. (1980) African and Afro-American family structure: a comparison. The Black Scholar, 11: 37–60.
- Tamm E., Kivisild T., Reidla M., Metspalu M., Smith D.G., Mulligan C.J., Bravi C.M., Rickards O., Martinez-Labarga C., Khusnutdinova E.K., Fedorova S.A., Golubenko M.V., Stepanov V.A., Gubina M.A., Zhadanov S.I., Ossipova L.P., Damba L., Voevoda M.I., Dipierri J.E., Villems R. and Malhi R.S. (2007) Beringian standstill and spread of Native American founders. PLoS ONE, 2: e829.
- Vinson B. and Restall M. (2009) Black Mexico: Race and Society from Colonial to Modern Times. University of New Mexico Press, Albuquerque.
- Wang S., Ray N., Rojas W., Parra M.V., Bedoya G., Gallo C., Poletti G., Mazzotti G., Hill K., Hurtado A.M., Camarena B., Nicolini H., Klitz W., Barrantes R., Molina J.A., Freimer N.B., Bortolini M.C., Salzano F.M., Petzl-Erler M.L., Tsuneto L.T., Dipierri J.E., Alfaro E.L., Bailliet G., Bianchi N.O., Llop E., Rothhammer F., Excoffier L. and Ruiz-Linares A. (2008) Geographic patterns of genome admixture in Latin American Mestizos. PLoS Genetics, 4: e1000037.