Original Articles
The diet of townspeople in the city of Edo: carbon and nitrogen stable isotope analyses of human skeletons from the Ikenohata-Shichikencho site
2016 Volume 124 Issue 1 Pages 17-27

Details
2016 Volume 124 Issue 1 Pages 17-27
Individual dietary differences (e.g. sex, age, period, and region) among townspeople during the Edo period are unclear, although the historical literature describes the general dietary menu. We applied carbon and nitrogen stable isotope analyses to 103 adult human skeletons excavated from the Ikenohata-Shichikencho site of the Edo period (late 17th to late 19th century AD) in Japan to investigate individual dietary differences among townspeople in the city of Edo. The mean carbon and nitrogen isotope ratios of Ikenohata townspeople were −19.7 ± 0.4‰ and 10.8 ± 0.7‰, respectively, which suggests that C3-based terrestrial foods, freshwater fish, and marine fish were their main dietary protein sources. Intra-population comparisons indicated no significant difference among individuals of different sexes, age categories, and chronological periods, with the exception of a sex difference in carbon isotope ratios (0.37‰) during the Middle–Late period (last half of 18th century). Comparison of the Ikenohata data with the results of previous studies revealed significant isotopic differences in skeletal populations of the same social class (up to 1.33‰ for nitrogen) and same Edo city (up to 1.64‰ for nitrogen). Although these differences were relatively small in terms of stable isotope ecology, dietary food sources for people during the Edo period would differ to some extent by their social class and geographic region of residence.
Traditional Japanese food culture (washoku) was established during the Edo period, which spanned from 1603 to 1867 AD under the governance of the Tokugawa shogunate (Watanabe, 1964; Ehara et al., 2009). Several cooking methods, varied food materials and cuisines, and food commerce have been described in several historical studies (Watanabe, 1964; Ehara et al., 2009). Detailed descriptions of dietary menus are available, particularly for banquets, in the diaries and official documents of the feudal lords (shogun), warriors, rich farmers, and merchants (Shimamura, 1972; Masuda and Ehara, 2005; Ehara et al., 2009; Harada, 2009). However, individual dietary differences (e.g. sex, age, period, and region) have been studied little in history and archeology because of methodological limitations. Careful excavations provide a wealth of information of discarded food materials and garbage (e.g. Vaporis, 1998), but consumption of these foods at the individual level is still unclear. Furthermore, historical descriptions of diet of ordinary people in the Edo period are sometimes differ from their actual diet (Arizono, 1996).
Carbon and nitrogen stable isotope analysis is one of the most useful methods for investigating palaeodiet. The relative abundance of heavier isotopes is referred to as the isotope ratio, and it is generally expressed in terms of δ values. Isotope ratios are expressed as parts per thousand (‰), a deviation from ratios of international standard materials. The carbon isotope ratio (δ13C value) of organic matter differs between C3 and C4 ecosystems because of the difference in the photosynthetic pathways of C3 and C4 plants; δ13C values are higher in C4 plants (O’Leary, 1988). Furthermore, δ13C values of organisms from marine ecosystems usually range between those of organisms from C3 and C4 ecosystems (Schoeninger and DeNiro, 1984; Peterson and Fry, 1987). The nitrogen isotope ratio increases with the trophic level; δ15N values are higher in carnivores than in herbivores (Minagawa and Wada, 1984; Schoeninger and DeNiro, 1984). Nitrogen isotope ratios of marine organisms are usually higher than those of terrestrial organisms because of the longer trophic food chains in marine ecosystems (Minagawa and Wada, 1984; Lee-Thorp, 2008). Measurement and comparison of carbon and nitrogen stable isotope ratios of humans and food sources enables estimation of the relative proportion of consumed foods at an individual level.
Although there are several isotopic studies of human skeletons from the Edo period, they are not sufficient for investigating individual dietary differences among townspeople. Tsutaya et al. (2014) measured isotope ratios of 46 adult individuals from the Hitotsubashi site of the early Edo period (1657–1683 AD), which represent townspeople in the city of Edo (the former name of Tokyo). They reported that δ15N values of adult females were significantly lower than those of adult males, and there was no significant isotopic difference by age category for both sexes (Tsutaya et al., 2014). These researchers investigated individual differences in isotope ratios, but the human skeletons corresponded only to the earlier Edo period. Kusaka et al. (2011) analyzed carbon and nitrogen isotope ratios of 21 adult individuals from the Fushimi Castle Site, which represent townspeople of the city of Kyoto during the entire Edo period (early 17th century to early 20th century AD). Carbon isotope ratios of adult females were significantly lower than those of adult males in the Fushimi site (Kusaka et al., 2011). While Kusaka et al. compared isotope ratios by age and period, the number of individuals was relatively small. Other previous isotopic studies have targeted social classes other than townspeople, and their results help in understanding the variation in diets among different populations during the Edo period rather than individual dietary differences (Table 1).
| Site | Main buried people | Location | Period | δ13C | δ15N | n | Reference |
|---|---|---|---|---|---|---|---|
| Anrakuji-Higashi | — | Yamanashi | 19th century–Meiji period | −18.3 ± 0.2 | 10.2 ± 0.7 | 5 | Yoneda, 2000 |
| Fushimi | Townspeople | Kyoto | Early 17th–middle 19th century | −19.7 ± 0.6 | 12.1 ± 0.6 | 27 | Kusaka et al., 2011 |
| Hitotsubashi | Townspeople | Tokyo | 1657–1683 AD | −19.4 ± 0.5 | 11.0 ± 0.8 | 47 | Tsutaya et al., 2014 |
| Kaneiji | Hatamoto (middle class warrior) | Tokyo | 1709 AD–late 19th century | −20.2 ± 0.7 | 12.3 ± 1.3 | 19 | Koike et al., 1990 |
| Kaneiji | Shogun (Tokugawa family) | Tokyo | 1726 AD–1850 AD | −18.3 ± 0.6 | 12.4 ± 0.9 | 11 | Yoneda, 2012 |
| Kamiizawa-one and Hodokubo | — | Nagano | Early Edo period | −17.7 ± 0.9 | 12.1 ± 1.5 | 5 | Yoneda et al., 1996 |
| Unseiji | Karo (high class warrior) | Hyogo | 1732 AD | −19.8 | 13.9 | 1 | Nagaoka et al., 2013 |
| Uozu | — | Toyama | 1657–1681 calAD or 1733–1807 calAD | −20.1 | 12.8 | 1 | Kaifu and Yoneda, 1999 |
| Ikenohata | Townspeople | Tokyo | Late 17th–late 19th century | −19.7 ± 0.4 | 10.8 ± 0.7 | 102 | This study |
The present study investigates individual dietary differences among townspeople during the Edo period. Specifically, we compare isotope ratios among townspeople according to sex, age, and chronological period. In addition, we compare our findings with those of previous studies to investigate dietary differences according to the social class and geographic region.
The Ikenohata-Shichikencho site (hereafter referred to as the Ikenohata site: Figure 1) is a graveyard of the Keianji temple in the city of Edo, an urban capital of premodern Japan (Omata et al., 1997). The excavation was undertaken during 1993 and 1995 and includes at least 672 burials and 640 human skeletons assumed to belong to the period from the late 17th to late 19th century AD (Mizoguchi, 1997; Omata et al., 1997). Among human burials, wooden and ceramic coffins constitute 468 (69.6%) and 50 (7.4%), respectively (Omata et al., 1997). Because wooden and ceramic coffins were usually used for townspeople and warriors, respectively, during the Edo period (Tanigawa, 1992), most burials in the Ikenohata site represent townspeople. Characteristic names of merchants and warriors also appear on some grave markers (sotoba) (Omata et al., 1997). The Ikenohata site is located in the lowland swamp, and thus organic remains are very well preserved (Omata et al., 1997). These burials have been classified into four chronological periods (i.e. late 17th to early 18th, first half of 18th, last half of 18th, and late 18th to late 19th century AD) according to the information from burial goods, excavation layers, and type of associated ceramics (Omata et al., 1997).

Location of Ikenohata and the other Edo archeological sites mentioned in the study.
Nagaoka (2007) estimated the age and sex of adult human skeletons from the Ikenohata site to reconstruct their demographic structure. A strong sex bias was observed, as females and males constituted 39.9% and 60.1% of the 391 adult individuals analyzed, respectively (Nagaoka, 2007), which is a probable result of the presence of migrant workers from the surrounding rural regions (Minami, 1978). Although the age-at-death distribution of the Ikenohata population is younger than that of the aggregated townspeople skeletons (Kobayashi, 1967) and rural population reconstructed from historical census documents (Kobayashi, 1956) during the Edo period, this could be an artifact of the age estimation method by Lovejoy et al. (1985), as the author has noted (Nagaoka, 2007). Furthermore, human skeletons from the Ikenohata site have been used in various studies of physical anthropology as representative of townspeople during the Edo period because of their large number and good preservation (Ohsako, 2000; Nagaoka and Hirata, 2005; Kawakubo, 2007; Sakaue, 2007, 2012; Kawakubo et al., 2009; Hayashi et al., 2012; Nagaoka et al., 2012b). However, the primary concerns of these studies were not Ikenohata individuals, and datasets from Ikenohata have been used only for comparative purposes.
Carbon and nitrogen stable isotope ratios (Yoneda, 2012) and lead concentration (Yoneda et al., 2012) of Ikenohata skeletons have been reported but presented only graphically as comparative datasets to discuss dietary habits and possible lead exposures in family members of the Tokugawa Shogun, respectively. Yoneda (2012) reported stable carbon and nitrogen isotope ratios of only 13 individuals from the Ikenohata site and did not discuss the diet of townspeople. Bone elements were newly sampled, treated, and measured in this study, and we did not use previous data from Yoneda (2012).
Bone samplesIsotope analysis was performed on 103 adult human skeletons from the Ikenohata site. These skeletons are housed at the Department of Anthropology, National Museum of Science and Nature (Tsukuba, Japan). Most of these skeletons were individually buried in coffins and could be easily identified as single individuals without mixing with the remains of other individuals. The bone samples are listed in Table A1.
The sex of adults was estimated by the morphology of the pelvis and skull (Ferembach et al., 1980; Bruzek, 2002). The age at death for adults was newly estimated using a Bayesian method proposed by Buckberry and Chamberlain (2002), although the method used by Lovejoy et al. (1985) was originally adopted in Nagaoka (2007). However, the latter method tends to underestimate elderly adults (Mulhern and Jones, 2005; Falys et al., 2006; Nagaoka and Hirata, 2008). In the Bayesian method, modern Japanese skeletons (n = 177) described in Nagaoka et al. (2012a) were used as the reference population with uniform prior. Adult ages were classified into three categories (i.e. 15–34, 35–54, and ≥55 years). Four chronological periods of skeletons emerged from the excavation report (Omata et al., 1997) and were assigned into the following four sub-periods for descriptive purposes in this study: Early (late 17th to early 18th), Middle (first half of 18th), Middle–Late (last half of 18th), and Late (late 18th to late 19th century AD).
Stable isotope analysisA modified Longin method was used to extract collagen (Longin, 1971; Yoneda et al., 2004) at the Laboratory of Isotope Ecology, the University of Tokyo. Bone samples were obtained from the ribs. After the surfaces were cleaned by sandblasting, bone pieces of 10–500 μg were soaked in 0.2 M NaOH to remove exogenous organic matter. Bone chunks were rinsed with pure water, freeze-dried, and decalcified with 0.5 M HCl at 4°C for a few days. The decalcified samples were rinsed and soaked with pure water at 4°C to replace HCl with pure water and then gelatinized in a weak HCl solution (pH 4.5) at 80°C for >24 h. Gelatinized samples were filtered using a glass fiber filter (Wattmann GF/F), and resultant collagens were freeze-dried.
Extracted collagen samples were measured at least in duplicate using elemental analysis–isotope ratio mass spectrometry (EA-IRMS) (Thermo Flash 2000 elemental analyzer, Finnigan ConFlo III interface, and Thermo Delta V mass spectrometer) at the Laboratory of Isotope Ecology, the University of Tokyo. Elemental concentrations and isotope ratios of carbon and nitrogen were calibrated using laboratory alanine standards. The analytical standard deviation (SD) was estimated at approximately 0.1‰ for δ13C values and <0.2‰ for δ15N values, which were calculated on the basis of the alanine standards.
StatisticsAll statistical analyses were performed with software R version 3.2.0 (R Core Team, 2015). The distribution of carbon and nitrogen isotope ratios was depicted with standard ellipses using the functions of Stable Isotope Bayesian Ellipses in R (SIBER) in the R package siar, version 4.2 (Parnell et al., 2010; Jackson et al., 2011). SIBER describes isotopic data as ellipses calculated by a covariance matrix that defines their shapes and sizes; means of δ13C and δ15N values define their locations (Jackson et al., 2011).
Preservation of collagen was evaluated by the atomic C/N ratio and yield of extracted gelatin. All samples indicated acceptable C/N ratios (i.e. 2.9–3.6: DeNiro, 1985) and yields (i.e. >1%: van Klinken, 1999).
One male individual (i51) showed severe pathology and osteophytosis in his left femur (Mizoguchi, 1997); thus, data from this individual were excluded from the dataset and indicated only in figures. Although a sample was taken from a rib without apparent pathologies, this individual showed the highest δ15N value and the second highest δ13C value in the Ikenohata population (Figure 2). This is likely to be a result of a pathology-influenced change in isotope ratios (Reitsema, 2013).
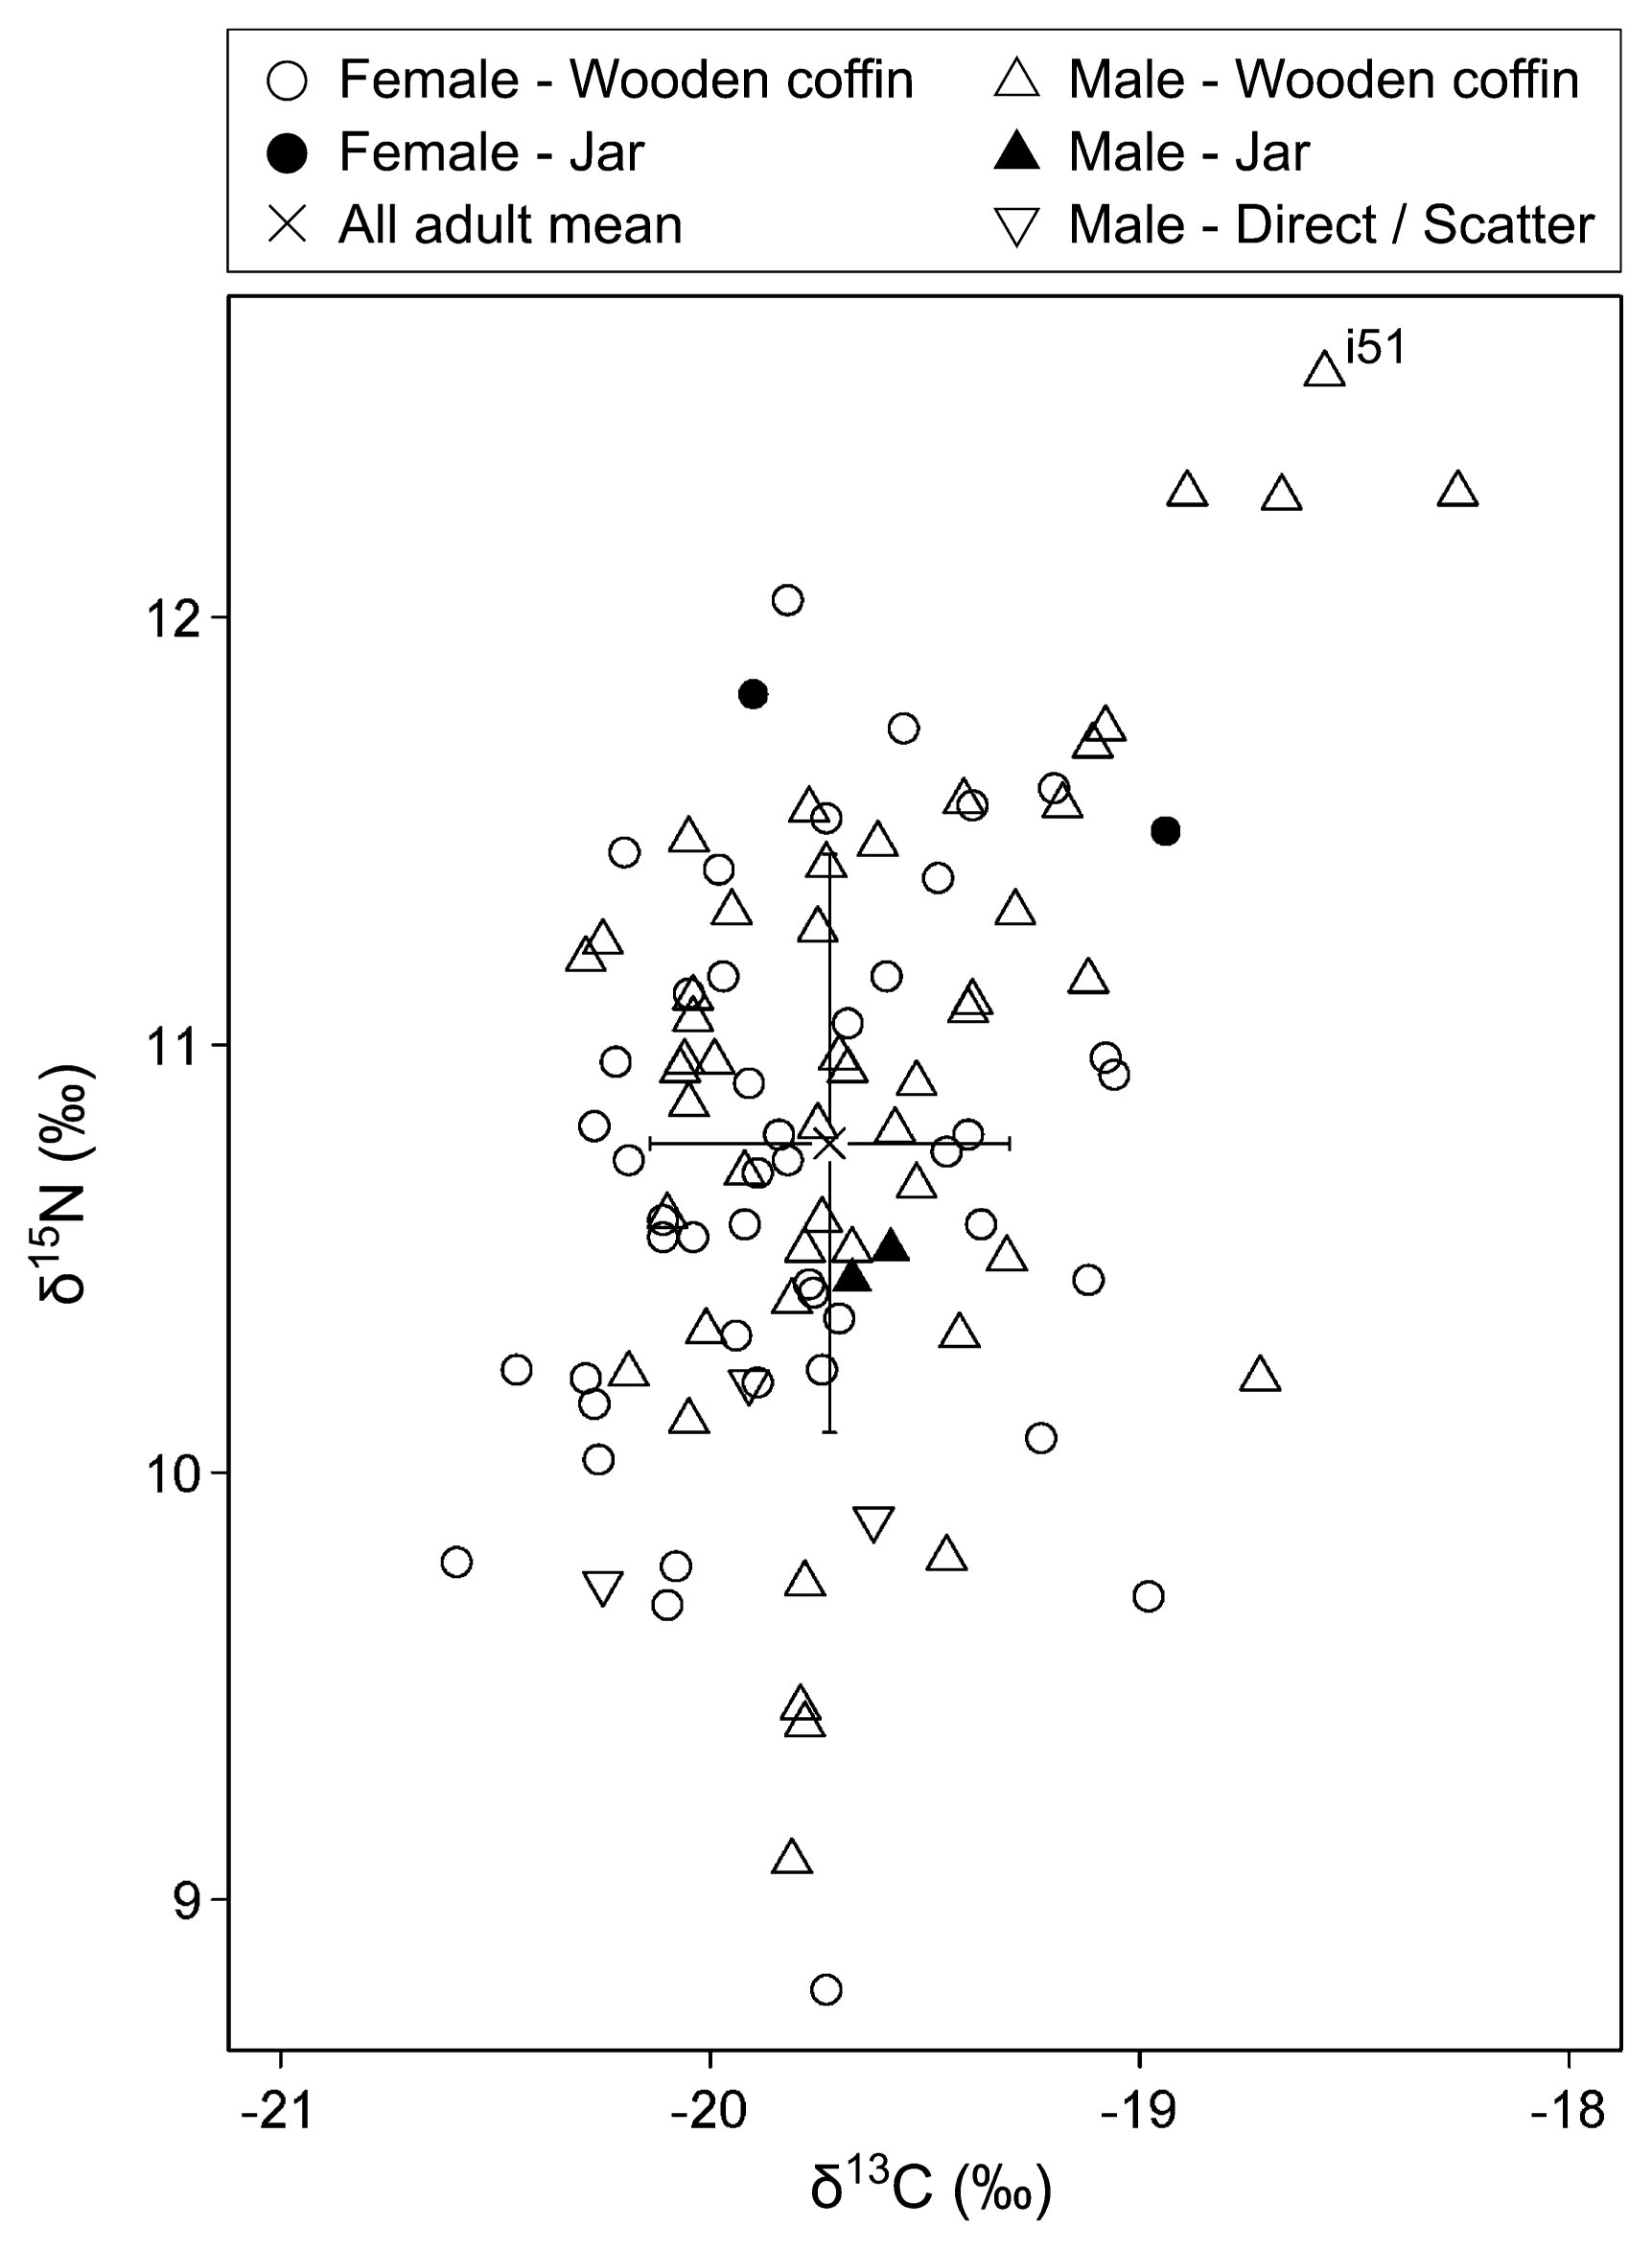
Carbon and nitrogen isotope ratios for adult human bone collagen from the Ikenohata site. Mean δ13C and δ15N values are also indicated. Individuals buried in round or rectangle wooden coffins are shown with ‘Wooden coffin.’
Overall, the isotope ratios of Ikenohata adults ranged from −20.6‰ to −18.3‰ for carbon and from 8.8‰ to 12.3‰ for nitrogen. Isotope ratios are shown in Figure 2 and summarized in Table 2. Plotting the isotope ratios of past and modern Japanese foods (Yoneda et al., 2004) with an offset from dietary protein to collagen of 5‰ for δ13C and 4‰ for δ15N (Lee-Thorp, 2008) indicated C3-based terrestrial foods, freshwater fish, and marine fish to be their primary protein sources (Figure 3). However, this comparison is only a reference because the food analyzed in the previous study (Yoneda et al., 2004) was obtained from different ecosystems and periods compared with those in case of Edo townspeople.
| δ13C | δ15N | n | ||||
|---|---|---|---|---|---|---|
| Mean | SD | Mean | SD | |||
| Adult | Female | −19.8 | 0.4 | 10.7 | 0.7 | 47 |
| Male | −19.7 | 0.4 | 10.8 | 0.7 | 55 | |
| All | −19.7 | 0.4 | 10.8 | 0.7 | 102 | |
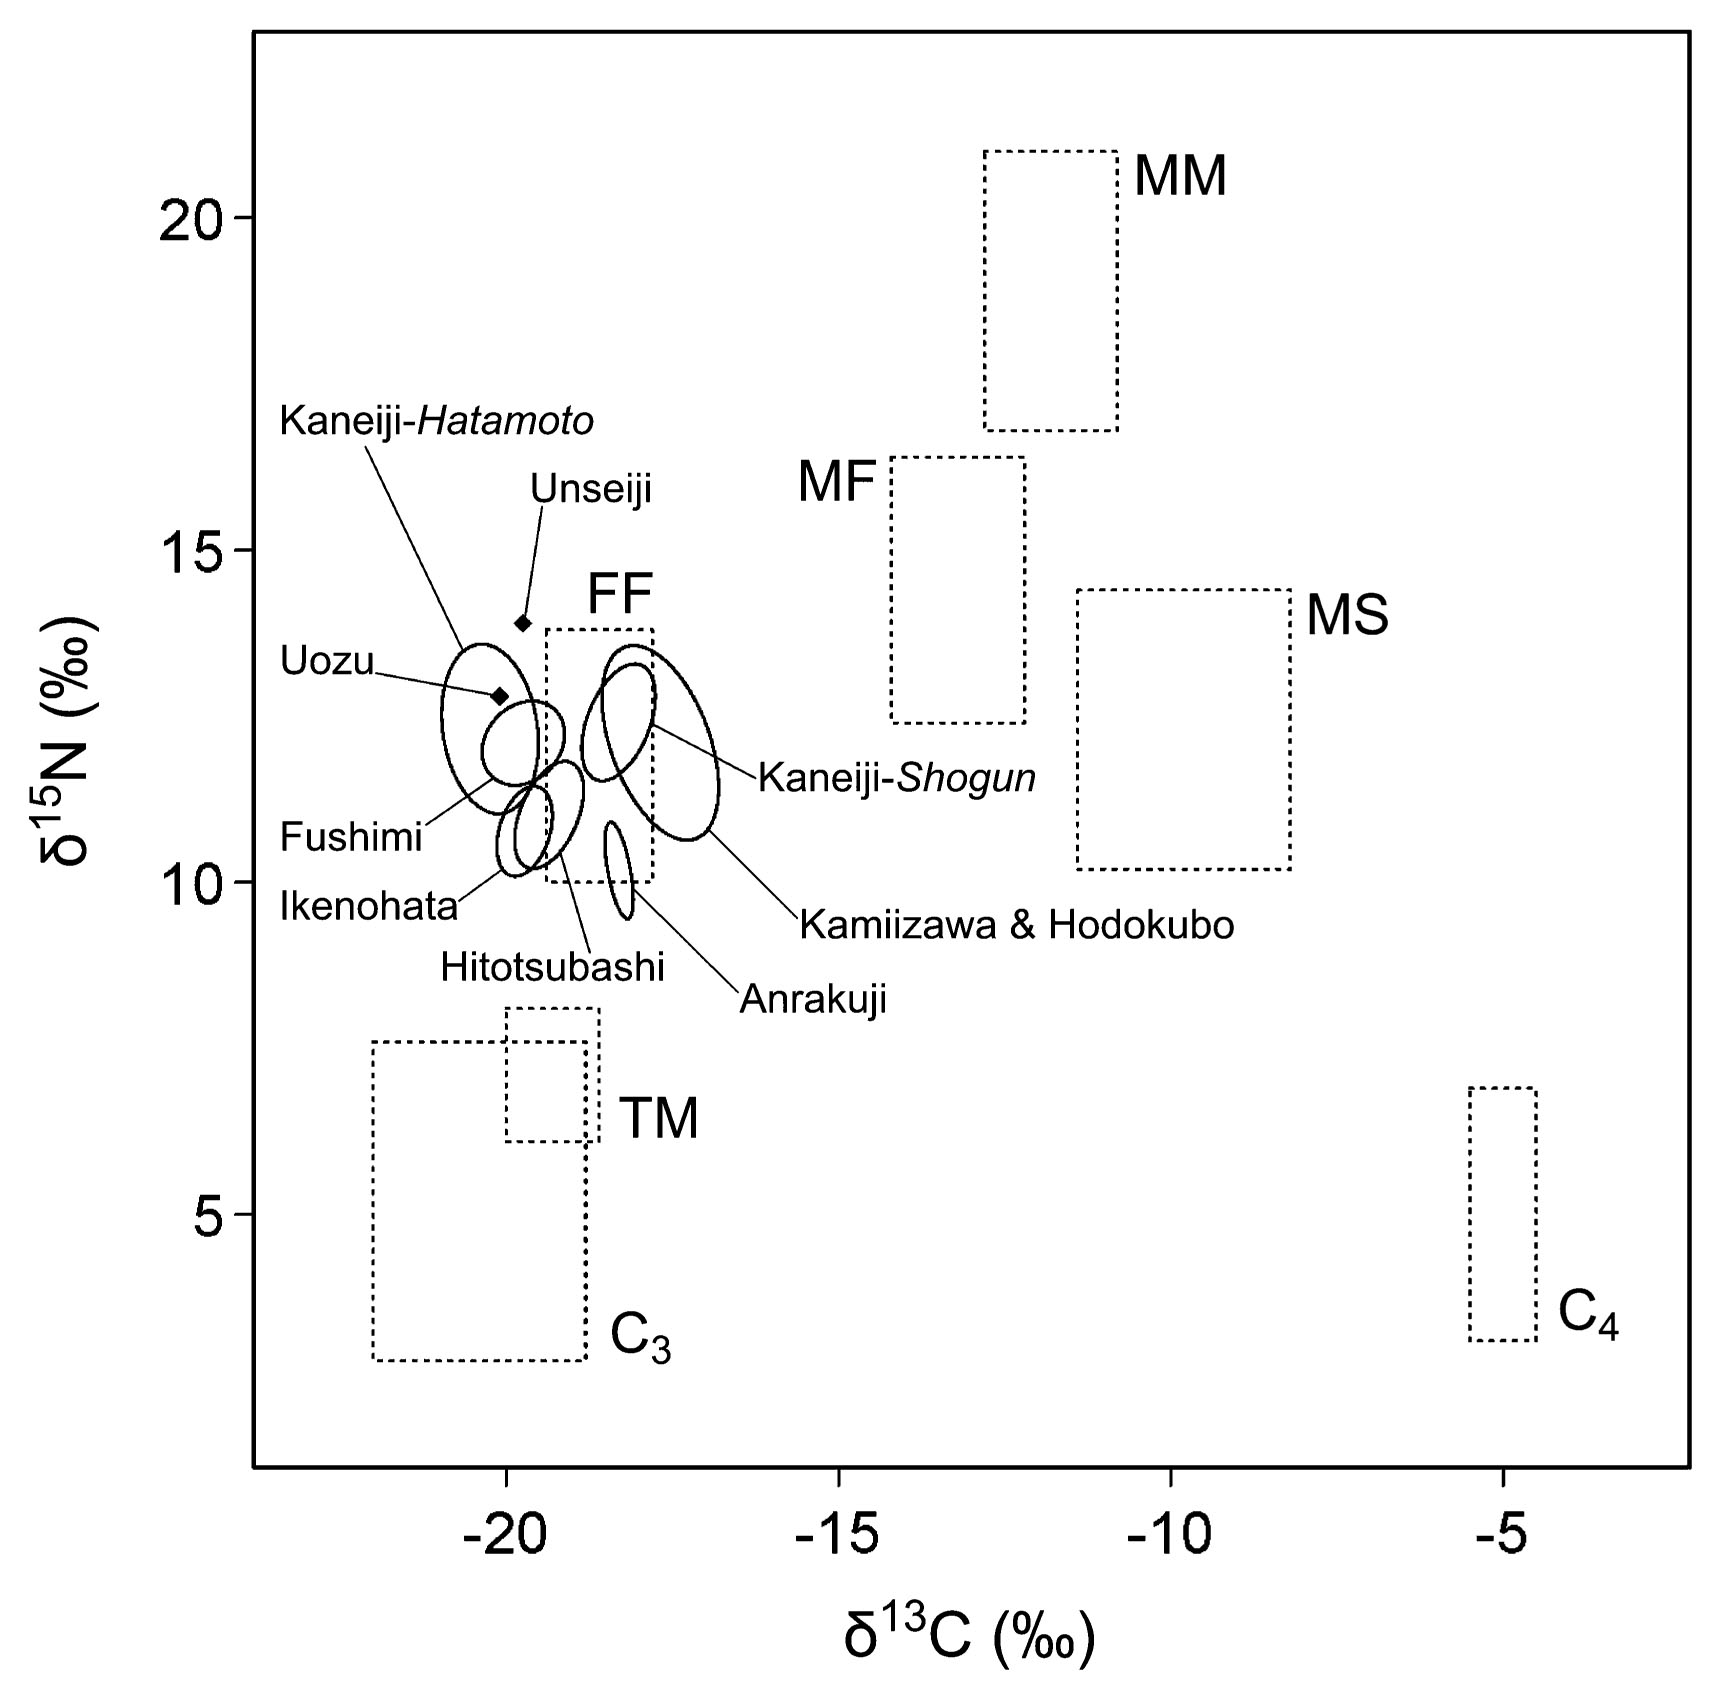
Standard ellipses of δ13C and δ15N values of Edo period populations. Standard ellipses were drawn on the basis of maximum likelihood estimators and included approximately 40% of the data regardless of the sample size (Jackson et al., 2011). Data from Uozu and Unseiji are shown as a single point. See Table 1 for reference datasets, except for Ikenohata (obtained in this study). The mean and 1SD ranges of isotope ratios of Japanese foods (Yoneda et al., 2004) with fixed spacing are also shown as dotted squares; C3, C3 plants; C4, C3 plants; FF, freshwater fish; MF, marine fish; MM, marine mammals; MS, marine shellfish; TM, terrestrial mammals.
Carbon and nitrogen isotope ratios by sex and age are summarized in Table 3 and shown in Figure 4. Mann–Whitney U tests indicated no significant difference by sex among the three age categories of the Ikenohata population for δ13C (15–34 years: U = 162.5, P = 0.151; 35–54 years: U = 138.0, P = 0.323; ≥55 years: U = 8.0, P = 0.758) and δ15N (15–34 years: U = 180.0, P = 0.320; 35–54 years: U = 178.0, P = 0.843; ≥55 years: U = 14.0, P = 0.485). Kruskal–Wallis tests indicate no significant difference among the three age categories in both sexes for δ13C (female: χ2 = 1.71, P = 0.425; male: χ2 = 2.56, P = 0.278) and δ15N (female: χ2 = 2.23, P = 0.327; male: χ2 = 1.76, P = 0.415).
| Age (years) | Sex | δ13C | δ15N | n | ||
|---|---|---|---|---|---|---|
| Mean | SD | Mean | SD | |||
| 15–34 | F | −19.9 | 0.4 | 10.6 | 0.5 | 22 |
| M | −19.7 | 0.4 | 10.8 | 0.7 | 20 | |
| 35–54 | F | −19.7 | 0.5 | 10.7 | 0.6 | 18 |
| M | −19.5 | 0.5 | 10.7 | 0.8 | 19 | |
| ≥55 | F | −19.9 | 0.0 | 11.3 | 0.7 | 2 |
| M | −19.8 | 0.3 | 10.9 | 0.4 | 10 | |

Boxplots for (A) δ13C and (B) δ15N values of Ikenohata adults by age categories. Empty and shaded boxes indicate females and males, respectively. Numbers above boxes indicate the sample size.
Isotope ratios by sex and chronological periods are summarized in Table 4 and shown in Figure 5. Mann–Whitney U tests indicated no significant difference by sex among the four chronological periods of the Ikenohata population for δ15N (Early: U = 60.0, P = 0.740; Middle: U = 73.5, P = 0.069; Middle–Late: U = 69.0, P = 0.575; Late: U = 83.0, P = 0.895). Mann–Whitney U tests also indicated no significant difference by sex for δ13C among the four chronological periods except for Middle–Late (Early: U = 67.5, P = 0.951; Middle: U = 119.0, P = 0.984; Middle-Late: U = 27.0, P = 0.029; Late: U = 66.0, P = 0.477). Kruskal–Wallis tests indicated no significant difference among the four periods in both sexes for δ13C (female: χ2 = 5.40, P = 0.145; male: χ2 = 0.48, P = 0.922) and in females for δ15N (χ2 = 3.71, P = 0.295). Although the Kruskal–Wallis test indicated a significant difference among male individuals for δ15N (χ2 = 9.32, P = 0.025), post-hoc Mann–Whitney U tests with the Bonferroni correction of P value did not detect a significant difference among the four periods. In this post-hoc test, the P value was adjusted to 0.0083 (= 0.05/6: Bland and Altman, 1995).
| Period | Sex | δ13C | δ15N | n | ||
|---|---|---|---|---|---|---|
| Mean | SD | Mean | SD | |||
| Early | F | −19.7 | 0.3 | 10.4 | 0.7 | 12 |
| M | −19.6 | 0.4 | 10.4 | 0.7 | 11 | |
| Middle | F | −19.7 | 0.5 | 10.7 | 0.6 | 15 |
| M | −19.7 | 0.5 | 11.1 | 0.7 | 16 | |
| Middle–Late | F | −20.0 | 0.4 | 10.8 | 0.7 | 10 |
| M | −19.7 | 0.4 | 10.6 | 0.8 | 12 | |
| Late | F | −19.8 | 0.3 | 11.0 | 0.5 | 10 |
| M | −19.7 | 0.4 | 11.0 | 0.5 | 16 | |

Boxplots for (A) δ13C and (B) δ15N values of Ikenohata adults by chronological period. Empty and shaded boxes indicate females and males, respectively. Numbers above boxes indicate the sample size.
In Ikenohata adults, there was no clear relationship between isotope ratios and type of burial (Figure 2), although statistical tests were not applied because of the smaller number of individuals. Because the type of burials usually relates with difference in social status of buried people (Tanigawa, 1992), this result implies that there is no clear isotopic difference among people in different social status. This result resembles that reported for the Hitotsubashi population (Tsutaya et al., 2014).
Inter-population differencesCarbon and nitrogen isotope ratios of several Edo period populations are summarized in Table 1 and shown in Figure 3. Significant differences in isotope ratios can be found among several Edo period populations either from the same social class (i.e. townspeople) or from the same city (i.e. Edo). Kruskal–Wallis tests indicated a significant difference among populations of townspeople (Ikenohata, Fushimi, and Hitotsubashi) for δ13C (χ2 = 20.88, P < 0.001) and δ15N (χ2 = 48.21, P < 0.001). Kruskal–Wallis tests also indicate a significant difference among populations in the city of Edo (Ikenohata, Kaneiji-shogun, Kaneiji-hatamoto, and Hitotsubashi) for δ13C (χ2 = 54.73, P < 0.001) and δ15N (χ2 = 46.10, P < 0.001). The results of post-hoc Mann–Whitney U tests are summarized in Table 5. Corrected P values of 0.01667 (= 0.05/3) and 0.0083 (= 0.05/6) according to the Bonferroni method were used to compare townspeople and Edo populations, respectively (Bland and Altman, 1995). Overall, skeletal populations from different social classes presented distinct isotope ratios even if they came from the same city, and populations of townspeople from different sites or regions also showed different isotope ratios, although the differences were relatively small in terms of isotope ecology.
| δ13C | Fushimi | Kaneiji-hatamoto | Kaneiji-shogun | Hitotsubashi | ||||
|---|---|---|---|---|---|---|---|---|
| U | P | U | P | U | P | U | P | |
| Ikenohata | 1395 | 0.9193 | 1360.5 | 0.0053 * | 31 | <0.0001 * | 1260 | <0.0001 * |
| Fushimi | 352.5 | 0.0328 | 12.5 | <0.0001 * | 359.5 | 0.0028 * | ||
| Kaneiji-hatamoto | 2 | <0.0001 * | 118 | <0.0001 * | ||||
| Kaneiji-shogun | 465 | <0.0001 * | ||||||
| δ15N | Fushimi | Kaneiji-hatamoto | Kaneiji-shogun | Hitotsubashi | ||||
|---|---|---|---|---|---|---|---|---|
| U | P | U | P | U | P | U | P | |
| Ikenohata | 204 | <0.0001 * | 218.5 | <0.0001 * | 94.5 | <0.0001 * | 1849.5 | 0.0399 |
| Fushimi | 244.5 | 0.7969 | 105 | 0.1657 | 1060.5 | <0.0001 * | ||
| Kaneiji-hatamoto | 91.5 | 0.5899 | 711.5 | 0.0001 * | ||||
| Kaneiji-shogun | 434 | 0.0003 * | ||||||
Detected significant differences are indicated with an asterisk.
Historical literature has indicated that the diet of the townspeople during the Edo period comprised mostly rice and C3 vegetables; soybean products and fish were sometimes dietary supplements (Watanabe, 1964; Hanley, 1997; Ehara et al., 2009; Harada, 2009). Isotopic data obtained in this study suggest that dietary proteins of Ikenohata adults mainly came from C3-based terrestrial foods, freshwater fish, and marine fish (Figure 3), a diet consistent with historical evidence. However, it is important to analyze and compare faunal bones and plant remains excavated from the city of Edo to conduct rigorous dietary reconstructions. The faunal isotope ratios referred to in this study were obtained from different regions and periods of Japan (Yoneda et al., 2004) and do not match with actual Ikenohata dietary sources.
Intra-population differencesThe carbon and nitrogen isotope ratios of Ikenohata adults are characterized as small intrapopulation differences. Several statistical comparisons indicate a significant difference only between δ13C values of females and males during the Middle–Late period (Figure 4, Figure 5), although the difference is relatively small (0.37‰). Kusaka et al. (2011) showed that δ13C values of adult males were significantly higher (+0.8‰) than those of adult females among Fushimi townspeople during the Edo period, similar to the sex difference observed in Ikenohata during the Middle–Late period. Although Tsutaya et al. (2014) showed a significantly higher δ15N value for males (+0.7‰) than females in the Hitotsubashi population of Edo city during the earlier Edo period, such a difference was not observed for the Ikenohata population. However, these previous studies suffer from a partial dataset and a small number of individuals. The results of this study imply that there is only a minor sex difference, if any, in diet of Edo townspeople.
In the Ikenohata population, there was no significant difference in δ13C and δ15N values among the three age categories for both sexes (Figure 4). Similarly, no significant δ13C and δ15N differences have been found in the Edo townspeople (Tsutaya et al., 2014) and Kyoto townspeople (Kusaka et al., 2011) during the Edo period. Although some life events could have altered the behavior of people during the Edo period (e.g. marriage, childbirth, succession, and retirement), such events would not have affected their diet strongly.
In the Ikenohata population, no significant difference was found in the δ13C and δ15N values among the four chronological periods for both sexes (Figure 5). Kusaka et al. (2011) also reported no significant isotopic difference among Fushimi townspeople from different sub-periods. Historical studies have revealed some changes in food culture during the Edo period. Harada (1995, 2010) discussed how meat of terrestrial mammals was eaten less during the medieval to Edo period because of Buddhist discipline. Meat sellers in the city continued to decrease in number from the late 17th to early 18th century AD, were banished during most of the Edo period, and then reappeared after the 19th century AD (Harada, 1995, 2010). Furthermore, although most foods eaten by Edo-period Japanese had already appeared during the medieval period, food commerce developed further during this time. Many food sources (e.g. vegetables, fruits, seasoning, fishes, sweet potatoes, and sake rice wine) were produced in different Japanese regions, transported across the Japanese archipelago, and consumed during the Edo period (Watanabe, 1964; Ehara et al., 2009; Harada, 2009). Nevertheless, these changes could not be inferred from chronological trends in the δ13C and δ15N values of Ikehonata adults.
Inter-population differencesThere are significant isotopic differences among the three townspeople populations during the Edo period (Table 5). Differences between Ikenohata and Fushimi populations are attributable to differences in the ecosystems from which food sources originated in the cities of Edo and Kyoto. Although commerce networks developed across Japan during the Edo period, dairy staples in major cities were provided by surrounding rural areas (Ehara et al., 2009; Harada, 2009). Carbon and nitrogen isotope ratios of organisms from different ecosystems can differ according to several ecological factors, such as precipitation, temperature, flora, and fauna (Peterson and Fry, 1987; Amundson et al., 2003; Lee-Thorp, 2008). Because the distance between the cities of Edo and Kyoto is approximately 400 km, it is highly probable that their staple rice, vegetables, and fish came from different ecosystems and therefore had different isotope ratios. If this is the case, the δ13C and δ15N values of Ikenohata and Fushimi townspeople can differ even if they had the same dietary menu. On the other hand, although Ikenohata and Hitotsubashi populations represent townspeople in the same Edo city, they showed small (0.37‰) but significant differences in δ13C values (Table 5). At present, we cannot determine whether this difference represents a real difference or an artifact in sampling strategy. Additional isotopic studies for the Edo city population would be useful to clarify the cause of this difference.
Carbon and nitrogen isotopic differences among skeletal populations from different social classes were significant and relatively prominent (Figure 3). Ikenohata adults showed significantly higher δ13C values (+0.52‰) and lower δ15N values (−1.54‰) than hatamoto (middle-class warriors) and significantly lower δ13C values (−1.41‰) and δ15N values (−1.64‰) than shogun (feudal lords) of Kaneiji (Table 1). These differences are likely to have been the result of dietary differences, because food availability during the Edo period differed to some extent by social class in terms of the household economy. It is probable that hatamoto and shogun consumed more freshwater fish and marine fish, respectively, than townspeople (Figure 3), although the magnitude of this difference was relatively small in terms of isotope ecology. Historical studies have discussed relatively small differences in dairy food menus among different social classes, although warriors consumed foods from a higher trophic level (i.e. fish) much more in banquets (Ehara et al., 2009; Harada, 2009). Similarly, the dairy food menu of shogun was not very special, but marine foods were used frequently and food sources were carefully processed in general (Harada, 2009). Significant but not great isotopic differences among different social classes were observed in this study; this is consistent with the results of historical studies.
Isotopic differences among Ikenohata and other populations (Anrakuji, Kamiizawa-one/Hodokubo, Unseiji, and Uozu) could be the result both of different ecosystems and different dietary menus. Kito (2010) discussed that there was diversity in consumption of staple foods among different regions in the Edo period. Yoneda et al. (2011) also indicated a variability in δ13C and δ15N among several skeletal populations from the Japanese archipelago in the Edo period. Arizono (2007) found regional variations in combination and proportion of staple foods in ordinary people during 1879–1880 AD in the Meiji period (the period after the Edo period), which probably inherited regional differences from the Edo period.
Adult human skeletons from the Ikenohata-Shichikencho site showed fairly homogeneous δ13C and δ15N values, revealing no significant difference among individuals of different sexes, age categories, and chronological periods, except for a sex difference in δ13C values during the Middle–Late period (Figure 4, Figure 5). A comparison of Ikenohata data with the results of previous studies showed significant isotopic differences in the skeletal populations of the same social class (i.e. townspeople) and same geographic region (i.e. city of Edo) (Figure 3). The former difference was smaller than the latter and probably stems from the different ecosystems on which the people depended, and the latter would result from a different diet. Although the difference was relatively small in terms of stable isotope ecology, the social class and geographic regions would have affected dietary food sources for people during the Edo period.
Human bone samples excavated from the Ikenohata site were provided by Yuji Mizoguchi and Kazuhiro Sakaue. We are grateful to them. We thank Takayuki Omori and Kohei Yamazaki for assistance of stable isotope analysis. We would like to thank the editors and anonymous reviewers for their helpful comments. This study was supported in part by Grants-in-Aid for Scientific Research (KAKENHI: 18500769, 20370095, 24-785, and 15J00464) from the Japan Society for the Promotion of Science.
The materials and methods of this study did not include anything which needed to be approved by the ethical committee of our institute.
| Number | ID | Sex | Age | δ13C | δ15N | %C | %N | C/N | Yield | Period | Burial |
|---|---|---|---|---|---|---|---|---|---|---|---|
| i73 | 3/372/B-1b | F | 15–34 | −19.4 | 10.6 | 45.9 | 17.3 | 3.1 | 19.7 | Early | Round |
| i31 | 5/381/B-3 | F | 15–34 | −19.4 | 10.7 | 45.1 | 16.9 | 3.1 | 17.7 | Early | Round |
| i106 | 19/726/B-4 | F | 15–34 | −19.9 | 10.3 | 43.7 | 15.8 | 3.2 | 26.0 | Early | Round |
| i110 | 30/399/C-2 | F | 15–34 | −20.2 | 11.0 | 44.9 | 16.4 | 3.2 | 22.9 | Early | Round |
| i21 | 47/344/D-2 | F | 15–34 | −19.7 | 10.4 | 44.1 | 16.0 | 3.2 | 16.1 | Early | Round |
| i91 | 10/503/B-2 | F | 35–54 | −19.9 | 10.2 | 45.6 | 16.7 | 3.2 | 22.9 | Early | Round |
| i70 | 13/601/B-2 | F | 35–54 | −19.1 | 10.5 | 42.7 | 16.0 | 3.1 | 12.0 | Early | Round |
| i109 | 24/386/C-1 | F | 35–54 | −19.8 | 10.4 | 42.4 | 15.4 | 3.2 | 16.2 | Early | Round |
| i108 | 24/495/C-1 | F | 35–54 | −20.1 | 9.8 | 43.1 | 15.7 | 3.2 | 25.0 | Early | Round |
| i79 | 1/371/B-1 | F | — | −19.5 | 11.7 | 44.1 | 16.1 | 3.2 | 22.2 | Early | Round |
| i89 | 2/374/B-2 | F | — | −19.7 | 8.8 | 41.7 | 15.2 | 3.2 | 22.2 | Early | Round |
| i74 | 3/437/B-1 | F | — | −19.4 | 10.8 | 46.0 | 17.3 | 3.1 | 23.3 | Early | Round |
| i45 | 5/524/B-1 | M | 15–34 | −20.0 | 11.1 | 44.0 | 16.0 | 3.2 | 25.1 | Early | Round |
| i78 | 12/563/B-2 | M | 15–34 | −19.8 | 9.4 | 45.3 | 16.8 | 3.1 | 26.2 | Early | Round |
| i96 | 15/260/B-3 | M | 15–34 | −19.1 | 11.2 | 45.4 | 16.7 | 3.2 | 28.8 | Early | Round |
| i95 | 2/368/B-1 | M | 35–54 | −18.7 | 10.2 | 45.1 | 16.6 | 3.2 | 21.7 | Early | Rectangle |
| i76 | 3/380/B-2 | M | 35–54 | −19.8 | 9.1 | 44.0 | 16.5 | 3.1 | 23.5 | Early | Round |
| i47 | 5/562/B-1 | M | 35–54 | −19.8 | 9.7 | 43.0 | 15.7 | 3.2 | 15.9 | Early | Round |
| i75 | 10/378/B-2 | M | 35–54 | −19.7 | 10.6 | 45.4 | 16.9 | 3.1 | 23.9 | Early | Round |
| i93 | 11/498/B-2 | M | 35–54 | −19.6 | 10.8 | 42.9 | 15.8 | 3.2 | 19.4 | Early | Round |
| i97 | 11/516/B-2 | M | 35–54 | −19.3 | 10.5 | 44.4 | 16.4 | 3.2 | 26.2 | Early | Round |
| i43 | 3/372/B-1a | M | — | −19.9 | 10.7 | 45.1 | 16.6 | 3.2 | 27.0 | Early | Round |
| i41 | 1/178/B-1 | M | — | −20.2 | 11.0 | 40.2 | 14.8 | 3.2 | 10.8 | Early | Round |
| i101 | 18/459/B-4 | F | 15–34 | −20.3 | 10.2 | 43.5 | 15.8 | 3.2 | 22.2 | Middle | Round |
| i99 | 22/369/C-1 | F | 15–34 | −19.0 | 9.7 | 44.5 | 16.2 | 3.2 | 18.5 | Middle | Round |
| i107 | 29/157/C-2 | F | 15–34 | −20.2 | 10.7 | 42.6 | 15.6 | 3.2 | 27.6 | Middle | Round |
| i71 | 9/342/B-2 | F | 35–54 | −19.4 | 11.6 | 43.1 | 16.0 | 3.1 | 16.0 | Middle | Round |
| i94 | 9/361/B-2 | F | 35–54 | −19.7 | 10.2 | 45.7 | 16.8 | 3.2 | 25.9 | Middle | Round |
| i104 | 16/415/B-4 | F | 35–54 | −20.3 | 10.0 | 47.2 | 17.2 | 3.2 | 24.8 | Middle | Round |
| i98 | 17/479/B-4 | F | 35–54 | −19.2 | 10.1 | 46.0 | 17.1 | 3.1 | 22.9 | Middle | Round |
| i105 | 21/625/B-6 | F | 35–54 | −18.9 | 11.5 | 43.0 | 15.5 | 3.2 | 24.7 | Middle | Jar |
| i102 | 25/150/C-2a | F | 35–54 | −20.0 | 11.2 | 43.4 | 15.8 | 3.2 | 24.8 | Middle | Round |
| i103 | 28/159/C-2 | F | 35–54 | −19.9 | 10.9 | 42.7 | 15.4 | 3.2 | 25.4 | Middle | Round |
| i32 | 42/457futaue/C-4 | F | 35–54 | −19.8 | 10.4 | 45.4 | 16.7 | 3.2 | 21.9 | Middle | Round |
| i33 | 45/594/C-5 | F | 35–54 | −20.1 | 10.6 | 44.4 | 16.5 | 3.1 | 17.7 | Middle | Round |
| i22 | 57/916/B-7 | F | 35–54 | −19.1 | 11.0 | 43.2 | 15.7 | 3.2 | 14.3 | Middle | Round |
| i100 | 27/147/C-2 | F | ≥55 | −19.8 | 10.8 | 43.3 | 15.8 | 3.2 | 23.4 | Middle | Round |
| i34 | 61/854/C-7 | F | ≥55 | −19.9 | 11.8 | 42.3 | 15.5 | 3.2 | 15.8 | Middle | Jar |
| i49 | 7/172/B-2 | M | 15–34 | −20.0 | 11.1 | 43.3 | 15.8 | 3.2 | 25.8 | Middle | Round |
| i53 | 22/364/C-1a | M | 15–34 | −19.8 | 9.5 | 43.9 | 15.7 | 3.3 | 26.0 | Middle | Round |
| i54 | 42/411futaue/C-4 | M | 15–34 | −19.6 | 11.5 | 43.4 | 15.7 | 3.2 | 26.3 | Middle | Round |
| i55 | 43/615/C-4 | M | 15–34 | −20.1 | 11.5 | 43.8 | 15.5 | 3.3 | 24.3 | Middle | Round |
| i56 | 45/420/C-5 | M | 15–34 | −20.3 | 11.2 | 43.3 | 15.5 | 3.2 | 24.1 | Middle | Round |
| i42 | 2/180/B-1 | M | 35–54 | −19.2 | 11.6 | 44.9 | 16.5 | 3.2 | 19.7 | Middle | Round |
| i50 | 6/599/B-1 | M | 35–54 | −20.0 | 11.0 | 42.8 | 15.4 | 3.2 | 24.6 | Middle | Round |
| i72 | 7/173/B-2 | M | 35–54 | −18.3 | 12.3 | 43.8 | 16.4 | 3.1 | 13.1 | Middle | Round |
| i82 | 14/245/B-3 | M | 35–54 | −18.9 | 12.3 | 42.7 | 15.6 | 3.2 | 16.1 | Middle | Round |
| i92 | 14/256/B-3 | M | 35–54 | −19.7 | 10.9 | 45.4 | 16.6 | 3.2 | 25.8 | Middle | Round |
| i19 | 17/478/B-4 | M | 35–54 | −19.4 | 11.1 | 43.6 | 15.8 | 3.2 | 13.7 | Middle | Round |
| i20 | 18/592/B-4 | M | 35–54 | −19.9 | 10.7 | 43.1 | 15.7 | 3.2 | 13.0 | Middle | Round |
| i51* | 20/416/B-5 | M | 35–54 | −18.6 | 12.6 | 46.3 | 16.7 | 3.2 | 25.8 | Middle | Round |
| i63 | 89/920/C-8 | M | 35–54 | −19.7 | 10.5 | 41.0 | 14.0 | 3.4 | 3.1 | Middle | Jar |
| i48 | 6/162/B-2 | M | ≥55 | −20.1 | 11.0 | 43.2 | 15.6 | 3.2 | 20.4 | Middle | Round |
| i44 | 4/559/B-1 | M | — | −19.9 | 11.3 | 44.5 | 16.2 | 3.2 | 22.4 | Middle | Round |
| i52 | 20/418/B-5 | M | — | −20.1 | 10.9 | 43.3 | 15.6 | 3.2 | 22.3 | Middle | Round |
| i115 | 60/646/C-7 | F | 15–34 | −20.1 | 9.7 | 42.9 | 15.8 | 3.2 | 24.8 | Middle–Late | Round |
| i129 | 65/653/B-8 | F | 15–34 | −20.6 | 9.8 | 45.1 | 16.7 | 3.1 | 26.9 | Middle–Late | Round |
| i35 | 66/630/B-8 | F | 15–34 | −19.9 | 10.7 | 43.7 | 16.1 | 3.2 | 13.1 | Middle–Late | Round |
| i37 | 86/773/C-8 | F | 15–34 | −20.0 | 11.4 | 41.7 | 15.3 | 3.2 | 15.4 | Middle–Late | Rectangle |
| i38 | 86/829/C-8 | F | 15–34 | −19.9 | 10.6 | 42.5 | 15.5 | 3.2 | 18.8 | Middle–Late | Round |
| i133 | 66/757/B-8 | F | 35–54 | −20.3 | 10.8 | 42.7 | 15.5 | 3.2 | 26.6 | Middle–Late | Round |
| i138 | 70/826/B-8 | F | 35–54 | −20.2 | 11.5 | 42.6 | 15.6 | 3.2 | 29.2 | Middle–Late | Round |
| i145 | 80/697/C-8 | F | 35–54 | −19.1 | 10.9 | 45.3 | 16.7 | 3.2 | 24.6 | Middle–Late | Round |
| i120 | 65/653futaue/B-8 | F | — | −19.8 | 12.0 | 42.7 | 15.4 | 3.2 | 15.4 | Middle–Late | Round |
| i40 | 96/623/D-8 | F | — | −20.4 | 10.2 | 45.9 | 16.8 | 3.2 | 18.6 | Middle–Late | Rectangle |
| i58 | 59/635/C-7 | M | 15–34 | −20.3 | 9.7 | 42.8 | 15.6 | 3.2 | 22.0 | Middle–Late | Direct |
| i144 | 80/632/C-8 | M | 15–34 | −19.8 | 10.5 | 44.4 | 16.4 | 3.2 | 25.1 | Middle–Late | Round |
| i61 | 84/733/C-8 | M | 15–34 | −20.0 | 10.3 | 42.2 | 15.6 | 3.2 | 22.0 | Middle–Late | Round |
| i64 | 95/835/D-8 | M | 15–34 | −19.5 | 9.8 | 44.5 | 16.7 | 3.1 | 22.0 | Middle–Late | Round |
| i67 | 97/644/D-8 | M | 15–34 | −19.9 | 10.2 | 44.4 | 16.6 | 3.1 | 12.4 | Middle–Late | Scatter |
| i68 | 99/792/D-8 | M | 15–34 | −19.6 | 10.5 | 45.0 | 16.9 | 3.1 | 18.9 | Middle–Late | Jar |
| i69 | 99/831/D-8 | M | 15–34 | −19.4 | 11.6 | 45.0 | 17.1 | 3.1 | 14.8 | Middle–Late | Round |
| i134 | 72/828/B-8 | M | 35–54 | −20.0 | 10.9 | 42.8 | 15.7 | 3.2 | 26.3 | Middle–Late | Round |
| i62 | 89/919/C-8 | M | 35–54 | −19.4 | 10.3 | 44.3 | 16.6 | 3.1 | 13.5 | Middle–Late | Round |
| i66 | 97/629/D-8 | M | 35–54 | −19.6 | 9.9 | 42.6 | 15.6 | 3.2 | 25.9 | Middle–Late | Direct |
| i136 | 75/274/C-8 | M | ≥55 | −19.8 | 11.3 | 42.6 | 15.6 | 3.2 | 25.8 | Middle–Late | Round |
| i119 | 75/277/C-8 | M | — | −18.7 | 12.3 | 43.9 | 15.9 | 3.2 | 22.8 | Middle–Late | Round |
| i122 | 61/312/B-8 | F | 15–34 | −19.8 | 10.7 | 43.0 | 15.5 | 3.2 | 25.4 | Late | Round |
| i116 | 63/315/B-8 | F | 15–34 | −20.3 | 10.2 | 42.3 | 15.5 | 3.2 | 25.5 | Late | Round |
| i127 | 64/536/B-8 | F | 15–34 | −20.0 | 11.1 | 44.9 | 16.5 | 3.2 | 24.5 | Late | Rectangle |
| i36 | 69/780/B-8 | F | 15–34 | −19.6 | 11.2 | 44.3 | 16.4 | 3.2 | 24.6 | Late | Rectangle |
| i137 | 75/275/C-8 | F | 15–34 | −20.0 | 10.5 | 42.4 | 15.5 | 3.2 | 25.4 | Late | Round |
| i135 | 76/282/C-8 | F | 15–34 | −20.1 | 10.6 | 42.1 | 15.3 | 3.2 | 21.2 | Late | Round |
| i142 | 76/305/C-8 | F | 15–34 | −19.5 | 11.4 | 43.8 | 16.2 | 3.1 | 25.6 | Late | Rectangle |
| i141 | 81/300/C-8 | F | 15–34 | −19.7 | 11.5 | 43.3 | 15.6 | 3.2 | 24.8 | Late | Round |
| i39 | 96/228futaue/D-8 | F | 15–34 | −19.7 | 11.1 | 42.1 | 15.4 | 3.2 | 18.1 | Late | Round |
| i117 | 74/122/C-8 | F | 35–54 | −19.2 | 11.6 | 44.0 | 16.0 | 3.2 | 26.7 | Late | Round |
| i118 | 62/309/B-8 | M | 15–34 | −19.1 | 11.7 | 44.0 | 15.8 | 3.3 | 25.1 | Late | Rectangle |
| i125 | 63/318/B-8 | M | 15–34 | −19.1 | 11.7 | 45.1 | 16.7 | 3.2 | 24.2 | Late | Round |
| i132 | 71/856/B-8 | M | 15–34 | −19.5 | 10.9 | 42.3 | 15.4 | 3.2 | 26.2 | Late | Round |
| i143 | 79/302futaue/C-8 | M | 15–34 | −19.7 | 11.4 | 45.1 | 16.7 | 3.2 | 14.6 | Late | Round |
| i65 | 96/228/D-8 | M | 15–34 | −19.7 | 11.0 | 41.5 | 15.3 | 3.2 | 19.6 | Late | Round |
| i121 | 58/529/C-7 | M | 35–54 | −20.0 | 10.1 | 42.7 | 15.6 | 3.2 | 23.9 | Late | Round |
| i139 | 67/737/B-8 | M | 35–54 | −19.7 | 10.8 | 41.2 | 15.3 | 3.1 | 26.3 | Late | Round |
| i57 | 58/531/C-7 | M | ≥55 | −19.7 | 10.5 | 41.5 | 15.2 | 3.2 | 11.2 | Late | Round |
| i126 | 59/571/C-7 | M | ≥55 | −19.4 | 11.1 | 43.8 | 16.2 | 3.2 | 23.1 | Late | Round |
| i123 | 63/316/B-8 | M | ≥55 | −19.5 | 10.7 | 42.5 | 15.5 | 3.2 | 24.2 | Late | Rectangle |
| i114 | 64/537/B-8 | M | ≥55 | −20.3 | 11.2 | 43.3 | 15.7 | 3.2 | 23.9 | Late | Round |
| i111 | 65/654/B-8 | M | ≥55 | −20.2 | 10.2 | 44.4 | 16.5 | 3.1 | 19.4 | Late | Round |
| i128 | 68/722/B-8 | M | ≥55 | −19.8 | 11.6 | 45.5 | 16.8 | 3.2 | 25.0 | Late | Round |
| i60 | 69/779/B-8 | M | ≥55 | −20.1 | 10.6 | 42.1 | 15.5 | 3.2 | 18.5 | Late | Rectangle |
| i140 | 79/298/C-8 | M | ≥55 | −19.3 | 11.3 | 42.9 | 15.6 | 3.2 | 27.1 | Late | Round |
| i59 | 66/654nantouikkatsu/B-8 | M | — | −19.8 | 10.4 | 40.2 | 14.8 | 3.2 | 17.9 | Late | Round |
An individual with severe pathology (i51) is indicated with an asterisk. ‘Round’ and ‘Rectangle’ in the ‘Burial’ column indicate round or rectangular wooden coffins, respectively.