Original Articles
Global and local perspectives on cranial shape variation in Indonesian Homo erectus
2017 Volume 125 Issue 2 Pages 67-83

Details
2017 Volume 125 Issue 2 Pages 67-83
Homo erectus is among the best-represented fossil hominin species, with a particularly rich record in Indonesia. Understanding variation within this sample and relative to other groups of H. erectus in China, Georgia, and Africa is crucial for answering questions about H. erectus migration, local adaptation, and evolutionary history. Neurocranial shape is analyzed within the Indonesian sample, including representatives from Sangiran, Ngandong, Sambungmacan, and Ngawi, as well as a comparative sample of H. erectus from outside of Java, using three-dimensional geometric morphometric techniques. This study includes several more recently described Indonesian fossils, including Sambungmacan 4 and Skull IX, producing a more complete view of Indonesian variation than seen in previous shape analyses. While Asian fossils can be distinguished from the African/Georgian ones, there is not a single cranial Bauplan that distinguishes all Indonesian fossils from those in other geographic areas. Nevertheless, late Indonesian H. erectus, from sites such as Ngandong, are quite distinct relative to all other H. erectus groups, including earlier fossils from the same region. It is possible that this pattern represents a loss of genetic diversity through time on the island of Java, coupled with genetic drift, although other interpretations are plausible. A temporal pattern of diachronic change was identified within Indonesia for the posterior neurocranium such that younger Sangiran fossils more closely approached the Ngandong/Sambungmacan/Ngawi pattern, but there was not a linear trend of shape change from Sangiran to Sambungmacan to Ngandong, as has been suggested previously. The Sambungmacan 3 fossil, which often appears as a morphological outlier, fits the general pattern of late Indonesian vault shape, but has a more extreme expression of the shape trends for this group than other individuals.
The Homo erectus fossil record from Java is extensive and has wide-ranging implications for evolutionary questions about the timing of early Homo migration, the effects of stochastic evolution on islands, local adaptation, and a potential speciation event that gave rise to Homo floresiensis, known from the nearby island of Flores (Brown et al., 2004; Baab, 2016a). Moreover, the time span, which may encompass more than a million years of evolution, allows us to probe issues of diachronic change in this species. The oldest fossils (early Pleistocene) from Java are those from Trinil and the Sangiran dome. The young individual recovered from Modjokerto may also be Early Pleistocene in age, but this is less certain. A second group of fossils from Ngandong, Sambungmacan, and Ngawi is generally considered to be Middle Pleistocene or even Late Pleistocene in age. The Ngandong fossils, consisting of numerous partial and complete calvaria and well as a few postcranial elements, were recovered from excavations on the high terraces of the Solo River. However, the three Sambungmacan and single Ngawi calvaria were recovered by local inhabitants from three different sites along this river, and the exact stratigraphic provenance of these fossils is uncertain. Most of these sites are situated along the Solo River in east Java, with the exception of the more eastern site of Modjokerto, which has yielded one young individual, and the more western site of Cisanca, from which a single incisor was recovered (Kramer et al., 2005).
The Asian hominin record has been subject to a continuous stream of analyses beginning with the initial description of the Trinil fossils by Dubois (1894). Additional earlier discoveries were also from the earlier time frame. The first fossils recovered from the Middle/Late Pleistocene were from Ngandong in the 1930s. The Ngandong fossils were initially placed in a distinct species, Homo (Javanthropus) soloensis (Oppenoorth, 1932), and similarities to other Middle Pleistocene hominins or late Pleistocene Homo sapiens from Australasia were noted. However, monographs on the Zhoukoudian (China) and Ngandong fossils by Weidenreich were particularly influential (Weidenreich, 1943, 1951) in establishing two common themes that have persisted until the present: the fossils from Trinil/Sangiran, Zhoukoudian, and Ngandong share a common Bauplan but with regional and temporal variations overprinted on this shared architecture. Santa Luca’s (1980) in-depth analysis of the Ngandong fossils further solidified this sample as part of the broader H. erectus type. Additional fossil discoveries have occurred in both the earlier time frame, including additional Sangiran dome localities (Sartono and Tyler, 1993; Widianto et al., 1994; Widianto and Grimaud-Herve, 2000; Grimaud-Hervé et al., 2005; Zaim et al., 2011), and the later time frame, such as the three calvaria from Sambungmacan (Jacob et al., 1978; Márquez et al., 2001; Baba et al., 2003) and the one from Ngawi (Sartono, 1991). Sambungmacan and Ngawi are considered to have particular affinities with Ngandong.
More recent work that has focused on the cranial morphology of the Asian H. erectus fossil record includes evaluations of the metric and non-metric diversity of Asian or specifically the Indonesian fossil record (Antón, 2002; Kaifu et al., 2008), cranial shape variation in the Asian fossils (Baab, 2010; Zeitoun et al., 2010), and analyses focused on the affinities of particular fossils (Delson et al., 2001; Widianto et al., 2001; Antón et al., 2002; Widianto and Zeitoun, 2003; Durband, 2006; Kaifu et al., 2006, 2015; Indriati and Antón, 2010). It was demonstrated that Asian, along with numerous African and Georgian fossils assigned to H. erectus, were distinct from or displayed minimal overlap with other archaic Homo species on the basis of three-dimensional (3D) neurocranial shape (Zeitoun et al., 2010; Baab, 2016b). There is substantial variation within this sample that spans three continents and more than a million years of evolutionary change. Some of this variation is attributable to diachronic change (Wolpoff et al., 1994; Antón, 2003; Kaifu et al., 2005, 2008), and to geography (perhaps related to genetic drift or local adaptation) (Antón, 2002; Kidder and Durband, 2004; Durband, 2006; Baab, 2010), but is also influenced by cranial size (Santa Luca, 1980; Antón et al., 2007; Baab, 2008b; Kaifu et al., 2008). Some studies have found that the Zhoukoudian hominins are particularly distinct in their craniometric dimensions (Antón, 2002; Kidder and Durband, 2004), while others have indicated that the Ngandong/Sambungmacan/Ngawi series of calvaria are at least as distinct (Baab, 2010; Zeitoun et al., 2010).
The Ngandong/Sambungmacan/Ngawi fossils are often grouped together, in contrast to the presumably older Sangiran/Trinil fossils, and there is general consensus that the latter are broadly ancestral to the former. This position was supported by Weidenreich (1940: 377–378), who argued that “Homo soloensis [Ngandong] has to be regarded as a direct descendent from Pithecanthropus and represents really a succeeding phase” based on the observation that, “in all essential details which define the Homo soloensis type, there is a surprising correspondence to Pithecanthropus.” This has been echoed more recently by Wolpoff (1999: 573) who stated that similarities between early Indonesian fossils and Ngandong/Ngawi “indicate relationship, almost certainly descent” and Antón (2002: 319), who asserted that “the relatively small differences between the earlier and later Indonesian fossils must certainly be accepted as temporal changes within a lineage, rather than indicative of a different lineage.” Both workers identified non-metric features (e.g. frontal keel and anterior projection of the medial part of the supraorbital torus) unique to this group, and Antón (2002) further found similarity in size/shape of the cranial vault based on quantitative measures.
Nevertheless, there are differences of opinion regarding the details of that evolutionary transition. In particular, recent analyses of 2D linear dimensions and non-metric features supported a linear transition from Sangiran/Trinil through Sambungmacan/Ngawi and onto Ngandong (Baba et al., 2003; Kaifu et al., 2006, 2008, 2015), a view also embraced by Wolpoff (1999). This conclusion was based on observations that geochronologically younger Sangiran fossils were more similar to later Indonesian fossils than were older ones, and that both Ngawi and the three Sambungmacan specimens displayed intermediate morphologies between Sangiran/Trinil and Ngandong. Durband (2006) suggested near stasis in the vault shape in Indonesia for 0.7–1.0 Myr based on canonical variate analysis of size-corrected neurocranial length and breadth dimensions, but identified a handful of non-metric features in the later Indonesian sample not present in Sangiran/Trinil. He attributed this combined pattern to geographic and genetic isolation of these populations on Java. In contrast, analysis of vault shape via 3D landmarks demonstrated distinct neurocranial shape in the Sambungmacan/Ngawi, Ngandong, and Trinil/Sangiran groups, and the differences among them were non-linear (Baab, 2010; Zeitoun et al., 2010). At least some of the differences between the early Indonesian and the Ngandong fossils appear to relate to the increased size of the latter (Antón, 2002; Baab, 2016b). A small number of workers argue that the morphological distance between the Trinil/Sangiran and later Indonesian fossils should perhaps be recognized at the species level (Schwartz and Tattersall, 2005; Zeitoun et al., 2010), with a further possible split between Sambungmacan/Ngawi and Ngandong (Tattersall and Schwartz, 2009), but with the recognition that these samples form a single clade. Methodological and sample details differed among these studies. In particular, none of the 3D shape analyses included Sambungmacan 4 (Sm 4) or Skull IX (Tjg-1993.05) (Baab, 2010, 2016b; Zeitoun et al., 2010). Therefore, while there is consensus regarding the close evolutionary relationship among the populations represented by these fossils, there is disagreement regarding the patterning of morphological variation among these groups and its implications for their historical relationships.
A recent analysis demonstrated the utility of 3D neurocranial shape information for defining the boundaries of H. erectus, broadly defined to include fossils from Africa, Georgia, China, and Indonesia (Baab, 2016b). That study focused on interspecific variation, but it was apparent that there was also substantial intraspecific variation, and further, that this variation was structured with respect to geography, geochronological age, and brain size. Intraspecific variation in neurocranial shape was also touched on in earlier studies, including one that specifically assessed Asian H. erectus (Baab, 2008b, 2010). This current study aims to expand on this work by evaluating patterns of variation in the Indonesian H. erectus sample, and how this sample relates to other H. erectus groups from across the Old World. This study improves on the earlier 3D studies by including the Sm 4 and Skull IX calvaria, which results in a more complete sampling of Indonesian fossils than in previous 3D shape analyses, and utilizing an updated geochronology, which mostly involves the Indonesian fossils. This study cannot address the question of non-metric character variation and evolution and, despite focused efforts to improve fossil representation noted above, is unable to evaluate fragmentary fossils that fail to preserve certain key landmarks. Furthermore, the nature of geometric morphometric analysis of shape requires an assessment of many aspects of shape simultaneously which restricts the ability to partition out the specifics of regional morphological change.
GeochronologyThere are currently two chronologies for Indonesian H. erectus that are mutually exclusive. The long chronology suggests that the oldest hominin fossils are >1.5 Ma in the Sangiran dome and 1.8 Ma at Modjokerto according to 40Ar/39Ar analysis of hornblende samples (Swisher et al., 1994; Larick et al., 2001). At Sangiran, a high-resolution paleomagnetic record that documents the Matuyama–Brunhes transition (Hyodo et al., 2011), fission-track dating (Suzuki and Wikarno, 1982; Suzuki et al., 1985), faunal analysis (van den Bergh et al., 2001), and dating of tektites (Itihara et al., 1985) contradict this long chronology. Whereas many fossils from the Sangiran basin were dated to ~1 Ma by 40Ar/39Ar dating, these same fossils fall closer to 0.78 Ma according to the short chronology. An age of 1.66 Ma, the oldest date proposed for any Sangiran fossils, as well as a date of 1.8 Ma for the Modjokerto child (Swisher et al., 1994), were both criticized on the basis of erroneous geological sampling (de Vos and Sondaar, 1994; Sémah et al., 1997; Huffman, 2001; Bettis et al., 2004; Huffman et al., 2006). The type specimen of H. erectus, the Trinil II calotte, has been dated via stratigraphic correlation between Trinil and Sangiran dome. The current consensus seems to be a stratigraphic position near the base of the Bapang (Kabuh) formation, which is likely ~1.0 Ma based on the short chronology (van den Bergh et al., 2001). On balance, the young chronology is better supported and will be used in this study.
The other large group of H. erectus fossils are from the sites of Ngandong, Sambungmacan, and Ngawi. Fossils from these sites are generally thought to be younger than those from the Sangiran Basin or Trinil, but the exact ages remain uncertain. The Ngandong fossils were recovered from an excavation of the Solo River terraces. Middle Pleistocene ages have often been proposed for these fossils based on faunal correlation, paleomagnetism, and fission-track dating of the underlying Pohjajar (Notoporo) beds (Jacob, 1978; Suzuki and Wikarno, 1982; Sémah, 1984). However, earlier workers suggested early Pleistocene dates (Oppenoorth, 1932; von Koenigswald, 1934). Itihara et al. (1985) suggested a Late Pleistocene age for these same deposits, and Swisher et al. (1996) posited a very young age of 53–27 ka for both Ngandong and Sambungmacan. More recent geological work at Ngandong by Indriati et al. (2011) found two internally consistent but mutually exclusive sets of dates based on 40Ar/39Ar dating of hornblende from within the fossiliferous layers versus ESR and U-series dating of fossil teeth. The former suggested a Middle Pleistocene age of 546 ka, while the latter suggested younger ages between 77 and 143 ka for combined ESR and U-series dating, and as young as 44 ka based on the closed system ESR alone. Indriati et al. (2011) conclude that a reasonable age range for Ngandong is 546–143 ka, but do not rule out that the fossils may be closer to the older end of the range, with the younger dates reflecting a more recent geomorphologic or hydrologic event. However, Yokoyama et al.’s (2008) gamma-ray spectrometric dating of three hominin fossils from Ngandong and Sambungmacan yielded young ages between 40 and 70 ka, which is more consistent with the ESR dates.
The Sambungmacan calvaria (Sm 1, 3 and 4) are often grouped with the Ngandong fossils (Antón et al., 2002; Baab, 2016b), but the former were all found by local inhabitants rather than during controlled excavations and may not be contemporaneous with each other or with the Ngandong fossils (Kaifu et al., 2008). Yokoyama et al. (2008) found similar dates for two Ngandong (Ng 1 and Ng 7) and one Sambungmacan (Sm 1) fossil, suggesting that this assumption may be correct for at least some of the specimens. Yet, the very young date reported by Yokoyama et al. (2008) may reflect more recent hydrological activity unrelated to the actual deposition of these fossils (Indriati et al., 2011). Deposits spanning the Pleistocene are found in the area of the Sm 1 findspot (Kaifu et al., 2008). Sm 3 and 4 were found at the bottom of the Solo River in the same location, which was 4 km from the Sm 1 site. Kaifu et al. (2011a) recently used the mineral composition of matrix adhering to the Sm 4 calvaria to identify its likely stratigraphic level which was then fission-track dated to ~0.27 Ma. Matsu’ura et al. (2000) applied multi-element analysis of inductively coupled plasma spectrometry to a hominin tibia (Sm 2) recovered from the same site as Sm 1 and concluded that it derived from the lower part of the Bapang Formation or possibly the very late Matuyama, which correlates to ~890–780 ka based on the paleomagnetic study of Hyodo et al. (2011) at Sangiran. It is unclear whether or how the Sm 1 and Sm 2 fossils are related, but this could lend support to an older age for the Sambungmacan hominins. However, both Swisher et al. (1996) and Yokoyama et al. (2008) support very late Pleistocene ages for Sambungmacan as discussed above (but see Indriati et al. (2011)). Thus, the range of dates for Sambungmacan encompasses the Early to Late Pleistocene and may predate, post-date, or be synchronous with Ngandong. The Ngawi calvaria is also frequently grouped with Ngandong and Sambungmacan on the basis of shared morphology (Widianto and Zeitoun, 2003; Baab, 2016b) but there is no date available for this fossil.
What evidence we have regarding the geological age of the Ngandong/Sambungmacan/Ngawi fossils points to a Middle or possibly Early Pleistocene age. However, we cannot be certain that all of these fossils are contemporaneous nor is it possible to establish the chronological positions of these fossils relative to one another.
The H. erectus specimens included in this study are listed in Table 1, alongside information about whether the original fossil, a cast, or a surface rendering generated from microcomputed tomography (micro-CT) data was utilized. The specimens together create a representative sample that captures the spatiotemporal and size variation of this species. Although data were available from the Daka (BOU-VP-2/66) fossil, it was excluded from the analyses because though it was originally assigned to H. erectus (Asfaw et al., 2002), its more derived neurocranial shape and cranial nonmetric features could position this as a stem H. heidelbergensis s.l. (Baab, 2016b).
| Fossil | Abbreviation | Data source | Endocranial volume and citation | Geological age (Ma) and citation | ||
|---|---|---|---|---|---|---|
| INDONESIA | ||||||
| Sangiran 2 | Sang 2 | Original | 813 | Holloway, 1981 | 0.90 | Extrapolated from Hyodo et al. (1993; 2011) |
| Sangiran 4 | Sang 4 | Original | 908 | Holloway, 1981 | 0.90 | Extrapolated from Hyodo et al. (1993; 2011) |
| Sangiran 10 | Sang 10 | Original | 855 | Holloway, 1981 | 0.79 | Extrapolated from Hyodo et al. (2011) |
| Sangiran 17 | Sang 17 | Cast | 1004 | Holloway, 1981 | 0.84 | Extrapolated from Hyodo et al. (2011) |
| Tjg-1999.05 | Skull IX | Virtual | 870 | Kaifu et al., 2011b | 0.84 | Extrapolated from Hyodo et al. (2011) |
| Ngandong 1 | Ng 1 | Original | 1172 | Holloway, 1980 | 0.546/0.040 | Indriati et al. (2011)/Yokoyama et al. (2008) |
| Ngandong 6 | Ng 6 | Original | 1251 | Holloway, 1980 | 0.546/0.040 | Indriati et al. (2011)/Yokoyama et al. (2008) |
| Ngandong 7 | Ng 7 | Original | 1013 | Holloway, 1980 | 0.546/0.040 | Indriati et al. (2011)/Yokoyama et al. (2008) |
| Ngandong 10 | Ng 10 | Original | 1135 | Weidenreich, 1943 | 0.546/0.040 | Indriati et al. (2011)/Yokoyama et al. (2008) |
| Ngandong 11 | Ng 11 | Original | 1231 | Holloway, 1980 | 0.546/0.040 | Indriati et al. (2011)/Yokoyama et al. (2008) |
| Ngandong 12 | Ng 12 | Original | 1090 | Holloway, 1980 | 0.546/0.040 | Indriati et al. (2011)/Yokoyama et al. (2008) |
| Sambungmacan 1 | Sm 1 | Original | 1035 | Baba et al., 2003 | 0.546/0.040 | Indriati et al. (2011)/Yokoyama et al. (2008) |
| Sambungmacan 3 | Sm 3 | Original | 917 | Holloway et al., 2004 | 0.546/0.040 | Indriati et al. (2011)/Yokoyama et al. (2008) |
| Sambungmacan 4 | Sm 4 | Virtual | 1006 | Baba et al., 2003 | 0.546/0.0401 | Indriati et al. (2011)/Yokoyama et al. (2008) |
| Ngawi | Ngawi | Cast | 870 | Widianto and Zeitoun, 2003 | 0.546/0.040 | Assumed synchrony with Ngandong/Samb. |
| CHINA | ||||||
| Zhoukoudian 3 | Zkd 3 | Cast | 915 | Weidenreich, 1943 | 0.8 | Extrapolated from Shen et al. (2009) |
| Zhoukoudian 5 | Zkd 5 | Cast | 1140 | Qiu et al., 1973 | 0.4 | Extrapolated from Shen et al. (2009) |
| Zhoukoudian 11 | Zkd 11 | Cast | 1015 | Weidenreich, 1943 | 0.75 | Extrapolated from Shen et al. (2009) |
| Zhoukoudian 12 | Zkd 12 | Cast | 1030 | Weidenreich, 1943 | 0.75 | Extrapolated from Shen et al. (2009) |
| GEORGIA | ||||||
| D2280 | D2280 | Cast | 780 | Rightmire et al., 2006 | 1.77 | Ferring et al. (2011) |
| D2700 | D2700 | Cast | 612 | Rightmire et al., 2006 | 1.77 | Ferring et al. (2011) |
| D3444 | D3444 | Cast | 625 | Rightmire et al., 2006 | 1.77 | Ferring et al. (2011) |
| AFRICA | ||||||
| KNM-ER 3733 | ER 3733 | Original | 848 | Holloway, 1983 | 1.78 | Feibel et al. (1989) |
| KNM-ER 3883 | ER 3883 | Original | 804 | Holloway, 1983 | 1.57 | Feibel et al. (1989) |
| KNM-WT 15000 | WT 15000 | Original | 909 | Walker and Leakey, 1993 | 1.53 | Brown and McDougall (1993) |
Two of the specimens are clearly subadult: KNM-WT 15000 (Nariokotome Boy) and D2700 from Kenya and Georgia, respectively. KNM-WT 15000 was probably 8–10 years of age at death (Dean et al., 2001; Dean and Smith, 2009) and exhibited unerupted third molars. D2700 had an unfused spheno-occipital synchondrosis but partially erupted M3s and is thus older than Nariokotome Boy—perhaps ≤13 years of age based on comparisons with the immature OH 13 Homo habilis specimen (Rightmire et al., 2006). Their inclusion is justified primarily on the grounds that they expand the relatively small sample sizes of well-preserved African and Georgian fossils assigned to H. erectus. Moreover, the D2700 specimen has a cranial shape within the range of adult H. erectus and its neurocranium was within the range of expected shapes for an adult H. erectus of equivalent size (Baab, 2008a; Baab and McNulty, 2009). Likewise, Zkd 3, identified as a subadult by Black (1931) and Weidenreich (1943), but as an older subadult or young adult by Antón (2001), was shown previously to fit well within the range of cranial shape exhibited by adult Zhoukoudian fossils (Baab, 2010) and is thus included here.
Data were available from Ng 1, but initial analysis indicated that the Ng 1 calvaria is an outlier, due to the anteromedial angulation of the temporal base structures. This is consistent with the distortion noted in Ng 1 by previous workers. Weidenreich (1951: 228) described the Ng 1 calvaria as “somewhat twisted. The right temporal bone and the right half of the nuchal plane of the occipital bone are depressed inward.” Santa Luca (1980: 18) states that the “right temporal squama compressed medially.” Kaifu et al. (2008) also noted twisting of the frontoparietal fragment and an anomalous flexion of the midparietal region in lateral view. For this reason, Ng 1 was excluded from the analysis.
Weidenreich (1943: 222) further noted less severe distortion of Ng 6 in the form of “The right side, from the temporal line down, is pressed inward and is broken in part … all this produced a slight asymmetry of the calvarium.” Kaifu et al. (2008) confirmed this distortion, noting that the “vault is slightly deformed to its right. … In basal view, the right temporal bone is anteroposteriorly extended so that the nuchal squama of the occipital faces slightly toward the specimen’s left. In addition, the right temporal squama is pushed inward medially.” To accommodate these issues, the following landmarks were recorded only from the less affected left temporal bone: porion, auriculare, parietal notch, asterion, and mid-temporal squama. These landmarks were reflected to the right, creating a more symmetrical and biologically accurate landmark configuration. Any remaining asymmetries should be minor and not explicitly evaluated as only the symmetric component of shape was retained for analysis (see below). Similar procedures were used to correct for distortion in KNM-WT 15000 and KNM-ER 3883 as described in Baab (2016b).
3D cranial landmarks were acquired using a Microscribe (3D mechanical arm digitizer) in all cases with the exception of Sm 4 and Skull IX where landmarks were captured from the in silico surface rendering using AVIZO software at the Tsukuba Research Departments of the National Museum of Nature and Science, Tokyo. These landmarks were distributed across the regions of the cranium most often preserved in H. erectus: the cranial vault, including the supraorbital region, and the basicranium. Landmark definitions and abbreviations are provided in Table 2 and illustrated in Figure 1. Different subsets of the full landmark protocol were analyzed in order to optimize both morphological representation and sample sizes (see Table 3). Similar approaches were described previously (Baab, 2010, 2016b).
| Landmark | Abbreviation | Definition |
|---|---|---|
| Inion | IN | Point at which superior nuchal lines merge in midsagittal plane |
| Lambda | LA | The apex of the occipita bone at its junction with the parietals, in the midline |
| Apex | AX | Highest midline point on the vault in Frankfort horizontal |
| Bregma | BR | Posterior border of the frontal bone in the midsagittal plane |
| Post-toral sulcus | PTS | Minima of concavity on midline post-toral frontal squama |
| Glabella | GL | Most anterior midline point on the frontal bone, usually above the frontonasal suture |
| Supraorbital notch | SON | Point of greatest projection of notch into orbital space, taken on medial side of notch |
| Frontomalaretemporale | FMT | Point where the frontozygomatic suture crosses the temporal line |
| Frontomalareorbitale | FMO | Point where the frontozygomatic suture crosses the inner orbital rim |
| Mid-torus inferior | MTI | Point on inferior margin of supraorbital torus at the middle of the orbit (on superior margin of orbit) |
| Mid-torus superior | MTS | Point on superior aspect of supraorbital torus, directly above mid-torus inferior on anterior aspect of torus |
| Anterior pterion | AP | Intersection of coronal suture and sphenofrontal or sphenoparietal suture |
| Porion | PO | Uppermost point on the margin of the external auditory meatus |
| Auriculare | AU | Point vertically above the center of the external auditory meatus at the root of the zygomatic process |
| Frontotemporale | FT | Point where the temporal line reaches its most anteromedial position on the frontal |
| Parietal notch | PN | Posterosuperior border of the temporal where the squamosal and parietomastoid sutures meet |
| Asterion | AS | Common meeting point of the temoral, parietal, and occipital bones, on either side |
| Opisthion | OP | Midline point at the posterior margin of the foramen magnum |
| Tympanomastoid junction | TM | Point on lateral border of the tympanomastoid fissure |
| Entoglenoid | EG | Most inferior point on the entoglenoid pyramid |
| Temporosphenoid | TS | Point where temporosphenoid suture passes from squama to cranial base (often on infratemporal crest) |
| Metopion | MET | Point midway between glabella and bregma on the midline (calculated from semilandmark data) |
| Mid-temporal squama | MS | Point on the temoral squama midway between temporosphenoid and parietal notch (calculated from semilandmark data) |
| Mid-parietal | MP | Point on sagittal suture midway between bregma and lambda (calculated from semilandmark data) |
| Postglenoid process | PG | Inferolateral-most point posterior to glenoid fossa and anterior to ectotympanic tube (postglenoid tuberosity or crest) |
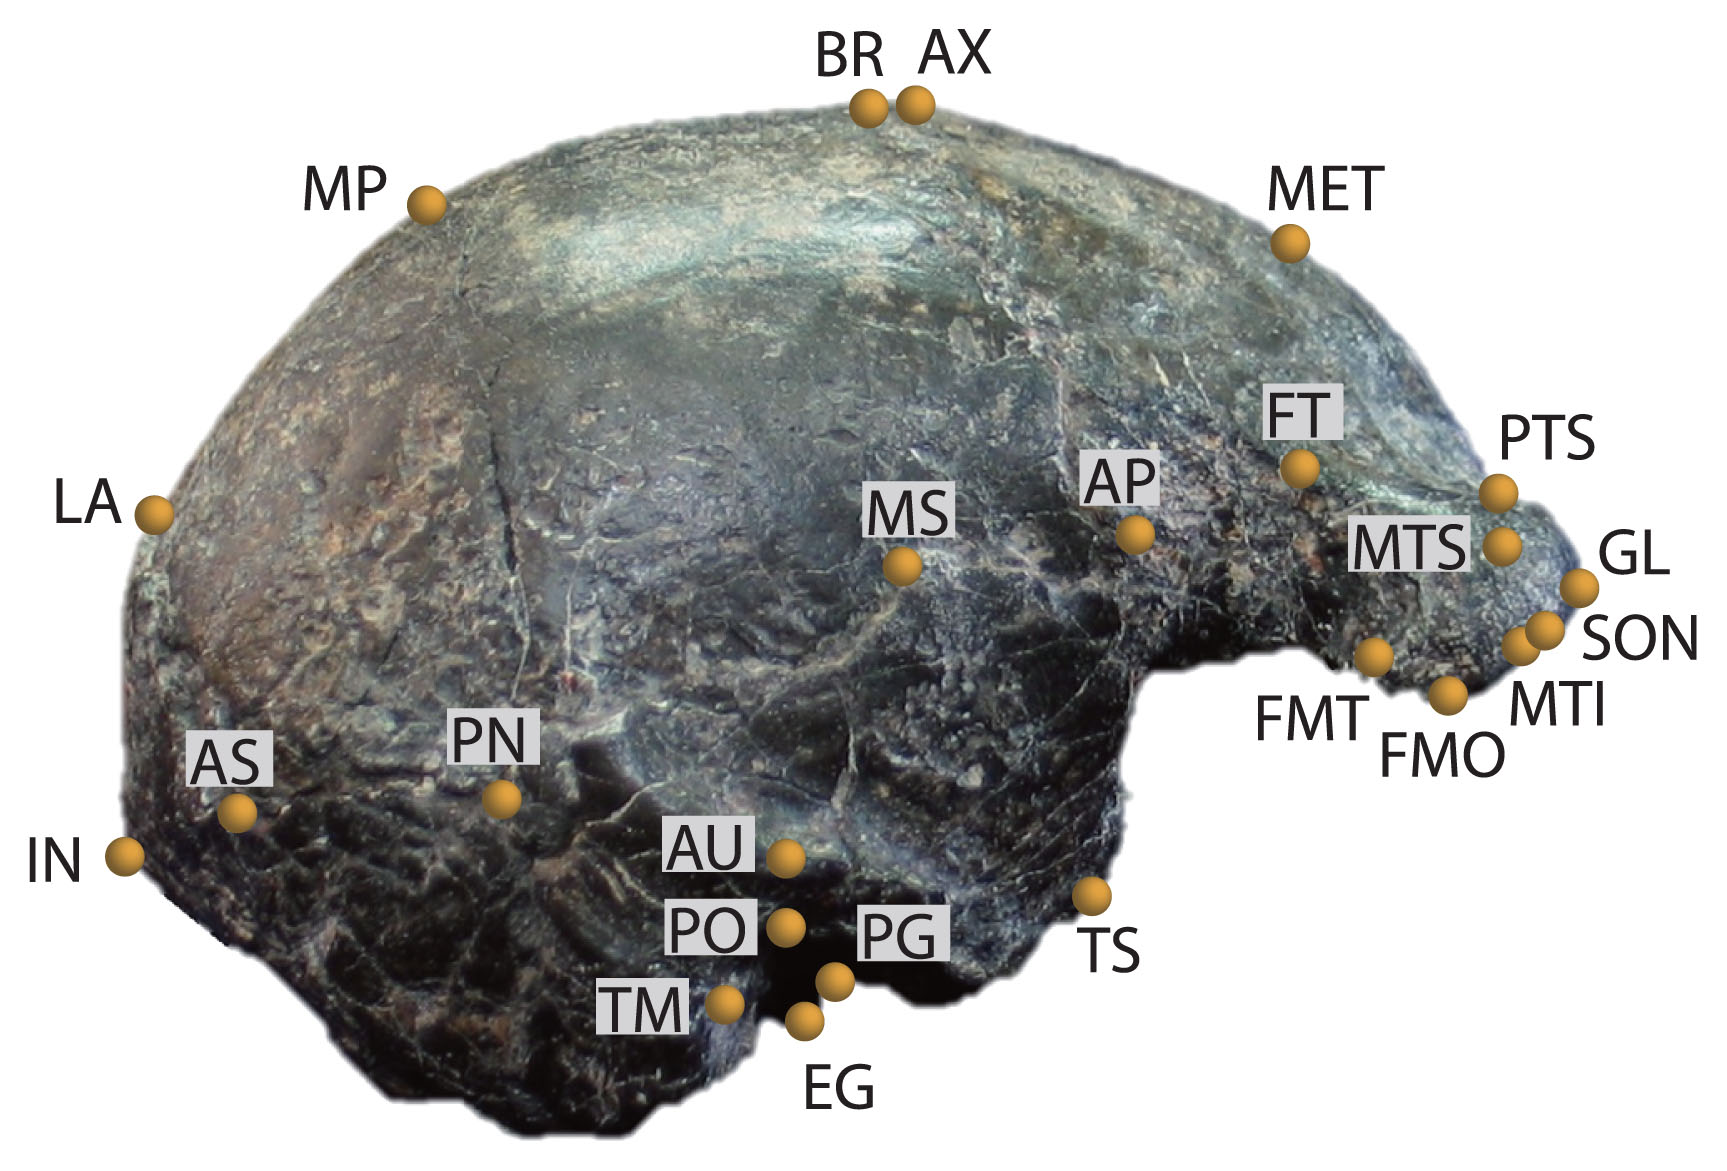
Right lateral view of Sambungmacan 4 with all landmarks utilized in this study labeled. Landmark definitions and details of which landmarks were used in each analysis are in Table 3.
| Landmark set | Fossils Indonesia | China | Georgia | Africa | Landmarks |
|---|---|---|---|---|---|
| Original | Early: Sang 17 Late: Ng 6, 11, 12, Sm 3, 4, Ngawi | Zkd 3, 5, 11, 12 | D2280, D2700, D3444 | KNM-ER 3733, 3883 | IN, LA, BR, PTS, GL, SON, FMT, FMO, MTI, MTS, AP, PO, AU, FT, PN, AS, TM, EG, TS, MET, MS, MP |
| Sangiran 2 and Sambungmacan 1 | Same as Original + Sang 2, Sm 11 | Not included | Not included | Not included | Same as Original − PTS, GL, SON, MTI, MTS, MET |
| Ngandong | Same as Original + Ng 7, 102 | Not included | Not included | Not included | Same as Original − FMT, FMO, AP, MS |
| Skull IX | Same as Original + Skull IX, Ng 7 | Not included | Not included | Not included | Same as Original − GL, FMO |
| Posterior Neurocranium | Early: Sang 2, 10 and 17, Skull IX Late: Ng 6, 7, 10, 11, 12, Sm 1, 3, 4 | Zkd 3, 5, 11, 12 | D2280, D2700, D3444 | KNM-ER 3733, 3883, KNM-WT 15000 | IN, LA, BR, AP, AU, PN, AS, PG, TS, MP |
| Sangiran 4 | Same as Posterior Neurocranium + Sang 4 | Same as Posterior Neurocranium − Zkd 5 | Same as Posterior Neurocranium | Same as Posterior Neurocranium | Same as Posterior Neurocranium − BR, AP, MP + AX |
The ‘Original Analysis’ primarily optimizes landmark coverage. This landmark protocol captures cranial vault morphology including the midline profile from glabella anteriorly through inion posteriorly, supraorbital torus shape, and the lateral temporal bone on the cranial base. The sample included fossils from Indonesia, China, Georgia, and Africa. For this landmark set, both the full sample and a subsample of just Indonesian fossils were subjected to analysis.
Three additional variants on this analysis were performed to allow for the inclusion of Sang 2 and Sm 1 (‘Sangiran 2 and Sambungmacan 1’), Ng 1, 7 and 10 (‘Ngandong’) and Skull IX (‘Skull IX’). Skull IX (Sangiran IX; Tjg-1993.05) was originally described in 2002 by Arif et al. (2002) and more recently subjected to micro-CT scanning and reconstruction by Kaifu et al. (2011b). Data were collected on a surface rendering of the reconstructed specimen. For these three analyses, a small number of landmarks were excluded from the original landmark protocol to account for preservation issues in these fossils (Table 3). These modifications were significant as the sample sizes for both the early and late Indonesian fossils were expanded considerably, making this analysis more comparable to those of Kaifu and colleagues based on linear and character data (Kaifu et al., 2006, 2008, 2011b, 2015). Only the Indonesian fossils were analyzed for these smaller landmark protocols. The final analysis focuses on the posterior neurocranium in order to analyze an additional early Indonesian fossil, Sang 10, which lacks the frontal bone and much of the cranial base. A modified version of the posterior neurcranial landmark set was evaluated to include Sang 4 (‘Sangiran 4’). All thirteen Indonesian H. erectus fossils examined in this study were included in the ‘Sangiran 4’ analysis. Both the full sample and the Indonesian subsample were analyzed for the posterior neurocranium landmarks.
For each analysis, the 3D landmarks (more specifically, the x, y, z coordinates for all landmarks) were subjected to a generalized Procrustes analysis (GPA) to optimally superimpose the corresponding landmarks (Gower, 1975; Rohlf and Slice, 1990; Baab et al., 2012). The GPA process first translates all specimen landmark configurations centroids to a common location, scales each to unit centroid size (CS), then rigidly rotates them to minimize distance among corresponding landmarks jointly across all landmarks. It is possible in this process to separate the symmetric and asymmetric components of shape, and only the symmetric component as calculated by the MorphoJ software program (Klingenberg, 2011) was used here. Therefore asymmetries due to both biological and taphonomic processes were excluded from the analysis. The symmetric component of superimposed coordinate data (shape variables) for each landmark set were subjected to a principal components analysis (PCA). The first PC reflects the direction of maximum shape variation in the data, with each subsequent PC oriented to capture the direction of maximum shape variation orthogonal to preceding components. The PC ordinations are presented, along with wireframes that summarize the shape differences captured by each component. The proportion of shape variance accounted for by each component is reported in the figure captions.
It is important to recognize that scaling all landmark configurations to unit CS as part of the superimposition process means that interpretation of shape difference is relative to overall size. For example, if a specimen is described has having a taller vault, this may or may not be true in terms of linear dimensions (e.g. opisthion–basion length), but is true relative to overall vault size. Two specimens that are isometric variants of one another differing not in shape but only in size would plot in the same position in a PC ordination. It is possible to evaluate the effect of size on shape by regressing either the shape variables themselves or PC scores on a size variable. Centroid size for each specimen (defined as the square root of the sum of squared distances of the centroid to each landmark) is generated during the GPA and can be utilized for this type of analysis. While CS is frequently used as a proxy for cranial size, this practice has a drawback in this particular context. Cranial superstructures, as well as cranial vault thickness influence CS as landmarks are positioned on the surface of these structures (e.g. glabella and the midtorus landmarks on the supraorbital torus) but are not generally considered as part of overall cranial size. An alternative to using CS as a scaling variable is to use endocranial volume (EV). While EV avoids the issue of superstructures, it is not available for specimens with poor preservation of the vault and there is error associated with estimating EV, particularly for partially preserved calvaria (e.g. Ng 10). Despite these potential issues, EV was used for the scaling variable in this study and the EV for each fossil is reported in Table 1.
It is also important to note that while landmarks are localized on specific features, a difference in the position of that landmark between specimens (or groups) may or may not be attributable to a direct change in the size/orientation of that feature. For example, a more inferiorly positioned entoglenoid landmark may be due to a relatively larger and more inferiorly projecting entoglenoid process or to a relative enlargement of the entire temporal bone that pushes the region containing the entoglenoid inferiorly even without any change to the process itself. There are often clues in the surrounding morphology that make certain scenarios more likely (e.g. comparing the position of other temporal base landmarks in the example above), but these are not always simple to discern. Therefore, discussion of differences in landmark position should not necessarily be read as differences in that localized structure.
In addition to evaluating scaling effects, PCs were also regressed on geochronological age to assess shape trends through time. Due to substantial disagreement concerning the age of the Ngandong and Sambungmacan fossils (see Introduction), two sets of dates were used that bracket current proposals: one in the Middle Pleistocene (546 ka—the oldest age included in Indriati et al.’s (2011) preferred range) and one in the later Pleistocene (40 ka—the youngest age indicated by Yokoyama et al.’s (2008) analysis). It remains possible that Sambungmacan fossils are of greater antiquity (Matsu’ura et al., 2000), a possibility not evaluated here. The Ngandong, Sambungmacan, and Ngawi fossils are treated here as synchronous with the recognition that this may not be correct. Therefore, the results of the diachronic assessment are exploratory and should be interpreted cautiously.
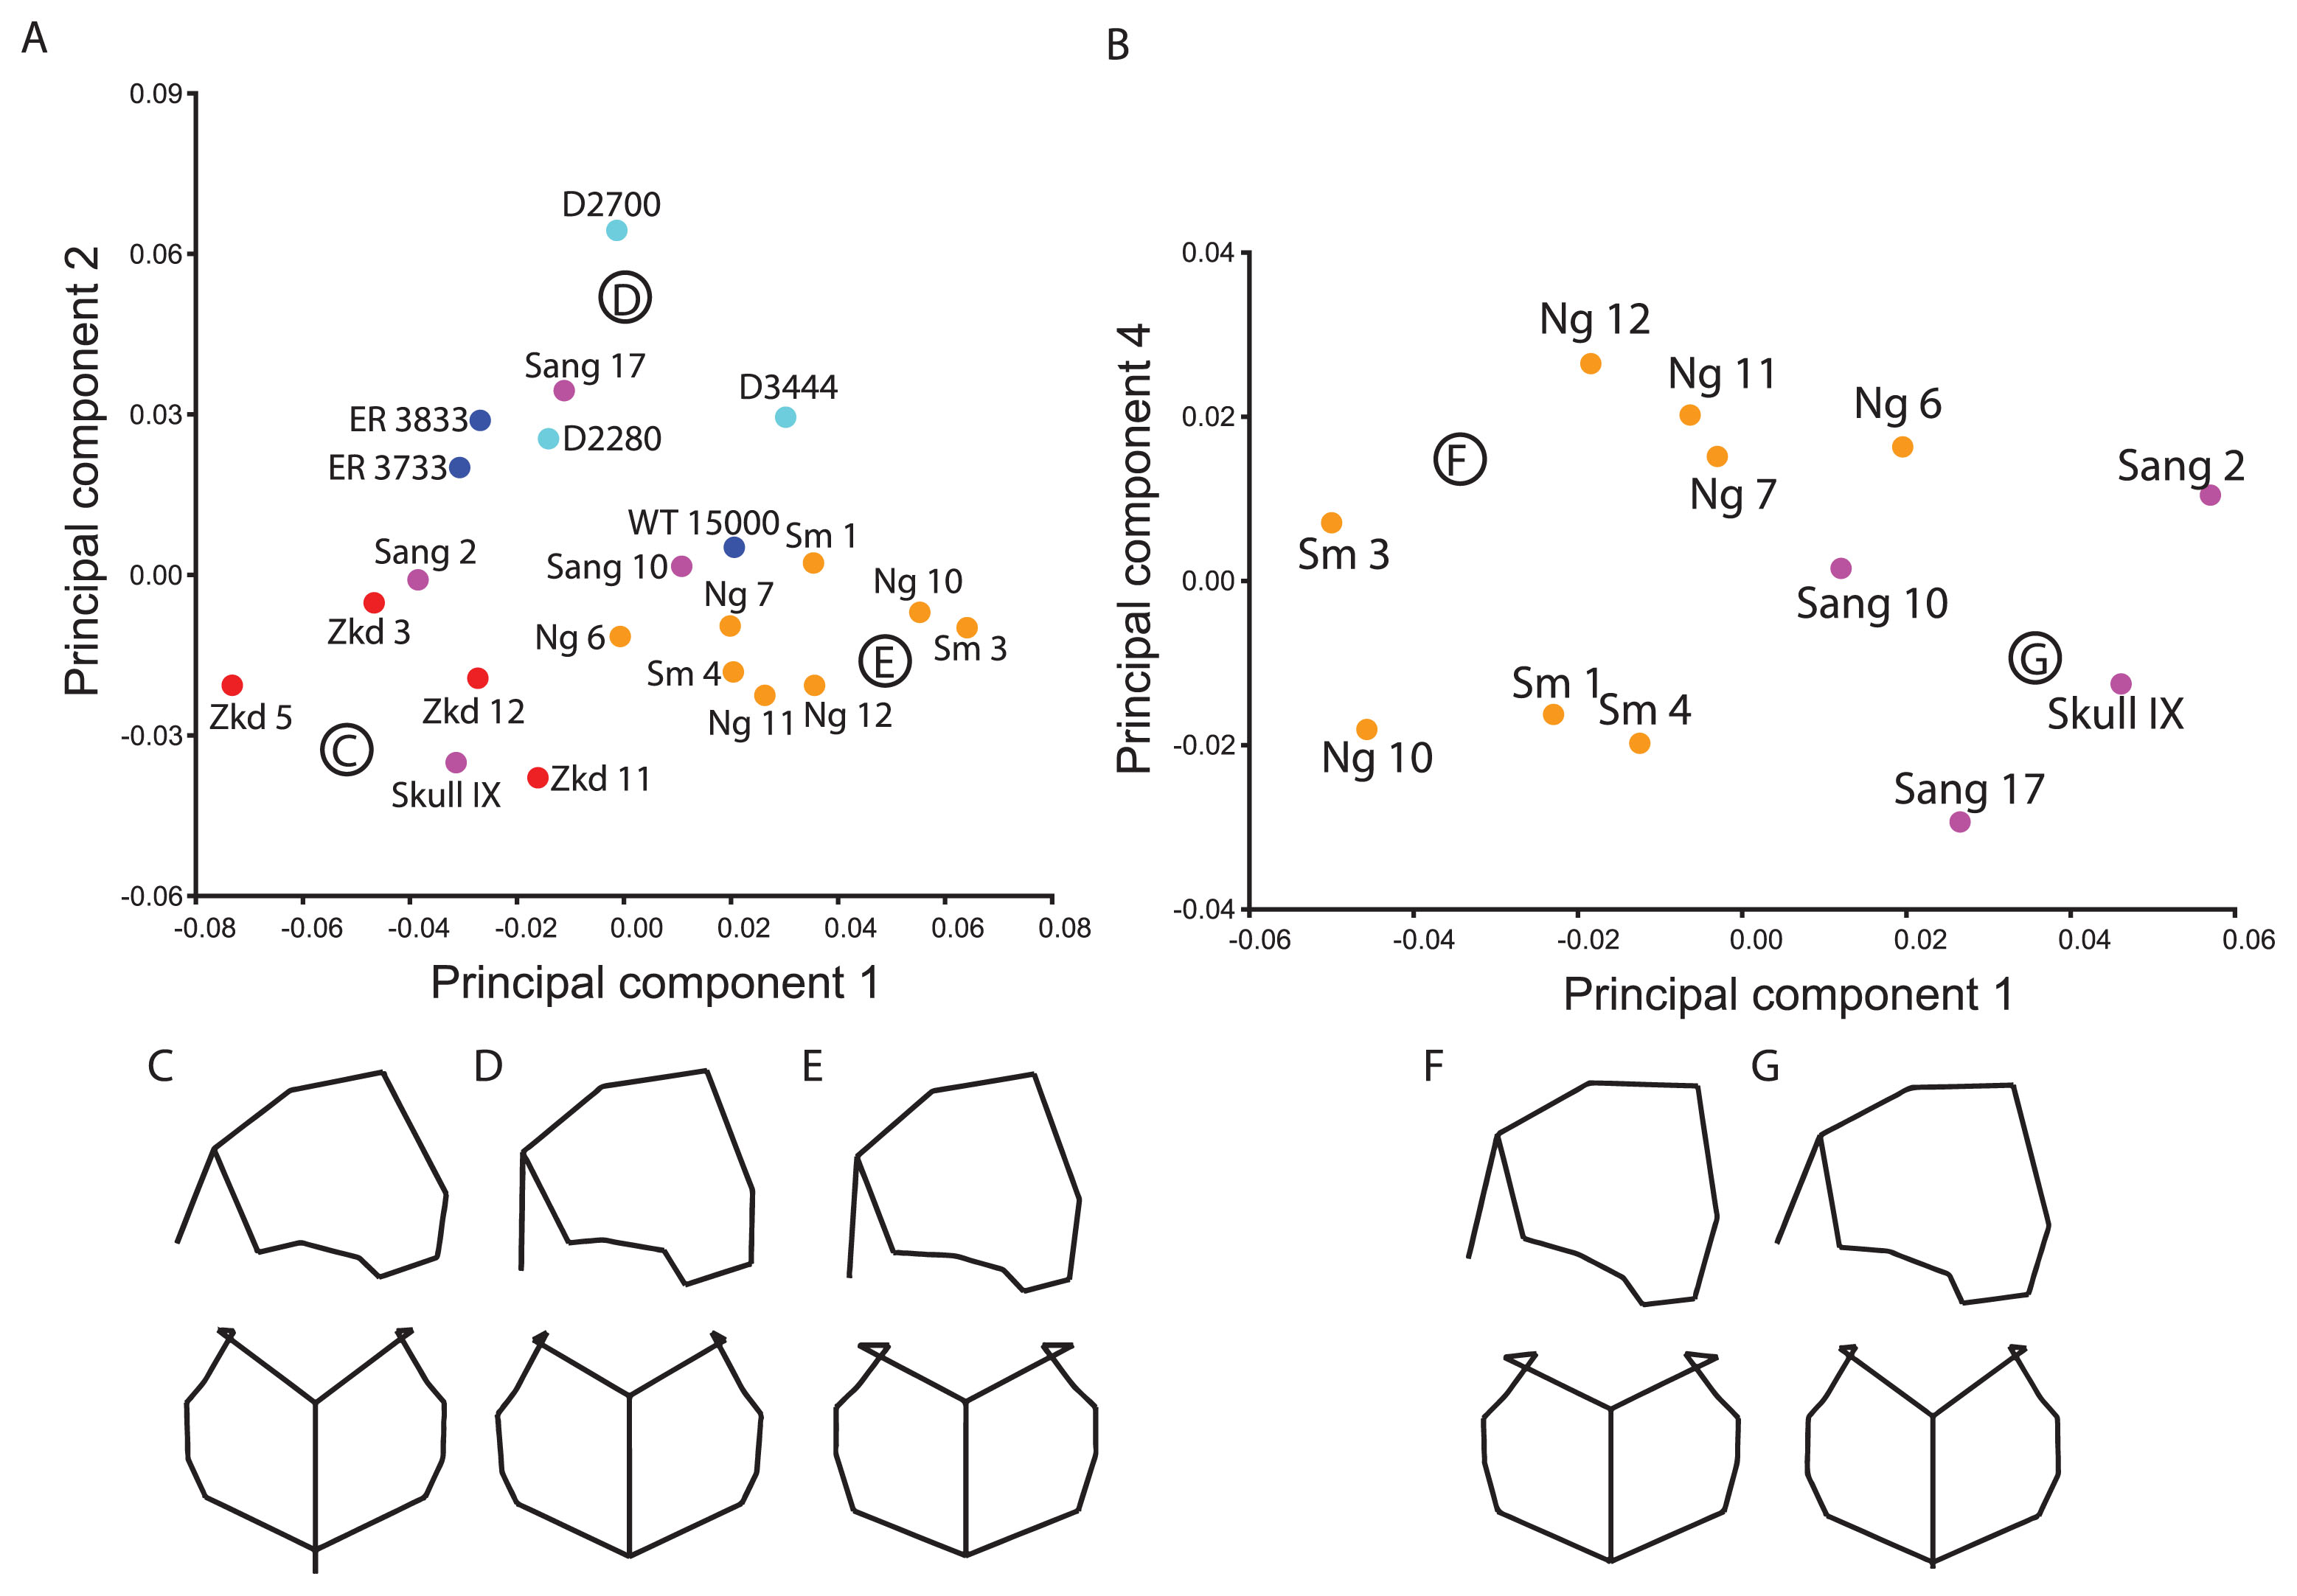
The analysis was first run with the H. erectus samples from Indonesia, China, Africa, and Georgia (Figure 2a). This landmark set is similar to the ‘Maximum Chinese’ landmark set used in Baab (2010), but also includes a landmark on the temporosphenoid suture as it crosses from the squama to the cranial base. There was separation between western (African/Georgian) and eastern (China/Indonesia) fossils on PC 2. The shape differences relate to the greater constriction at frontotemporale and the more posteriorly projecting inion in the former (Figure 2d), as well as less breadth across the midvault, a wider (mediolaterally) and more arched supraorbital torus, and a more inferiorly projecting entoglenoid region.
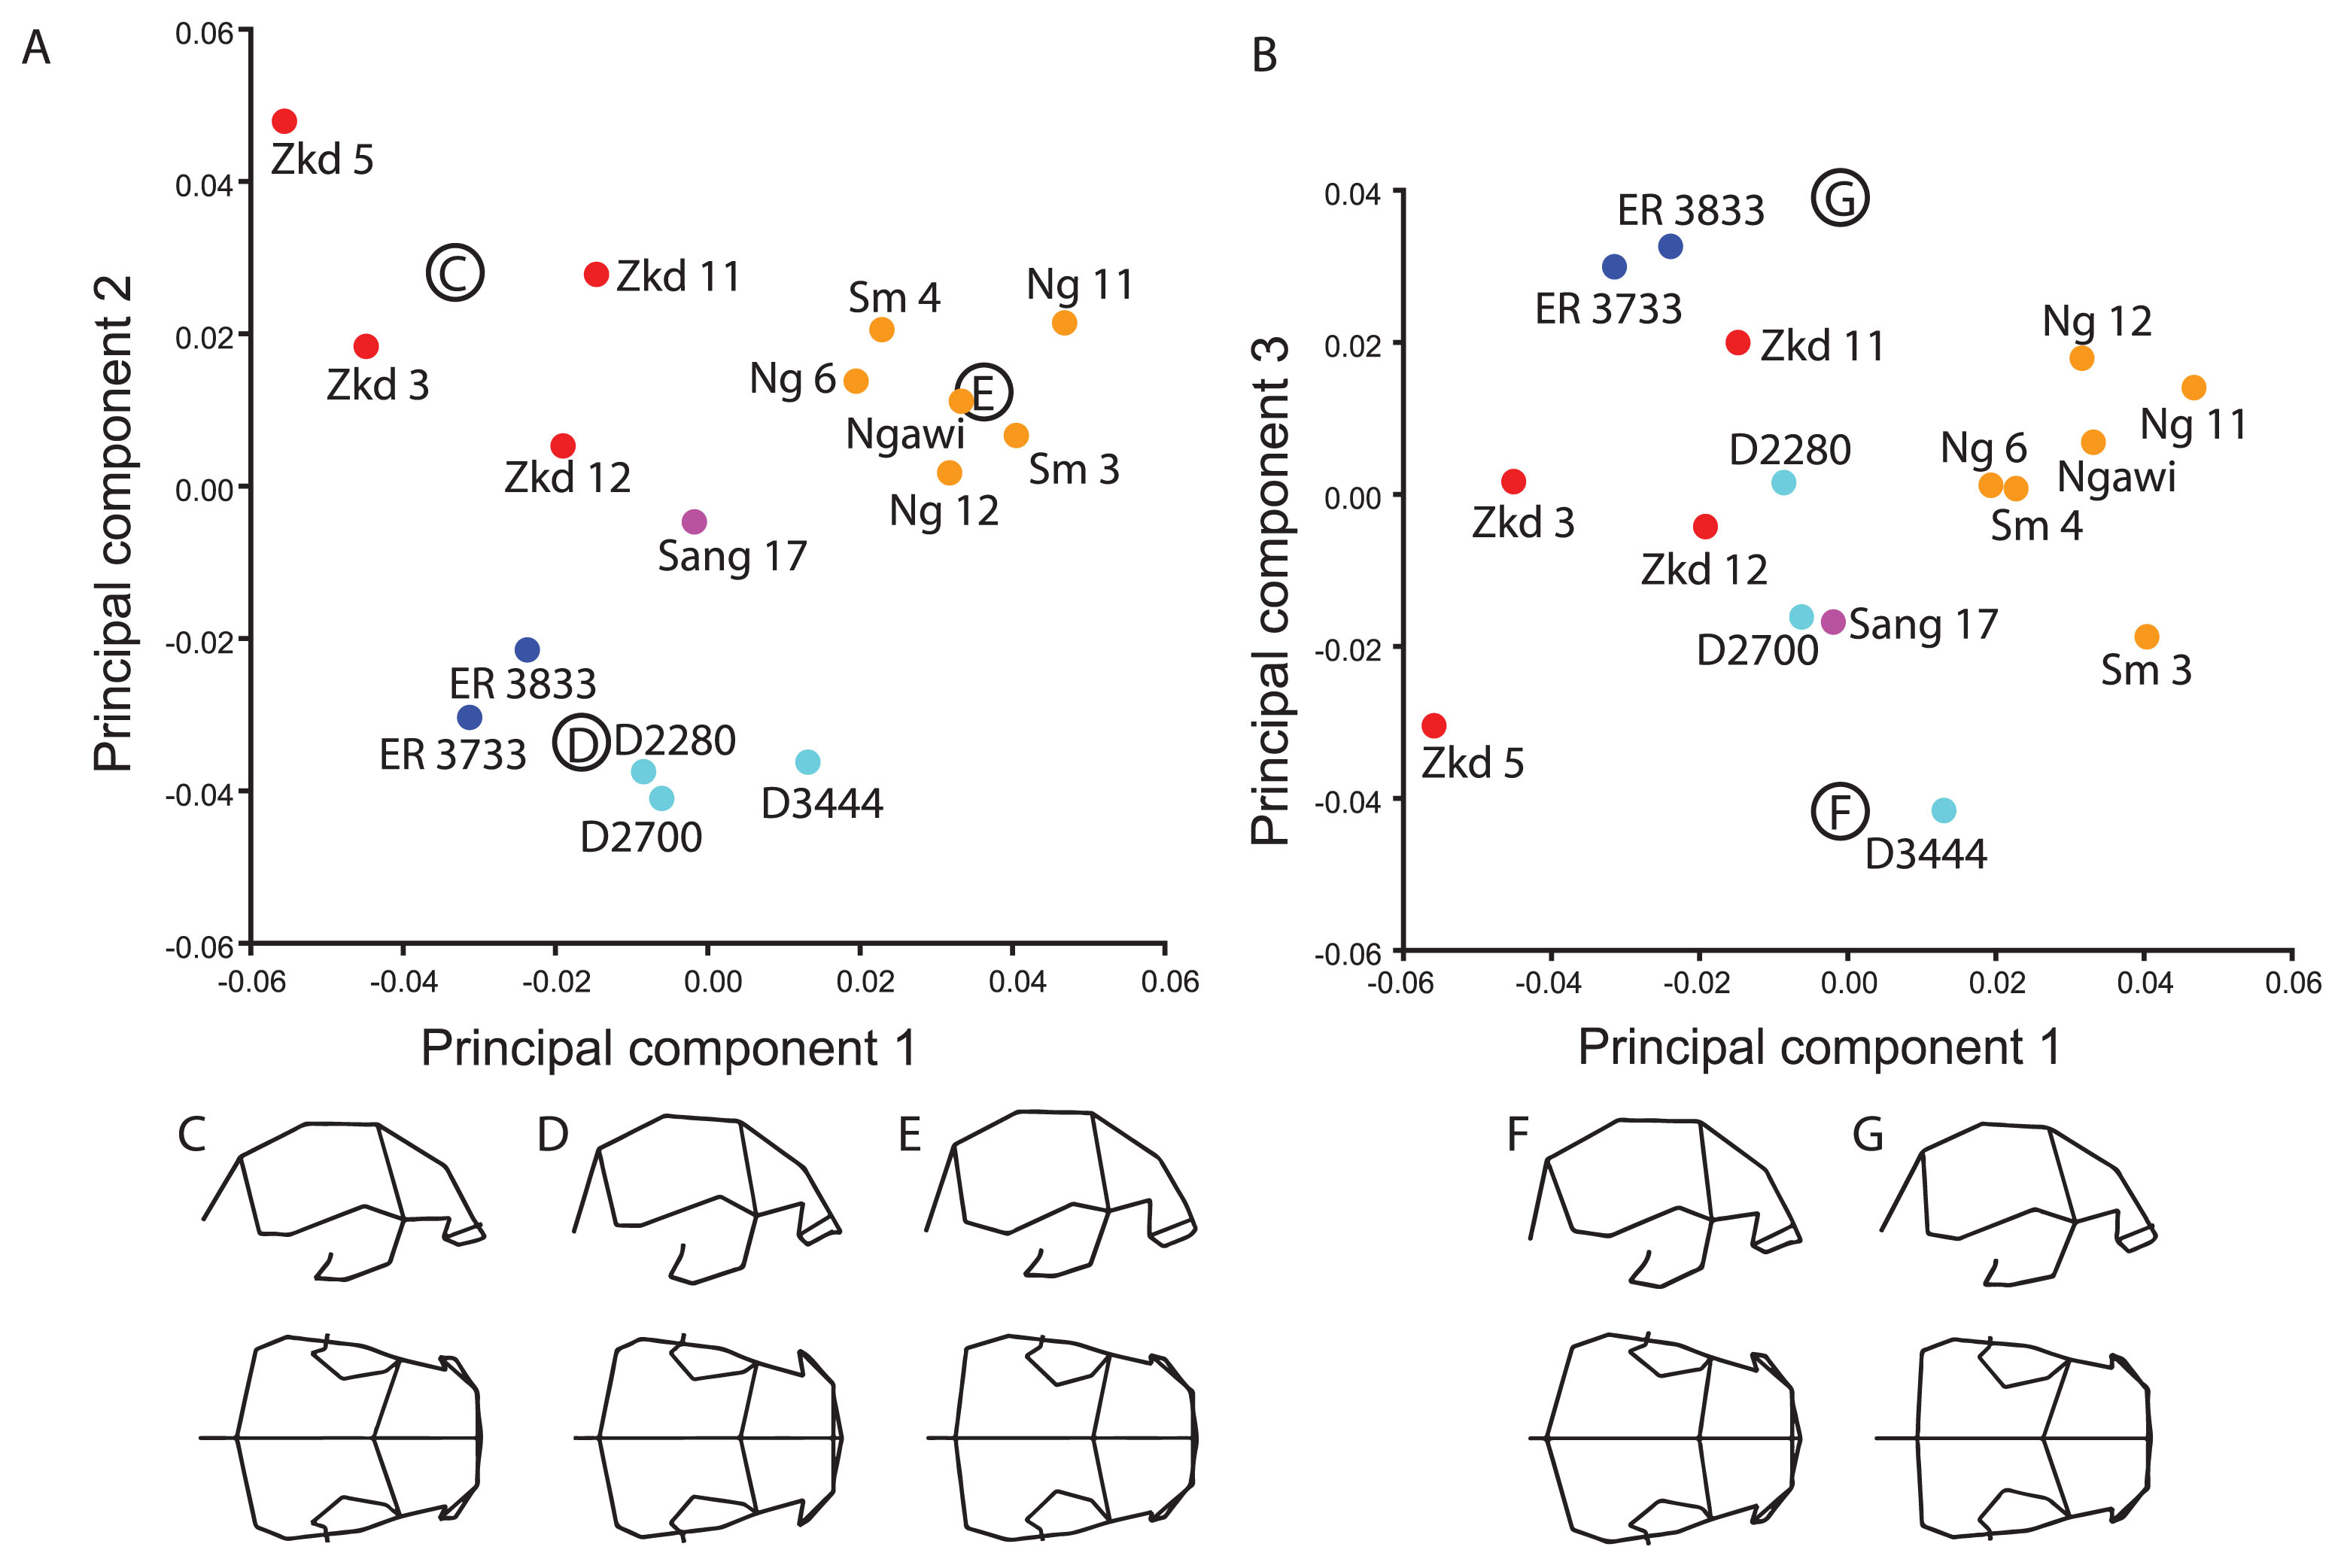
Principal components ordination and associated shape changes for ‘Original’ landmark set. The ordinations show (A) PC 1 (25.9% of total shape variance) and PC 2 (18.9%) and (B) PC 1 and PC 3 (11.7%). Shapes associated with the (C) Zhoukoudian, (D) African/Georgian and (E) late Indonesian groups, as well as the (F) negative and (G) positive ends of PC 3 are shown in right lateral and superior views. Lines connecting the landmarks (wireframes) are for visualization purposes only and do not represent actual data.
The first component highlights variation within the western and eastern samples: the later Indonesian sample differs in the same direction from Chinese fossils as does the Georgian from the African, although there is much greater spread within the Asian sample along this component. The Georgian and later Indonesian fossils (Figure 2e) are distinguished by their taller and anteroposteriorly shorter vaults, greater breadth across the midvault and frontotemporale, elongated parietomastoid suture, and taller supraorbital tori. S 17 from Sangiran is positioned close to the center of the plot, and is thus intermediate between the older African/Georgian and Asian fossils as well as between the Chinese and Indonesian samples in these aspects of shape. It is the later Indonesian fossils that are most isolated along this component.
Zkd 3 and particularly Zkd 5 occupy an extreme position in the subspace spanned by PCs 1 and 2. The nature of the Zkd 5 reconstruction may account in part for its extreme position in this ordination (Baab, 2016b). This specimen has a large fragment consisting of the supraorbital torus, much of the frontal squama and smaller parts of the parietal and greater wing of the sphenoid that does not directly articulate with the posterior vault (Qiu et al., 1973; Wu et al., 2010). Yet all the Zhoukoudian fossils differ in having a posteriorly projecting inion and inferiorly positioned frontotemporale (Figure 2c) and it is difficult to evaluate whether, and to what extent, the reconstruction may affect its position in shape space.
The third component contrasts the Koobi Fora H. erectus sample at one end of the axis with D3444, Sm 3, and Zkd 5 at the other end (Figure 2b). The latter fossils have a higher and anteroposteriorly shorter vault with a more vertical occipital plane (or less-developed occipital torus), a long parietal squama in the median plane and a thicker supraorbital torus at the zygomaticofrontal suture (Figure 2f, g). The three Ngandong fossils score higher than the two Sambungmacan and Ngawi fossils along this axis, although it is Sm 3 that is most distinct from all other late Indonesian specimens on PC 3.
The analysis was re-run with only the Indonesian fossils. Sang 17 was clearly differentiated from the later Indonesian fossils on the second PC, while the Ngandong fossils scored lower than Ngawi and the Sambungmacan fossils on PC1, with Ng 6 particularly distant from the rest. The results were generally similar to those presented below in the ‘Ngandong’ analysis, and given the larger sample size in that analysis, the results are not presented here.
Sangiran 2 and Sambungmacan 1 analysisResults are reported for only the Indonesian fossils. It was possible to evaluate both Sang 2 and Sm 1 in the analysis by excluding landmarks from the central part of the frontal bone (glabella, post-toral sulcus, supraorbital notch, midtorus, and metopion). The Sangiran sample differed from the later Indonesian fossils on a combination of PCs 1 and 2, but Sang 17 was more similar to the Ngandong/Sambungmacan/Ngawi fossils than was Sang 2, which was quite distinct (Figure 3a). In general, the later group had a more vertical occipital plane, broader frontal bone, higher temporal squama, more posteriorly positioned anterior temporal squama, and long parietomastoid suture. Within the later Indonesian sample, the Ngandong hominins score lower on PC 2 and higher on PC 3 than the Sambungmacan/Ngawi as well as the Sangiran hominins. The Sangiran hominins are further distinguished from each other on PC 3 where Sang 17 in particular scored lower than all other hominins due to its low vault with more of the vault height inferior to the temporal squama than above, a more inferiorly projecting entoglenoid process and laterally positioned temporal base (entoglenoid process, tympanomastoid junction, and temporosphenoid suture as it crosses from the base to the wall of the vault).
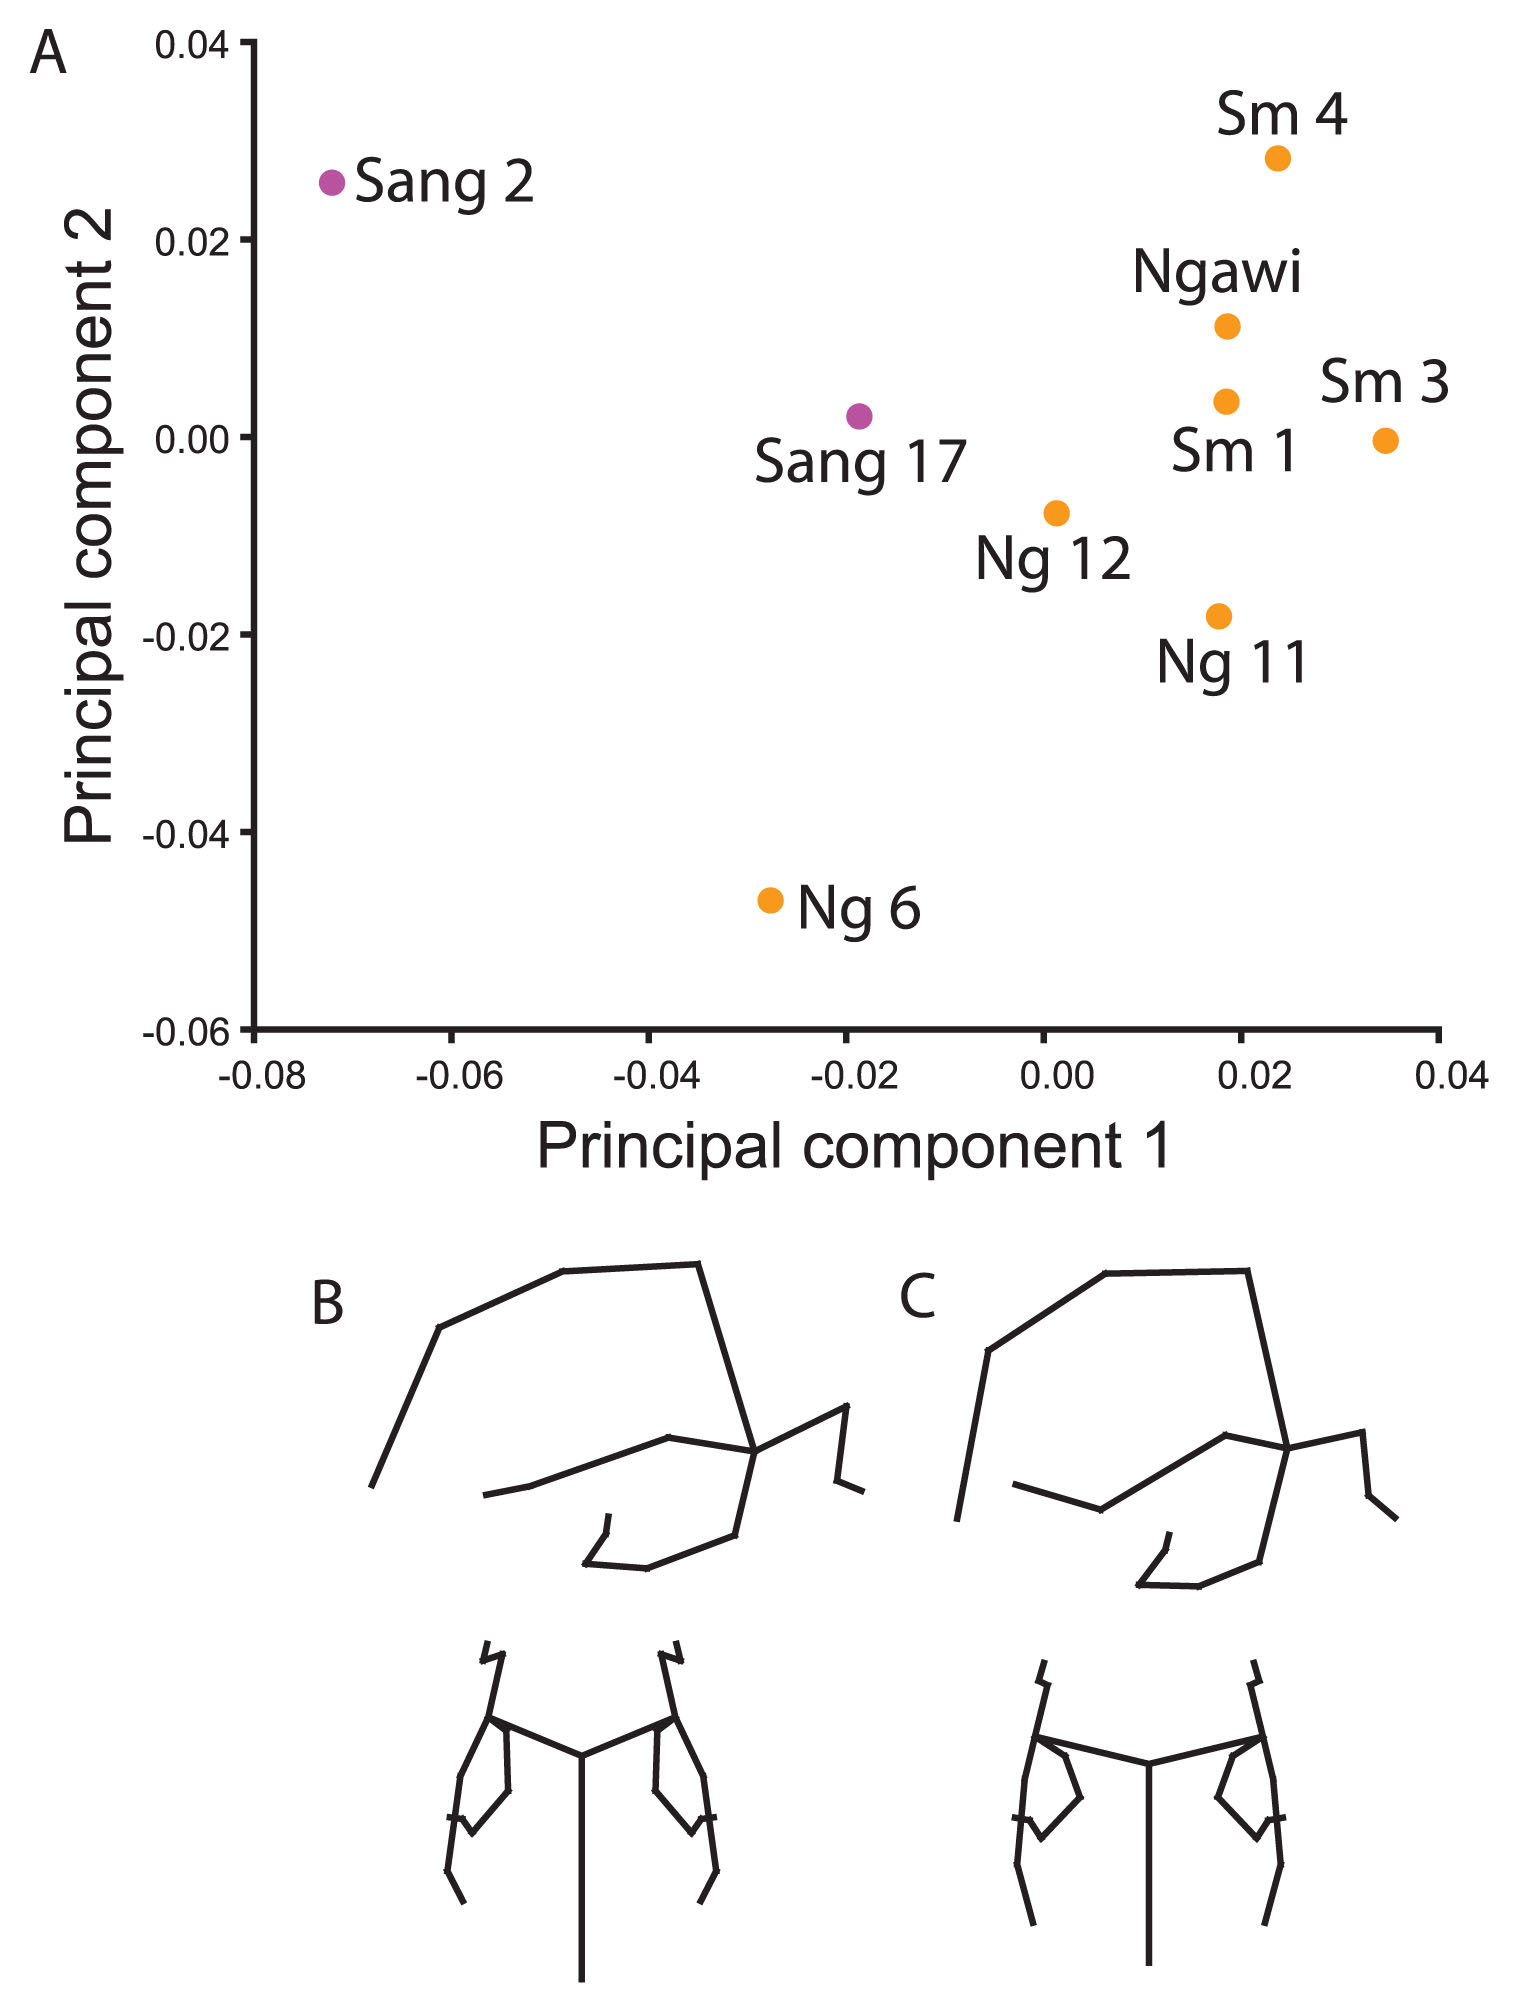
Principal components ordination and associated shape changes for ‘Sangiran 2 and Sambungmacan 1’ landmark set. (A) The ordination shows PC 1 (36.7%) and PC 2 (16.9%). Shape differences from the (B) negative to the (C) positive end of PC 1 are shown in right lateral and superior views. This contrasts Sang 2 with the rest of the Indonesian fossils, particularly the younger group.
Although not figured, when H. erectus fossils from other regions are included in this analysis, Sang 2 clusters with the Zhoukoudian hominins (see also Baab, 2010). This result is driven by a lower neurocranium with a relatively narrow anterior vault, more posteriorly projecting inion, and a lower temporal squama in Sang 2 than in the later hominins and Sang 17.
Ngandong analysisThe exclusion of the lateral supraorbital torus landmarks as well as anterior pterion and mid-temporal squama allowed for the addition of two more calvaria from Ngandong: Ng 7 and 10.
In the subspace spanned by the first two components, S 17 is isolated from the later Indonesian hominins by consequence of scoring low on the first axis (Figure 4a). The later Indonesian hominins differ from S 17 in their relatively anteroposteriorly shorter and taller vaults, wider anterior vaults (at pterion), less projecting glabella, and longer parietomastoid sutures (Figure 4b, c). Variation within the later Indonesian group contrasts most Ngandong hominins (particularly Ng 6 and 11) with the Sambungmacan hominins (particularly Sm 3). Ng 7 and Ngawi occupy intermediate positions between the Sambungmacan and other Ngandong fossils. The shape differences within this group are of a similar scale to those seen on PC 1 (PCs 1 and 2 account for 25.0% and 22.2% of total shape variance, respectively). The lower-scoring Sambungmacan fossils have an anteroposteriorly shorter and more rounded vault in lateral view, as well as a relatively wider anterior and mid-vault. In addition, frontotemporale is in a more inferior position and the parietomastoid suture is more obliquely oriented (rather than horizontal) (Figure 4d, e).
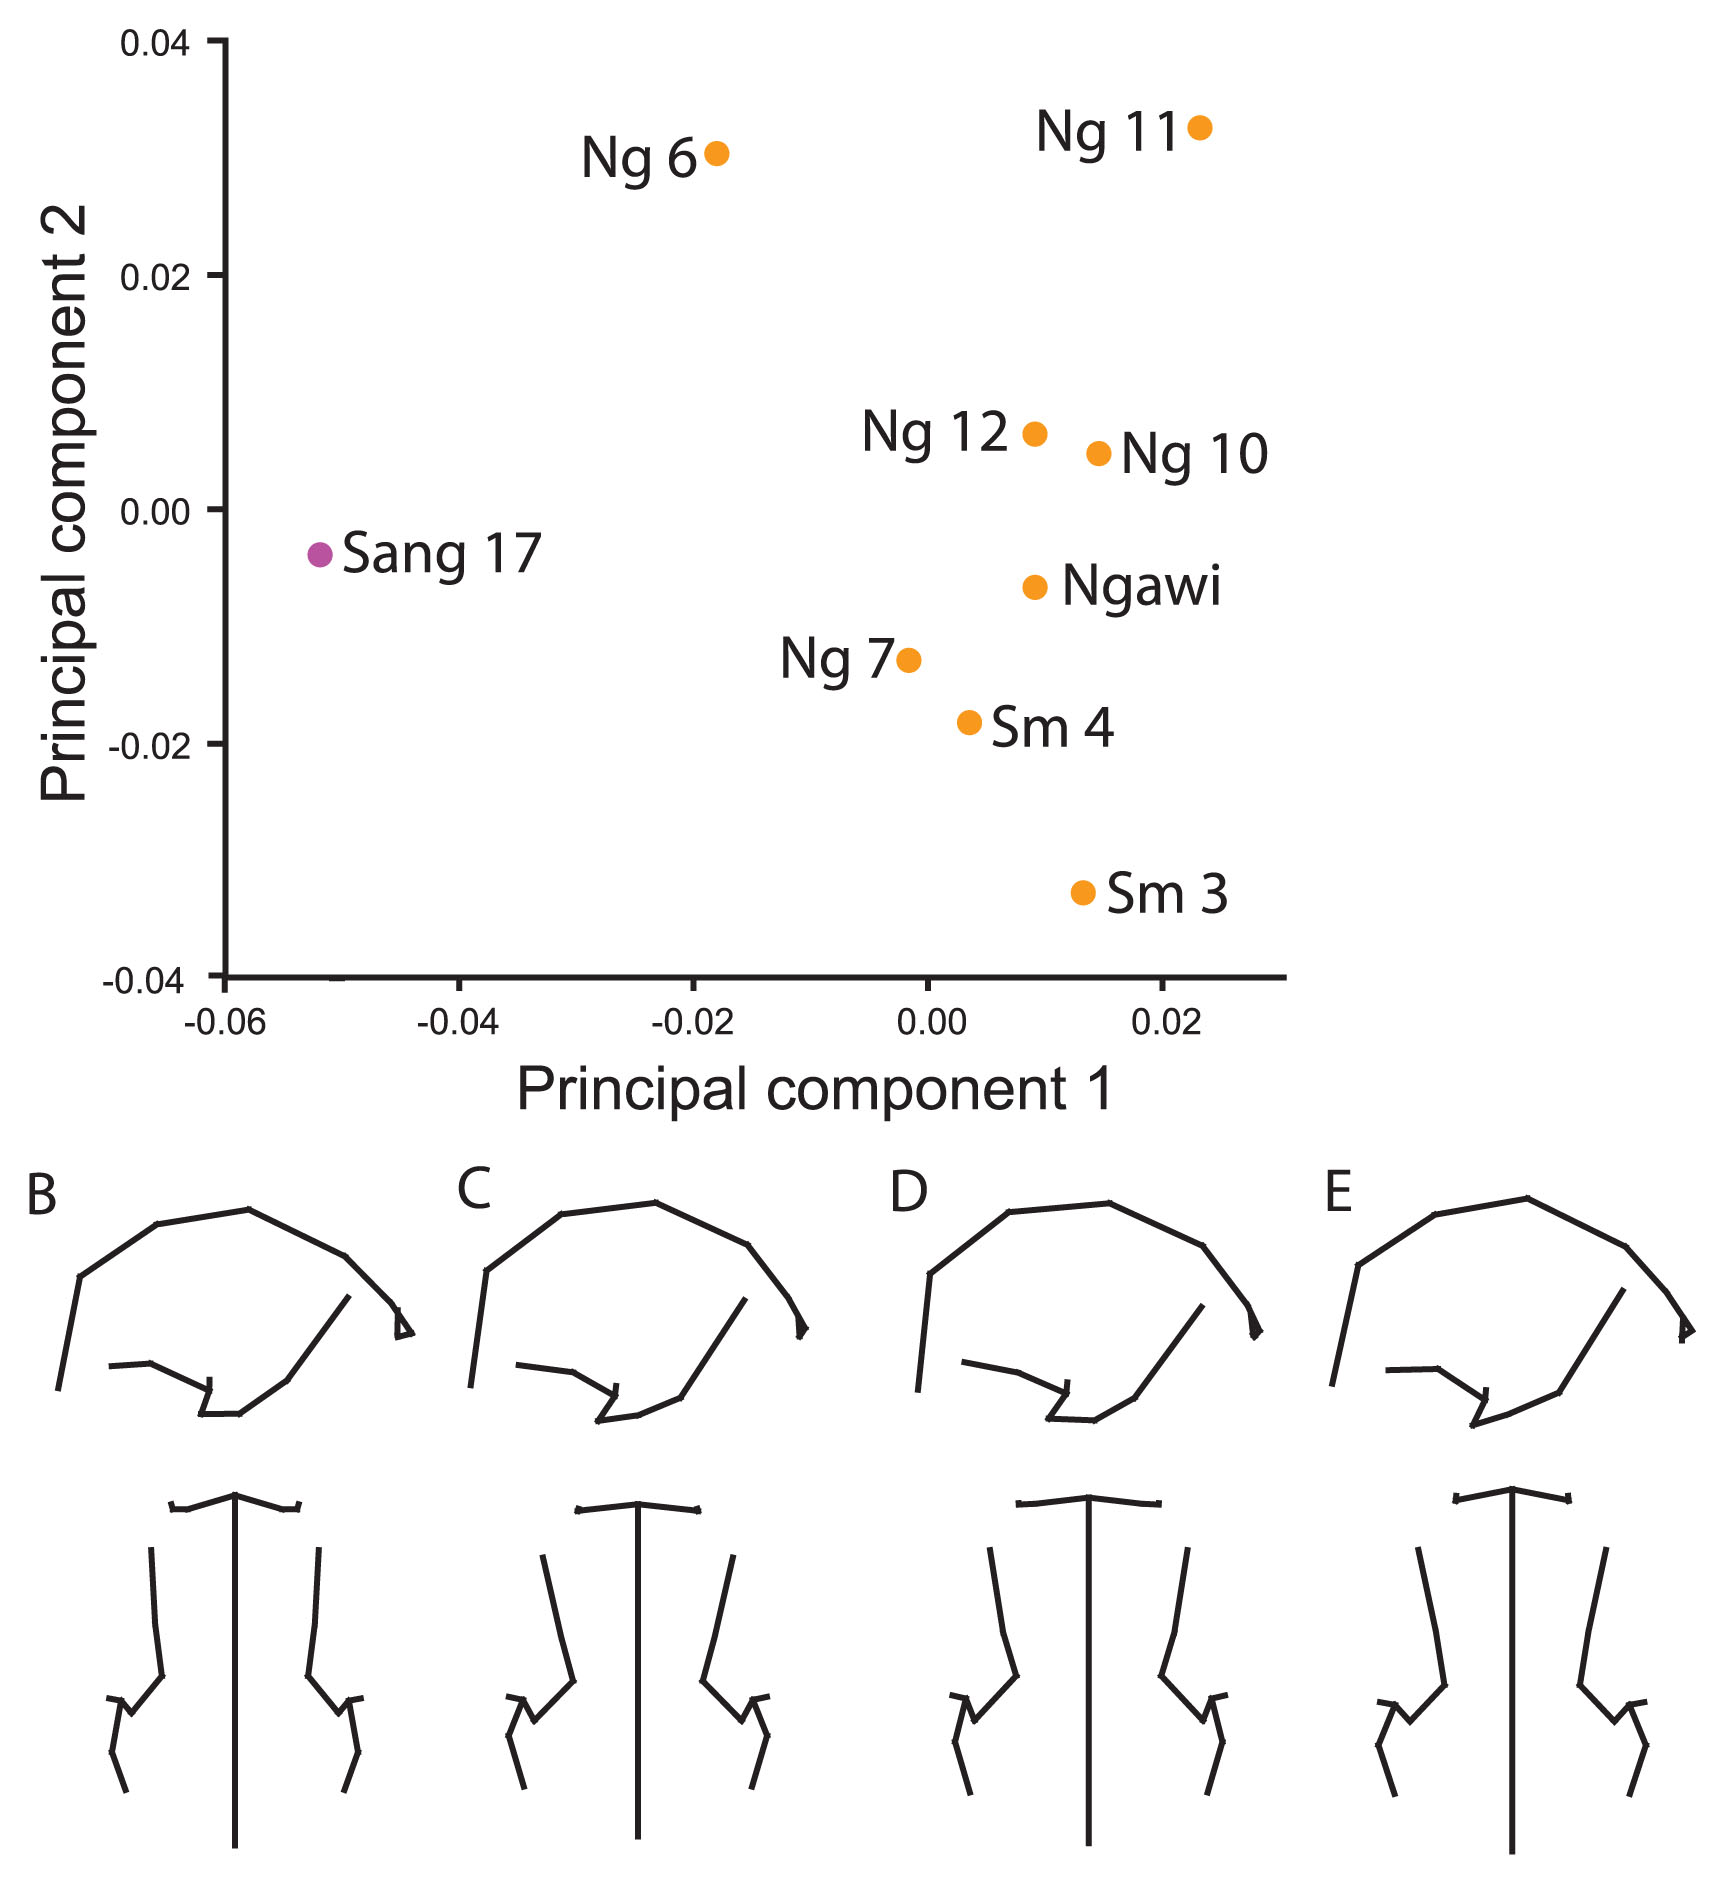
Principal components ordination and associated shape changes for ‘Ngandong’ landmark set. (A) The ordination shows PC 1 (25.0%) and PC 2 (22.2%). Shapes representing the contrast the negative (B) and positive (C) ends of PC 1, which reflect some of the differences between S17 and the later Indonesian H. erectus group, respectively, are shown in right lateral and superior views, as are contrasts between the negative (D) and positive (E) ends of PC 2, which reflect variation within the later Indonesian group.
To include the Skull IX fossil from Sangiran, the frontomalareorbitale and glabella landmarks were dropped from the original set of landmarks. Analysis of the full sample yields three main clusters in the subspace of PCs 1 and 2: African/Georgian, late Indonesian, and Chinese/Skull IX. Sang 17 is situated approximately equidistant to the three groups. Shape differences among these groups are much as described for the ‘Original’ analysis.
When restricted to the Indonesian fossils only, the result is very similar to that presented above in the ‘Sangiran 2 and Sambungmacan 1’ analysis with Skull IX falling quite far from the other Indonesian fossils, as did Sang 2 (Figure 5a). Sang 17 again plotted closer to the later Indonesian fossils and away from the other Sangiran skull. This is due to the longer, narrower vault and lower profile anteriorly coupled with a supraorbital torus that is taller at mid-orbit and a lower temporal squama of Skull IX (Figure 5b, c). The frontal squama is more obliquely oriented anteroposteriorly (less vertical), more constricted across anterior pterion and frontotemporale, and frontomalaretemporale is more anteriorly positioned. To the extent that the same morphology is analyzed in both analyses, there is correspondence between the features that distinguish both Skull IX and Sang 2 from Sang 17 and later Indonesian hominins. Within the later Indonesian hominins, the Sambungmacan and Ngawi fossils scored lower than the Ngandong hominins, particularly Ng 6, along the second component (Figure 5d, e). In contrast to the ‘Ngandong Landmarks’ analysis, Ng 7 does not overlap the Sambungmacan/Ngawi group, although it is positioned closest to them of the Ngandong hominins. This was due to their anteroposteriorly shorter and wider vaults (with the exception of the posterior vault), and more posteriorly positioned pterion. The third component contrasts Sang 17 from the other hominins.
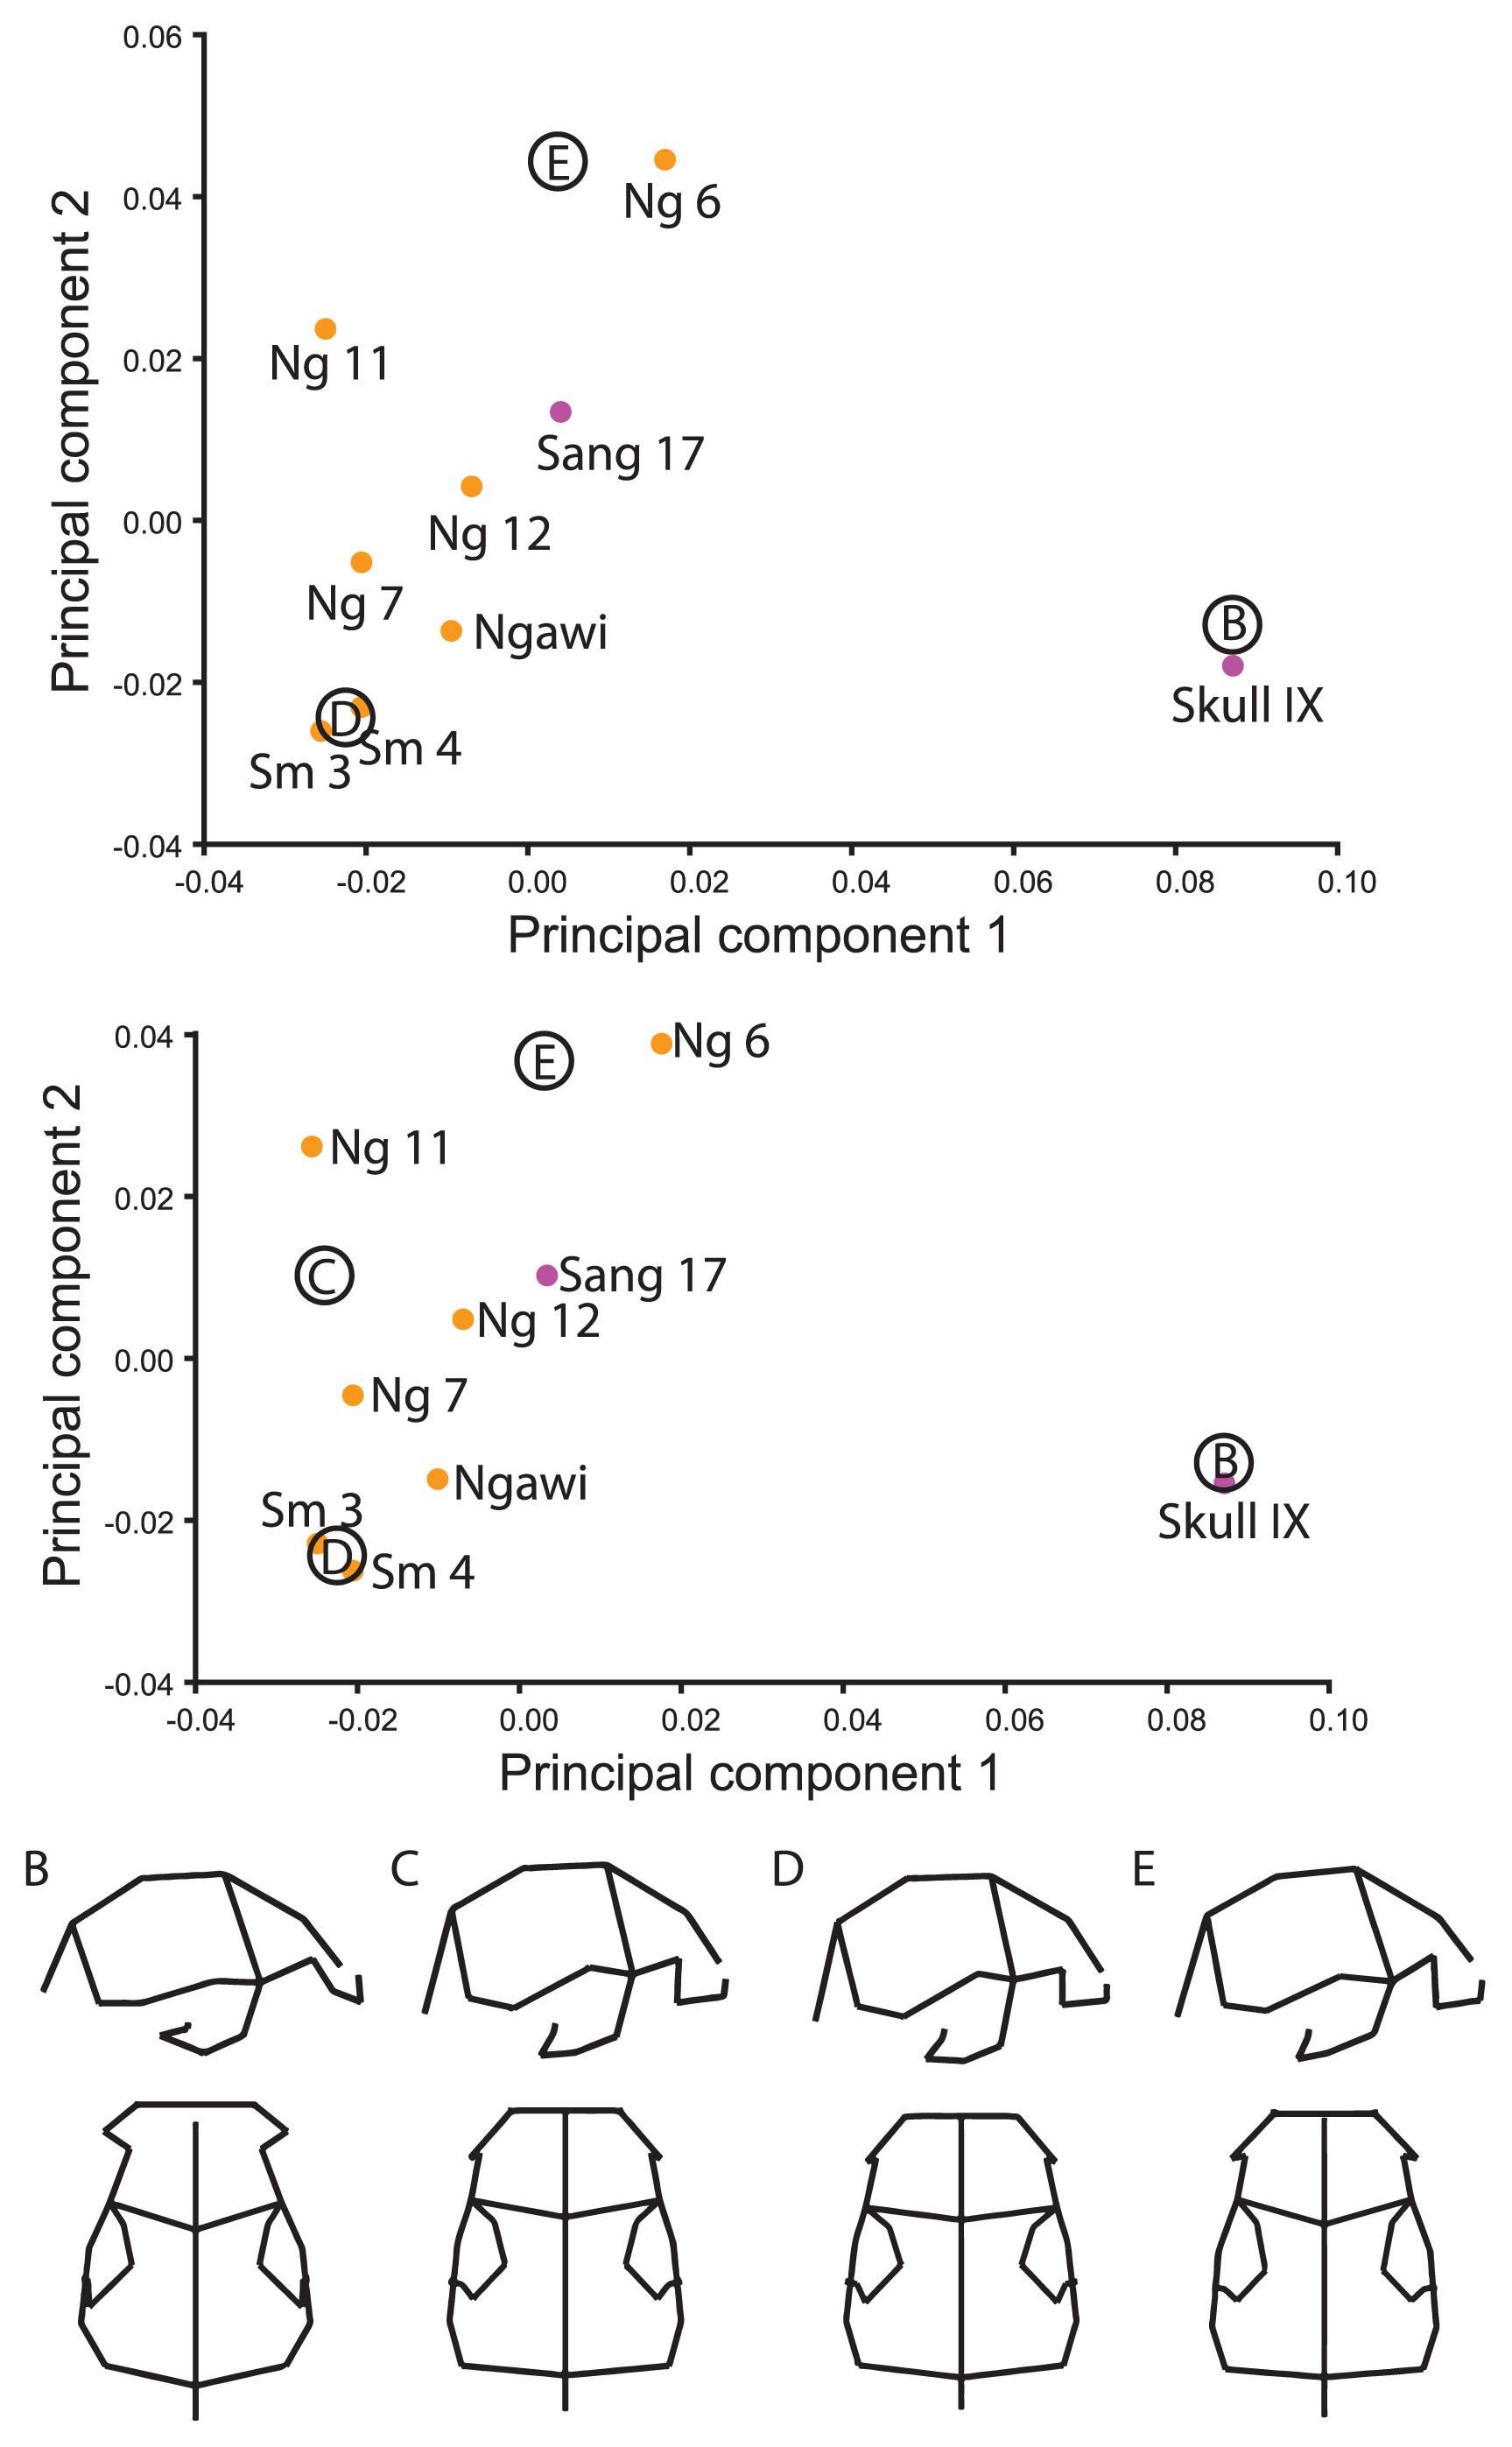
Principal components ordination and associated shape changes for ‘Skull IX’ landmark set. (A) The ordination shows PC 1 (41.0%) and PC 2 (16.1%). Shapes representing the contrast between (B) Skull IX and (C) the rest of the Indonesian sample, as well as between (D) Sambungmacan/Ngawi and (E) Ngandong (particularly Ng 6) samples are shown in right lateral and superior views.
The posterior neurocranium analysis primarily excluded landmarks from the frontal bone, but also porion and midtemporal squama landmarks. However, the sample size for H. erectus is 22 specimens, of which 12 are from Indonesia. The African/Georgian sample is mostly separated from the Asian fossils on the second component, although Sang 17 overlaps the former distribution and WT 15000 is closer to the later Indonesian cluster (Figure 6a). With the exception of Sang 17, the Asian fossils have a relatively shorter parietal bone in the median plane, a more vertical occipital squama, and less inferiorly projecting entoglenoid process and a longer and more inferiorly positioned parietomastoid suture (Figure 6c, e). There is also less breadth across the temporal base (entoglenoid process and temporosphenoid suture). These shape differences are relative to posterior (not overall) neurocranial size.
Principal components ordination and associated shape changes for ‘Posterior Neurocranium’ landmark set. (A) The ordinations show PC 1 (30.9%) and PC 2 (16.1%) for the full sample and (B) PC 1 (34.0%) and PC 4 (10.2%) for the Indonesian-only sample. Shapes corresponding to the major clusters of (C) Zhoukoudian and some Sangiran fossils, (D) African/Georgian fossils and Sang 17 and (E) late Indonesian fossils are shown in right lateral and superior views. The shapes associated with the (F) late Indonesian and (G) Sangiran fossils are also shown based on the Indonesian-only sample.
The first component differentiates the higher-scoring Ngandong/Sambungmacan fossils and Sang 10 from the Chinese and other Sangiran fossils (Skull IX and Sang 2) (Figure 6a). D3444 and WT 15000 likewise score higher than the other Georgian and African fossils as well as Sang 17. The higher-scoring groups are distinguished by their taller vault with a more vertical coronal suture and a longer and more vertical occipital plane, an anteroposteriorly elongated temporal squama with a longer parietomastoid suture, and greater breadth across the pterion (Figure 6d). The third component (not figured) contrasts KNM-ER 3733 from the rest of the sample due to its high score and, with the exception of Ng 10, the Ngandong fossils score higher than the Sambungmacan ones. The Chinese fossils are not distinct on any of the next few components, nor do the early and later Indonesian fossils group together to the exclusion of the other groups.
When the analysis was restricted to just the Indonesian fossils, there was nearly complete separation between the older Sangiran and younger Ngandong/Sambungmacan samples on PC 1, although Sang 10 and Ng 6 overlap on this component (Figure 6b). The greatest contrast was between Sang 2 and Sm 3, which can be seen as exemplars of the extremes of variation in the Indonesian sample. The younger fossils have a more vertical occipital plane, a taller vault that is wider across the pterion, and a longer and more horizontally oriented parietomastoid suture (compare Figure 6f and Figure 6g). The coronal suture is also more vertically oriented due to the more posterior position of the anterior temporal squama. Sang 10 scores higher than the other specimens on PC 2 (not figured) and Skull IX plots away from the rest of the sample on PC 3 (not figured). Sang 10’s uniqueness is related to its posterior position of the asterion, resulting in a small asterion–lambda–inion angle. Skull IX stands apart mainly because its midline structures (sagittal suture, inion) are shifted posteriorly relative to the lateral structures (e.g. pterion, porion, asterion) and it has a vertically short occipital squama. With the exception of Ng 10, the Ngandong fossils are distinguished from the rest of the Indonesian hominins on PC 4 (Figure 6b) due to their taller vault, longer occipital plane, and decreased breadth across the temporal base relative to the vault walls. A very similar analysis was run that replaced the postglenoid process with the entoglenoid process. This led to the exclusion of Sang 10 but the inclusion of Ngawi. The results were quite similar, and Ngawi looked similar to Sm 3 in these ordinations.
Given that all three Asian temporospatial groups (Zhoukoudian, Sangiran, late Indonesian) were represented by three or more individuals, PCA and canonical variate analysis (CVA) were performed on the Asian sample to see whether it was possible to separate the Zhoukoudian and Sangiran groups. The Zhoukoudian and early Indonesian fossils overlapped in the PCA (not figured) but could be separated in the CVA when they were assigned to these groups a priori, although Skull IX approached the Chinese distribution (Figure 7). Based on the CVA, the early Indonesian fossils were relatively taller at bregma with a less posteriorly projecting inion, resulting in a more acute asterion–lambda–inion angle. The temporal bone was also longer anteroposteriorly and the vault was broader across the parietal notch, postglenoid process, temporosphenoid suture, and pterion.
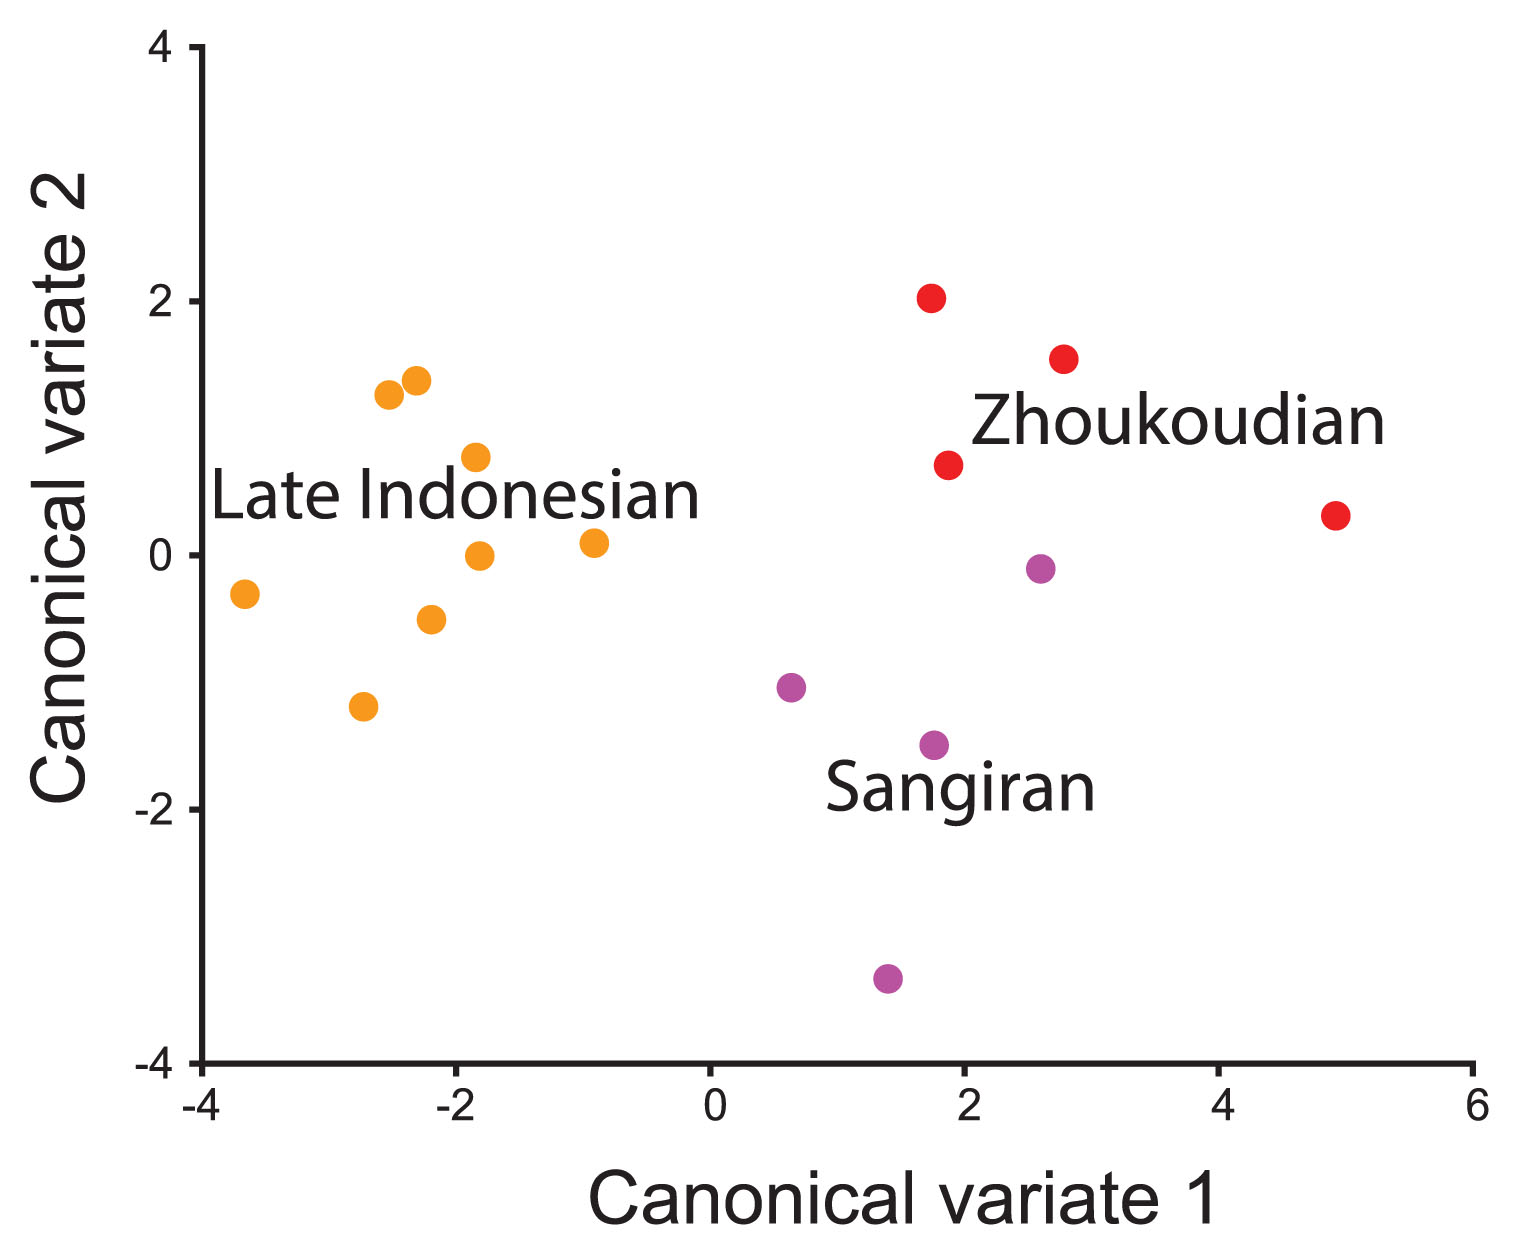
Canonical variates analysis for Asian fossils using ‘Posterior Neurocranium’ landmarks.
The final analysis was a variant on the ‘Posterior Neurocranium’ analysis that included the incomplete but important Sang 4 fossil. This had two fewer landmarks and a substitution of apex for bregma. The ordination of the first two PCs using the full sample was similar (though not identical) to that described for the posterior neurocranium above (Figure 8a). Differences included the position of Sang 10 and WT 15000 within the late Indonesian cluster, and the position of Skull IX and D 3444 on the periphery of this cluster. In contrast, Sang 2 was within the Zhoukoudian cluster and Sang 2 and 17 plotted with some of the Georgian and African fossils. Shape differences among groups related to increased posterior projection at inion in the Zhoukoudian and Sang 2 fossils (Figure 8e), a relatively higher and more anterior position of the vault apex in later Indonesian fossils (Figure 8c), and a shorter parietomastoid suture and longer anterior temporal bone in the Georgian and some African and Sangiran fossils (Figure 8d).
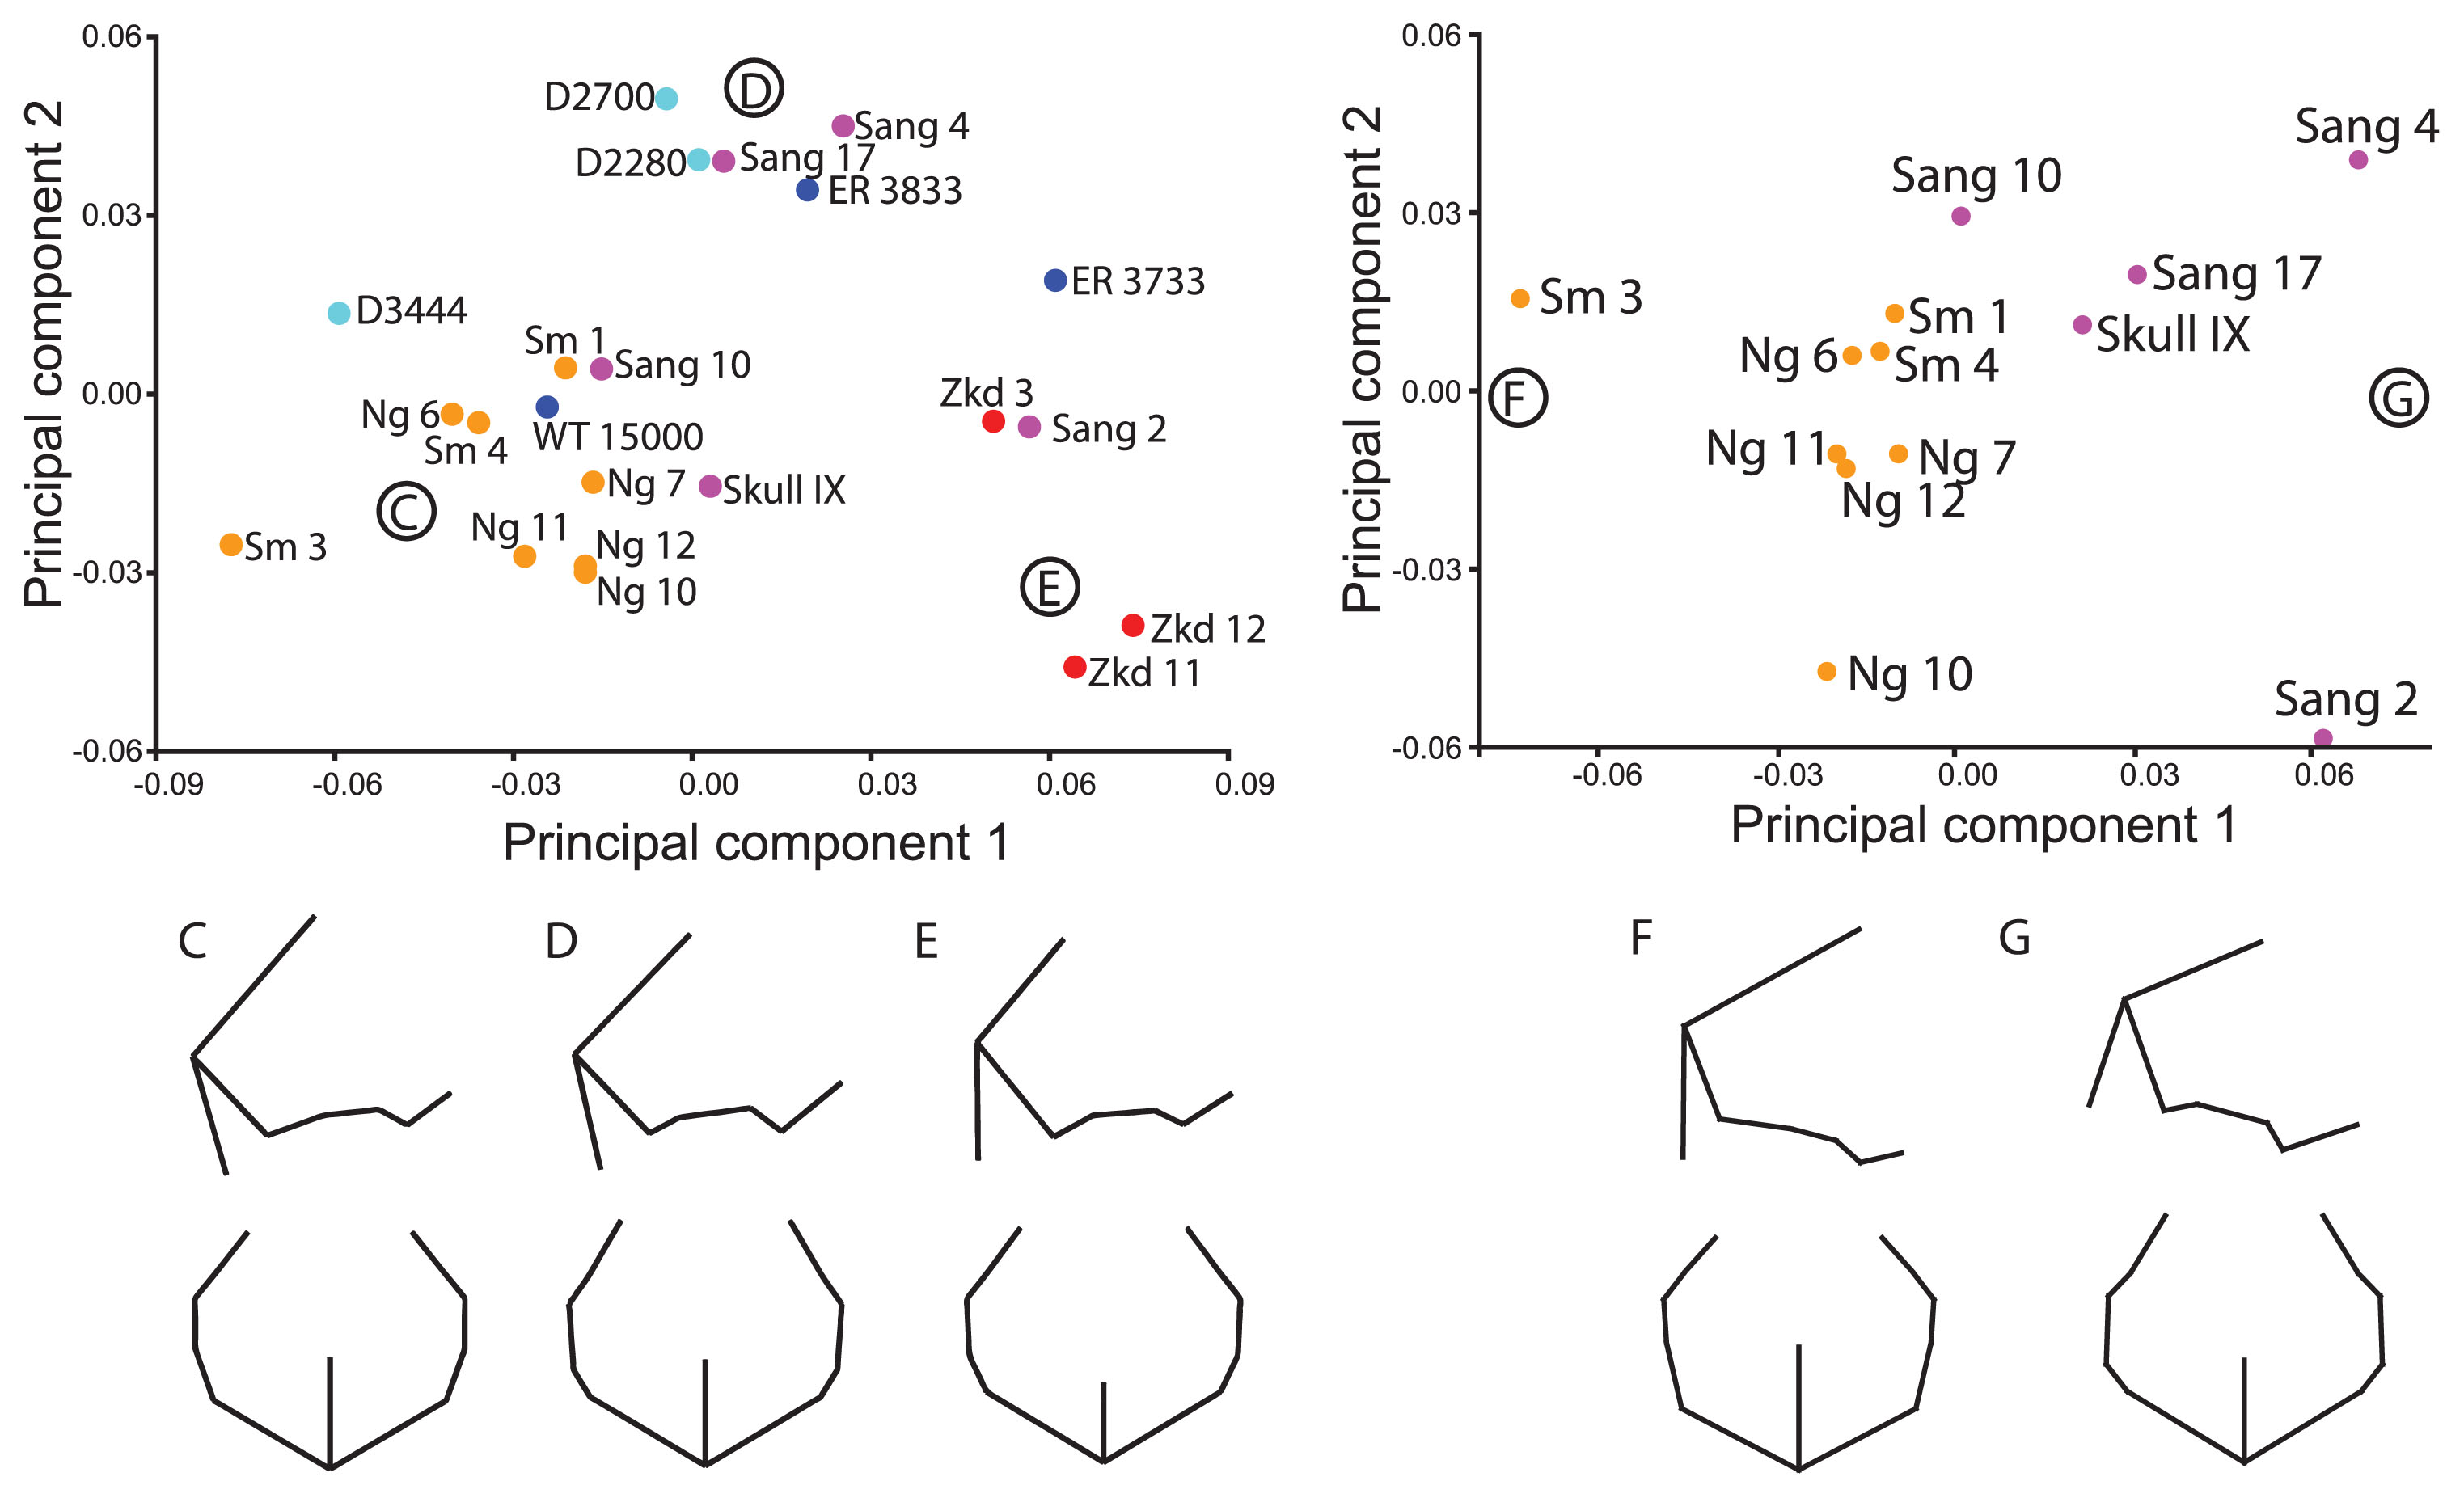
Principal components ordination and associated shape changes for ‘Sangiran 4’ landmark set. (A) The ordinations show PC 1 (34.8%) and PC 2 (16.2%) for the full sample and (B) PC 1 (34.5%) and PC 2 (19.1%) for the Indonesian-only sample. Shapes corresponding to the major clusters of (C) Late Indonesian, (D) African/Georgian fossils, and (E) Zhoukoudian fossils are shown in right lateral and superior views. The Sangiran fossils overlap each of these three groups. The shapes associated with the negative (F) and positive (G) ends of PC 1, which reflect differences between late Indonesian and Sangiran fossils, respectively, are also shown based on the Indonesian-only sample.
As above, when the analysis was restricted to just the Indonesian fossils, there was separation of the earlier and later samples on PC 1, with overlap of Sang 10 and the younger fossils on this component (Fib. 8b). Sm 3 is contrasted most strongly with Sang 2 and Sang 4. The later Indonesian fossils differ in their taller vault at apex, longer and more vertical occipital plane, narrower posterior vault, anteroposteriorly shorter anterior temporal squama (between the postglenoid process and the temporosphenoid suture), and longer parietomastoid suture (Figure 8f). The second component captures variation in both the early and late samples, with the Sambungmacan fossils scoring higher than the Ngandong ones (though Ng 6 is very close to the Sambungmacan range). Most Ngandong fossils (but not Ng 10) are also separate from the Sambungmacan fossils on PC 5 (not figured), but this accounts for only 8.1% of the shape variance. The shape differences captured on PC 2 indicate that the Sambungmacan fossils have less height at apex and lambda, a shorter occipital squama with less projection at the inion, and a more posteriorly positioned asterion, leading to a longer parietomastoid suture.
Size and geological ageTo evaluate scaling, the PC scores were regressed on the natural logarithm of EV. This was first performed for the full sample of H. erectus based on the ‘Skull IX’ landmarks because this provided good landmark coverage of the neurocranium but also included more than one representative of each temporospatial group. Size did not affect the position of specimens along the first component, but did account for 55.9% of the variance in PC 2 scores (R2 = 0.559; P < 0.001). In this context Skull IX is actually the outlier, scoring higher on PC 2 than expected based on its size. The first component separated the late Indonesian sample from other Asian fossils and the Georgian from the African fossils. PC 2 separated the Asian and African/Georgian fossils from one another.
To evaluate diachronic trends, PC scores were regressed on geological age of the fossils. Again, age (using the older age for the Ngandong/Sambungmacan/Ngawi fossils) accounted for a significant proportion of the variance in PC 2 scores (R2 = 0.779; P < 0.001). This result reflected the strong contrast between the much older African/Georgian fossils and the younger Asian fossils; there was no relationship between age and PC 2 scores within the Asian sample itself. Skull IX was again an outlier, scoring higher than predicted by its age. Using the younger end of the age for the Ngandong/Sambungmacan/Ngawi group results in a weaker but still significant relationship between age and PC 2 scores (R2 = 0.649; P < 0.001). There was a weak, borderline significant relationship between age and PC 1 using this younger chronology as well (R2 = 0.220; P = 0.049).
The same analyses were performed for just the Indonesian fossils using the ‘Sang 4’ landmark set. Although this provides only limited information about cranial shape, this analysis includes the largest number of Indonesian fossils and encompasses the greatest temporal depth. Size does not explain a significant proportion of the variance in PC 1 scores, but age accounts for 63–69% of the variation in PC 1 scores (R2 = 0.692, P < 0.001 based on an age of 546 ka for Ngandong and Sambungmacan; R2 = 0.630, P = 0.001 based on an age of 143 ka for Ngandong and Sambungmacan). The extreme position of Sm 3 at the negative end of the first component impacts both relationships. Excluding Sm 3 from the regression results in a significant scaling relationship (R2 = 0.474, P = 0.013) and stronger age–shape relationships (R2 = 0.782, p < 0.001; R2 = 0.698, p < 0.001) on PC 1.
The Asian fossils differ from the African/Georgian sample in having a longer neurocranium with more posterior projection at the inion, longer frontal squama in the median plane, lower temporal squama, and greater breadth across the temporal and frontal squama (including behind the supraorbital tori). These shape changes may be due to the underlying increase in brain size in these groups or may reflect an independent selective force acting over the >1.5 Myr spanned by the H. erectus samples studied here. It is unclear what single force would be continuously acting in such different environmental contexts, and it is more likely that this reflects brain size increase within certain morphological constraints. It was shown previously that brain size increase in more derived Homo species occurred along a different shape axis than it did in H. erectus (Baab, 2016b), so perhaps this reflects strong genetic integration of cranial shape in H. erectus. Moreover, it is clear that there was not linear evolution within the Asian record as the temporally intermediate Zhoukoudian fossils are in no way transitional between the early and later Indonesian fossils (see also Antón, 2002).
Previous analyses based on linear dimensions (and sometimes EV) by Anton and colleagues (Antón, 2002; Antón et al., 2002) found a distinction between Chinese and Indonesian fossils based on a PCA of logged values of five cranial dimensions (including EV) and a second PCA of three posterior cranial dimensions. The Zhoukoudian fossils were differentiated in those analyses mostly on the basis of their narrower biasterionic and wider biauricular breadths compared to the Indonesian sample. The isolation of the Zhoukoudian sample on the basis of its narrow biasterionic and frontal breadths and wider biauricular breadth was further confirmed in CVAs of size-corrected linear dimensions (Kidder and Durband, 2004; Durband et al., 2005; Durband, 2006). Based on the ‘Original’ analysis presented here, this pattern did differentiate the Zhoukoudian H. erectus from the Indonesian, particularly the later Indonesian, fossils, but was not as diagnostic for Zhoukoudian compared to African and Georgian fossils. On the other hand, the analysis presented here shows that relative to overall cranial size, the Zhoukoudian fossils are differentiated from all other H. erectus groups by a low cranial profile combined with a short occipital squama that is posteriorly projecting at inion and a frontal bone that is slightly narrower across the supraorbital region with an inferiorly positioned frontotemporale.
The earlier and later samples of Indonesian fossils did not form a distinct regional cluster, particularly when the posterior neurocranium was evaluated: individual Sangiran fossils overlapped the Zhoukoudian or late Indonesian fossil distributions, while others were intermediate between these two groups. In both the ‘Posterior Neurocranium’ and ‘Sangiran 4’ analyses, Sang 2 overlapped the Zhoukoudian distribution while Sang 10 overlapped the late Indonesian fossils. Sang 17 was consistently intermediate. Sang 4 was only in the latter analysis, and was likewise intermediate in position between Zhoukoudian and late Indonesian shapes. Skull IX overlapped the Chinese fossils in the former and fell intermediate in the latter. It was possible to distinguish the three groups using CDA, but the greater contrast was between the late Indonesian fossils and the other two groups. One interpretation that fits these observations is that the Sangiran population captures the greater variation initially present in Asian H. erectus, with the more homogeneous Zhoukoudian and later Indonesian morphologies representing only a subset of that original variation as the result of stochastic evolution, adaptation, or sampling effects.
Even in the analyses of more complete landmark sets, the Sangiran fossils were not consistently positioned within or near to the range of variation encompassed by the later Indonesian sample. Sang 17, Skull IX, and Sang 2 did not group with the later Indonesian fossils when the full sample was considered, despite the presence of some anterior neurocranial landmarks in their respective landmark sets (the ‘Original’ analysis in Figure 2, as well as ‘Skull IX’ and ‘Sangiran 2 and Sambungmacan 1’ landmark sets, not figured here). Thus, there is some evidence to suggest that in fact the Indonesian fossils, including both the older and younger groups, cannot be delineated from the rest of the sample on the basis of neurocranial shape.
Differences between early and later Indonesian samplesThe later Indonesian hominins exhibited a consistently distinct cranial architecture that was not related to brain size increase relative to other Asian H. erectus as there is overlap in brain size between them and both Zhoukoudian and Sangiran. The later Indonesian fossils are unique in having a taller neurocranium with more vertical occipital plane, longer parietomastoid suture, less constriction behind the orbits (along with a more posteriorly positioned frontotemporale), a more posteriorly positioned anterior temporal squama, a wider anterior vault, and a thicker lateral supraorbital torus. Many of these features were also identified by Kaifu et al. (2008) as differentiating between earlier Sangiran fossils and later Ngandong fossils, including the relatively tall vault, longer parietomastoid suture, reduced postorbital constriction, wider frontal bone, and thicker lateral supraorbital torus.
Kaifu et al. (2008) furthermore argued that the longer parietomastoid suture occurred simultaneously with a decrease in temporal squama length related to a shortening of the temporal muscle during in situ evolution on Java. Our analysis confirms their observation that this proportional ‘trade-off’ in length differentiates the Sang 2 and 17 hominins from the later group (Figure 3, Figure 4), but does not do so in Skull IX (Figure 5) (Kaifu et al., 2011b). (While Figure 6 appears to support this feature for all of the Sangiran fossils, PC 3 (not shown) indicates the opposite pattern in Skull IX.) Skull IX shares an elongated parietomastoid suture with the later Indonesian hominins but also two other Sangiran fossils (Bukuran and Sendang Klampok: Kaifu et al., 2008; Grimaud-Hervé et al., 2016) which indicates that this variation was already present in the earlier Javanese population. Nevertheless, it is worth noting that the linear measurements provided by Kaifu et al. (2008) and Grimaud-Hervé et al. (2016) for the same fossils are very different, leaving open some ambiguity regarding this character. For example, the value for Sang 10 is 13 mm in Kaifu et al. (2008) but 33 mm in Grimaud-Hervé et al. (2016). The length of this suture based on the landmarks recorded for this study is 28 mm, much closer to the latter. This is consistent with the position of Sang 10 closer to the later hominin distribution in the posterior neurocranium analysis; this is due largely to its more posterior position of the asterion, which is a unique feature of Sang 10.
Variation within Indonesian subsamplesThe higher interindividual variation exhibited by the Sangiran hominins compared to the later Indonesian sample is apparent in several analyses presented here. Higher variation in the early Indonesian record was also documented by Antón (2002, 2003) and Kaifu et al. (2008). One possibility is that some of the individual differences in the early part of the record are enhanced by taphonomic processes as all of the Sangiran fossils evaluated here have cracks running throughout, some were substantially reconstructed (Skull IX), and, in the case of Sang 4, the two pieces of the posterior vault are not attached. That said, some of the Ngandong fossils also exhibit cracks (e.g. Ng 10) and the Sangiran specimens differ from the Ngandong/Sambungmacan/Ngawi samples in the same direction and not randomly as might be expected if taphonomic processes were primarily responsible. Alternatively, we may be sampling temporal change in the Sangiran sample, which spans ~110 kyr. In particular, younger Sangiran fossils are more similar to the Ngandong/Sambungmacan/Ngawi fossils, whereas the oldest, Sang 2 and 4, are the most distinct. This resulted in a significant relationship between age and PC 1 scores in the ‘Sangiran 4’ analysis seen in Figure 7. Kaifu et al. (2005) also argued for diachronic change in craniodental morphology in the early part of the Javanese record, specifically pointing to a decrease in dental size over time. On the other hand, Antón (2002) found that some early fossils were more similar in overall size and shape to later fossils than were later Sangiran specimens but based on a limited number of measurements and measurements taken from Skull IX prior to the Kaifu et al. (2011b) reconstruction. In the ‘Skull IX’ analysis, which included Skull IX and Sang 17, thought to be roughly contemporaneous (Kaifu et al., 2011b), the latter was much more similar to Ngandong and other younger fossils than was Skull IX; this may suggest that while the posterior cranium shows some change in the direction of later fossils, this is not the case for overall cranial shape. In large part the greater separation of Skull IX was driven by the very short upper scale of the occipital bone (see also Kaifu et al., 2011b).
The relative homogeneity of the later Indonesian fossils could be interpreted in any number of ways including genetic drift, selection, or sampling effects. Regarding the latter, the Ngandong sample appears to represent individuals from the same population that died around the same time (Huffman et al., 2010), but it is uncertain whether the Sambungmacan and Ngawi populations coexisted with the Ngandong group or each other. On the other hand, reduced gene flow and founder effects may have reduced genetic and morphological diversity through time in this endemic lineage or selection.
Interpretation of later Indonesian samplesA previous study suggested that Ngandong and Sambungmacan/Ngawi were distinct morphs in terms of neurocranial shape (Baab, 2010). Indeed, the Ngandong fossils tended to cluster independently of the Sambungmacan and sometimes Ngawi fossils, particularly in the ‘Original’, ‘Sangiran 2 & Sambungmacan 1’ and ‘Skull IX’ landmark sets. However, there were instances where the separation between the groups was incomplete, including in the ‘Ngandong’ analysis and the two analyses of the posterior neurocranium. Ngawi either grouped with the Sambungmacan sample or was positioned intermediate between Sambungmacan and Ngandong. To the extent that the Ngandong fossils differ from Sambungmacan and Ngawi, this is due to their longer vault, more mediolateral restriction across temporal bone structures, more superiorly positioned frontotemporale, more medial position of the mid-toral landmarks, and differences in the height of the inferior temporal bone features. Kaifu et al. (2008) also noted some of these differences as distinguishing features for Ngandong: longer and less curved profile as well as a narrower frontal squama.
Based on current evidence, the group centroids for Ngandong and Sambungmacan differ but there is some overlap in vault shape among fossils from these groups. The tendency to plot away from one another hints at some genetic separation. This distinction could indicate temporal separation of these samples as it is difficult to imagine that populations perhaps 35 km apart would be genetically isolated if they overlapped in time. However, there was not a linear transition of shape from Sangiran to Sambungmacan to Ngandong in any of the within-Indonesia analyses. This contrasts with the results based on non-metric traits and linear dimensions presented by Kaifu et al. (2008, 2011a, 2015). Of course, stochastic forces could easily result in a non-linear pattern of change along a chain of ancestor-descendent populations within a species. A combination of linear and non-linear evolution in different features would result in a non-linear ordination based on overall shape but a linear pattern of change in some measures.
The overlap between Ngandong and Sambungmacan fossils in the posterior neurocranium may indicate that this morphological region is insufficient to distinguish between these groups. For example, Kaifu et al. (2008) identified midline curvature of the vault and increased lateral supraorbital thickness as features which mostly or entirely set the Ngandong sample apart from the Sambungmacan fossils, neither of which are captured in the posterior neurocranium analyses.
The three Sambungmacan fossils are well situated within the broader pattern of later Indonesian cranial shape in the analyses of fossils from all four regions. Sm 3 often falls at the edge of the H. erectus distribution, and is strongly contrasted with the earlier Indonesian fossils. Within the later Indonesian group, Sm 3 is the most extreme example of the trend found in other Sambungmacan and Ngawi hominins to have an anteroposteriorly shorter vault with greater breadth across the temporal and frontal squamae and a shorter, more vertical nuchal plane with a more inferior position of frontotemporale. Some of these same features were discussed by Márquez et al. (2001) and Delson et al. (2001) who observed the more open occipital/nuchal angle, vertical frontal squama, and globular neurocranium of Sm 3. In interspecific analyses that included other archaic Homo species, these same tendencies produced superficial convergences on the later Homo pattern (Delson et al., 2001; Baab, 2016b). Kaifu et al. (2015) also found that Sm 3 was a morphological outlier in some respects, as was Ng 6, which likewise occupied an extreme position in several of the analyses presented here even after correction for distortion (e.g. ‘Original’ and ‘Skull IX’ analyses).
The observation that Sm 3 presented unique aspects of cranial shape and some non-metric traits suggested several possibilities to the original describers, including additional taxonomic variation in Southeast Asia (Márquez et al., 2001), and individual- or population-level variation (Delson et al., 2001). This study indicates that the shape of Sm 3 is consistent with other late Indonesian fossils, particularly those from Sambungmacan, and is unlikely to represent additional taxonomic variation in Southeast Asia. On the other hand, several interpretations of Sm 3 remain viable, including individual- or population-level variation. The grouping of Sm 3 with Sm 1, Sm 4, and sometimes Ngawi provides support for the latter, while its consistently more extreme position within this cluster provides support for the former.
A few generalizations are possible when the results of the various analyses are viewed jointly:
The author is grateful to the curators and staff of the following institutions and agencies for access to fossil data: American Museum of Natural History, Gadja Mada University, Lembaga Ilmu Pengetahuan Indonesia (LIPI), National Museums of Kenya, National Museum of Tanzania, and COSTECH. Particular thanks to Mr Iwan Kurniawan (Geological Museum, Bandung) for access to Sm 4 and Dr Yousuke Kaifu for arranging access to the CT scans of fossils at the National Museum of Nature and Science, Tokyo.