Original Articles
Humeral laterality in modern humans and Neanderthals: a 3D geometric morphometric analysis
2017 Volume 125 Issue 3 Pages 117-128

Details
2017 Volume 125 Issue 3 Pages 117-128
Approximately 90% of anatomically modern humans (AMHs) are right-handed. This handedness is related to laterality patterns of the upper limb due to habitual activity patterns which are known to leave marks on the bone structure. Various studies have shown that Neanderthals were also right-handed in very similar proportions to AMHs. Here, for the first time, 3D geometric morphometric techniques are used to study humeral laterality in a Spanish modern human population and to make a comparative study with a Neanderthal sample. Results obtained in the modern human population show a larger right humerus and clear differences in shape laterality. Shape differences in both epiphyses and in the complete humerus could be caused by non-allometric factors. This could suggest different activity pattern in both arms during life. Shaft shape laterality could be explained by allometric factors, i.e. shape variability is related to size variability. Neanderthals show a larger right humerus compared to the left and the mean shape comparison with the common anatomical regions presents a non-significant result. Finally, olecranon fossa width is the only feature that clearly differs between modern humans and Neanderthals, with geometric morphometric and linear measures being wider on the Neanderthal left side and wider on the modern human population right side. This difference may be due to a combination of different factors and behaviors that involve complete extension of the elbow joint.
Anatomically modern humans (AMHs) are the only species of extant primates that have a preference for the use of one arm over the other (Schultz, 1937; McGrew and Marchant, 1997; Auerbach and Ruff, 2006; Blackburn, 2011). A large number of studies have established that most AMHs are right-handed, i.e. they use their right hands for most one-handed tasks. The proportion of right-handed individuals among current populations varies between 70% and 98% (Annett, 1970, 2002; McManus, 1979; Porac et al., 1980, 1986; Perelle and Ehrman, 1994; Marchant et al., 1995; Marchant and McGrew, 1998; Singh et al., 2001; Faurie et al., 2005). Different studies have shown that manual laterality or handedness—the dominance or preference for using one hand over the other to perform activities—is related to laterality patterns of the upper limb (Hawkey and Merbs, 1995; Uomini, 2011; Villotte and Knüsel, 2013). This is due to habitual or occupational activity patterns that are known to leave marks on the bone structure due to distinct patterns resulting from differences in muscle use (Krahl et al., 1994; Hawkey and Merbs, 1995; Steele, 2000; Bass et al., 2002; Lazenby, 2002; Kontulainen et al., 2003; Shaw and Stock, 2009a, b; Uomini, 2011). Upper limb morphology changes during growth because the differential load on the hands, arms, and shoulders causes asymmetrical adaptations in the skeleton. The bony response to the load may include increases in bone mineral content, density, or cross-sectional area (Haapasalo et al., 1996), which could increase the area of insertion of the muscles on the bone’s surface (Uomini, 2011). Traditionally, upper-limb laterality patterns have been analyzed through size and musculoskeletal stress markers (MSMs). Considering all of this, the dominant hand is associated with a larger size and greater development of MSMs in the corresponding arm. The dominance of the right arm has been observed in different osteological populations of Homo sapiens, including recent hunter-gatherers, medieval British and Slovenes, the Romano-British population, German Neolithic farmers, Central European Late Eneolithic peoples, and Early Bronze Age and Northern European Mesolithic peoples (Schultz, 1937; Thould and Thould, 1983; Constandse-Westermann and Newell, 1989; Reichel et al., 1990; Trinkaus et al., 1994; Steele and Mays, 1995; Churchill and Formicola, 1997; Wilczak, 1998; Mays, 1999; Cuk et al., 2001; Lazenby, 2002; Auerbach and Ruff, 2006; Sládek et al., 2007, 2016; Weiss, 2009; Blackburn, 2011).
Studies of humeral laterality have traditionally focused on differences in size using osteometrics and/or cross-sectional geometry. These methods have been applied to medieval skeletons from York (England) (Mays, 1999) and the Drava River (Slovenia) (Cuk et al., 2001); numerous samples from Holocene adult humans (Auerbach and Ruff, 2006); Central European Late Eneolithic and Early Bronze Age samples (Sládek et al., 2007); several hunter-gatherer populations (Weiss, 2009); and non-adult individuals from various English archaeological sites (Blackburn, 2011). These studies have shown the right humerus to be larger and more robust than the left, and the diaphyseal diameter to be the most variable measurement. The greater right-side robusticity has been interpreted as reflecting right-handedness.
Manual laterality in Neanderthals has been approached using different methodologies, such as analysis of striations on the labial facet in the anterior teeth (Bermúdez de Castro et al., 1988; Lalueza and Frayer, 1997; Estalrrich and Rosas, 2013; among others), stone tool production (Steele and Uomini, 2005), brain lateralization from endocasts (Holloway et al., 2009), and asymmetry in upper-limb bones (Trinkaus et al., 1994; Cashmore et al., 2008). All of these studies concluded that Neanderthals were mostly right-handed; there are only three Neanderthal individuals considered left-handed: an individual from Krapina (KDP 4), Hortus (Hortus VII) (Frayer et al., 2012), and Vergisson 4 (Vg 4-83) (Condemi et al., 2017). Thus, with a total of 27 right-handed and 3 left-handed individuals, Neanderthals demonstrate very similar proportions of right-handedness to modern humans (Uomini, 2011; Volpato et al., 2012; Condemi et al., 2017).
There are few studies that relate humeral laterality and handedness in Neanderthals (Ben-Itzhak et al., 1988; Trinkaus et al., 1994; Vandermeersch and Trinkaus, 1995; Cashmore et al., 2008). This may be due to the fragmentary state of the fossils, or because of the intrinsic difficulty in assigning isolated upper-limb remains to the same individual. One of the most studied Neanderthal specimens is Régourdou 1, and both the upper-limb analysis (Vandermeersch and Trinkaus, 1995; Volpato et al., 2012) and dentition (Volpato et al., 2012) suggest that this individual was right-handed. Furthermore, Trinkaus et al. (1994) studied humeral laterality in eight Neanderthal individuals, observing that the right humeri are larger than the left humeri. They therefore concluded that the fossils studied belonged to right-handed individuals. Moreover, they observed that the asymmetry pattern is more pronounced in Neanderthals than in AMHs.
Few studies have investigated if sexual dimorphism affects laterality. Auerbach and Ruff (2006) analyzed the relationship between sexual dimorphism and laterality in different modern human populations. They found that the male humerus is more asymmetric in diaphyseal dimensions and vertical head diameter, while the humeral length asymmetry is greater in females than in males, and that these differences are associated with the sexual division of labor (Auerbach and Ruff, 2006). In Neanderthals an association between sexual dimorphism and laterality has also been observed, male Neanderthal humeri being more asymmetric than female humeri (Ben-Itzhak et al., 1988). In addition, Ben-Itzhak et al. (1988) performed a comparison of the humeral laterality pattern between Neanderthals and AMHs, in which they observed that the asymmetry pattern in male humeri was more marked in Neanderthals, such that there was greater development of the right humerus. For female humeri, on the other hand, no differences are observed in the asymmetry pattern between Neanderthals and AMHs.
Different laterality patterns observed in AMH populations have been explained by different activity patterns, and from this it has been possible to infer variation in physical activity in past populations (Hawkey and Merbs, 1995; Steele, 2000; Lazenby, 2002; Shaw and Stock, 2009a, b). However, some experimental studies with mice (Rabey et al., 2015) and sheep (Zumwalt, 2006) show that activity patterns may not be correlated with morphology of the muscle attachments. In spite of these results, the great asymmetry found in Neanderthal arms has been related to their behavioral patterns, such as close-range hunting with thrusting spears (Churchill et al., 1996) as well as flint knapping or animal hide preparation (Trinkaus et al., 1994). Shaw et al. (2012) concluded, through an experimental study, that the further development of the Neanderthal right humerus is due to repetitive movements associated with animal hide preparation and not to close-range hunting.
Traditionally, laterality studies have been carried out from osteometry and cross-sectional measurements. Here, for the first time, 3D geometric morphometric (3DGM) techniques are used to study humeral laterality. This new approach to analyzing laterality is used in order to extract more information about laterality patterns by studying shape and size independently. The first aim of this work is to study humeral laterality in a contemporary population of the center of the Iberian Peninsula, this being the first time that this methodology has been used for a broad analysis of laterality. Based on previous studies (Wilczak, 1998; Cuk et al., 2001; Auerbach and Ruff, 2006) we would expect to obtain a larger size and a more pronounced MSM in the right side. It is also expected that humeral laterality differs according to sex, showing greater differences between male humeri than between female humeri.
The second aim is to study humeral laterality in Neanderthals. According to Ben-Itzhak et al. (1988) and Trinkaus et al. (1994), we should expect a higher laterality pattern with a greater development of the right humerus. Furthermore, we compare the laterality pattern between both human species, and we expect that Neanderthals will show a greater difference between the two sides. Finally, we will try to identify any differences in behavioral patterns between Neanderthals and AMHs.
The AMH sample consists of 106 individuals from the early 20th century from Palencia and Valladolid (Spain) housed at the Paleoanthropology Group (Museo Nacional de Ciencias Naturales, MNCN–CSIC, Madrid, Spain) and the Anatomical Museum of the University of Valladolid (Uva, Valladolid, Spain). The collection consists of 106 adult skeletons (53 females and 53 males) of known sex and age, free of pathologies with an age range of 23–90 years. As it is a current skeletal population we assume that 90% of the individuals are right-handed.
The Neanderthal sample consists of right and left humeri of four individuals (Homo neanderthalensis), two high-quality replicas of La Ferrassie 1 (France; 54 ± 3 to 40 ± 2 kya; Guerin et al., 2015) and Feldhofer (Germany; ~40 kya; Schmitz et al., 2002) belonging to the Paleoanthropology Group, MNCN–CSIC, Madrid, Spain, and two CT scan virtual reconstructions of Régourdou 1 (France; MIS4: 90–56 kya; Vandermeersch and Trinkaus, 1995) and Spy 14 (Belgium; ~36 kya; Semal et al., 2009) (with permission of the NESPOS database). All of these Neanderthal individuals are considered to be male (Trinkaus, 1980), and right-handed based on humeral laterality studies (Trinkaus et al., 1994; Uomini, 2011; Volpato et al., 2012).
Morphometric analyses3DGM techniques based on landmark (lm) configurations are used in this study. For each complete humerus we measured 43 homologous landmarks (lm 1–43; Table 1 and Figure 1), which defined the bone structure, including muscle attachment sites and articular surfaces. All humeri from the AMH sample preserve all anatomical regions and complete sets of the 43 landmarks are taken.
| Landmark | Type | Description |
|---|---|---|
| 1 | 2 | Most projection of the lateral epicondyle |
| 2 | 1 | Proximal junction point between lateral epicondyle and capitulum |
| 3 | 1 | Distal junction point between lateral epicondyle and capitulum |
| 4 | 3 | Middle curvature point of the lateral trochlea |
| 5 | 3 | Middle curvature point of the trochlear groove |
| 6 | 3 | Middle curvature point of the medial trochlea |
| 7 | 2 | Proximal junction point between medial trochlea and medial epicondyle |
| 8 | 2 | Most projection of the medial epicondyle |
| 9 | 1 | Proximal anterior point of the lateral trochlea |
| 10 | 1 | Proximal anterior point of the medial trochlea |
| 11 | 1 | Proximal posterior point of the lateral trochlea |
| 12 | 1 | Proximal posterior point of the medial trochlea |
| 13 | 2 | Proximal point of the olecranon fossa |
| 14 | 2 | Distal point of the olecranon fossa |
| 15 | 2 | Lateral point of the olecranon fossa |
| 16 | 2 | Medial point of the olecranon fossa |
| 17 | 2 | Most inflexion between medial epicondyle and shaft |
| 18 | 2 | Most prominence of the lateral supracondylar ridge |
| 19 | 1 | Proximal point of the lateral supracondylar ridge |
| 20 | 2 | Middle point of the coracobrachialis insertion |
| 21 | 1 | Distal point of the lateral crest of the deltoid tuberosity |
| 22 | 1 | Proximal point of the lateral crest of the deltoid tuberosity |
| 23 | 1 | Distal point of the medial crest of the deltoid tuberosity |
| 24 | 1 | Proximal point of the medial crest of the deltoid tuberosity |
| 25 | 1 | Distal point of the greater tubercle crest |
| 26 | 1 | Distal point of the lesser tubercle crest |
| 27 | 2 | Posterior point of the greater tubercle surface |
| 28 | 2 | Lateral point of the greater tubercle surface |
| 29 | 2 | Proximal point of the greater tubercle surface |
| 30 | 2 | Medial point of the greater tubercle surface |
| 31 | 2 | Most proximal point projected of the medial surface of the greater tubercle |
| 32 | 2 | Proximal anterior point where intertubercular groove is between both tubercles |
| 33 | 2 | Most projection of the lateral surface of the lesser tubercle |
| 34 | 2 | Proximal point of the lesser tubercle surface |
| 35 | 2 | Anterior point of the lesser tubercle surface |
| 36 | 2 | Distal point of the lesser tubercle surface |
| 37 | 2 | Posterior point of the lesser tubercle surface |
| 38 | 1 | Junction point between the humeral head perimeter and long head of the biceps brachii |
| 39 | 2 | Proximal point of the humeral head perimeter |
| 40 | 2 | Posterior point of the humeral head perimeter |
| 41 | 2 | Distal point of the humeral head perimeter |
| 42 | 2 | Anterior point of the humeral head perimeter |
| 43 | 3 | Middle point of the humeral head |
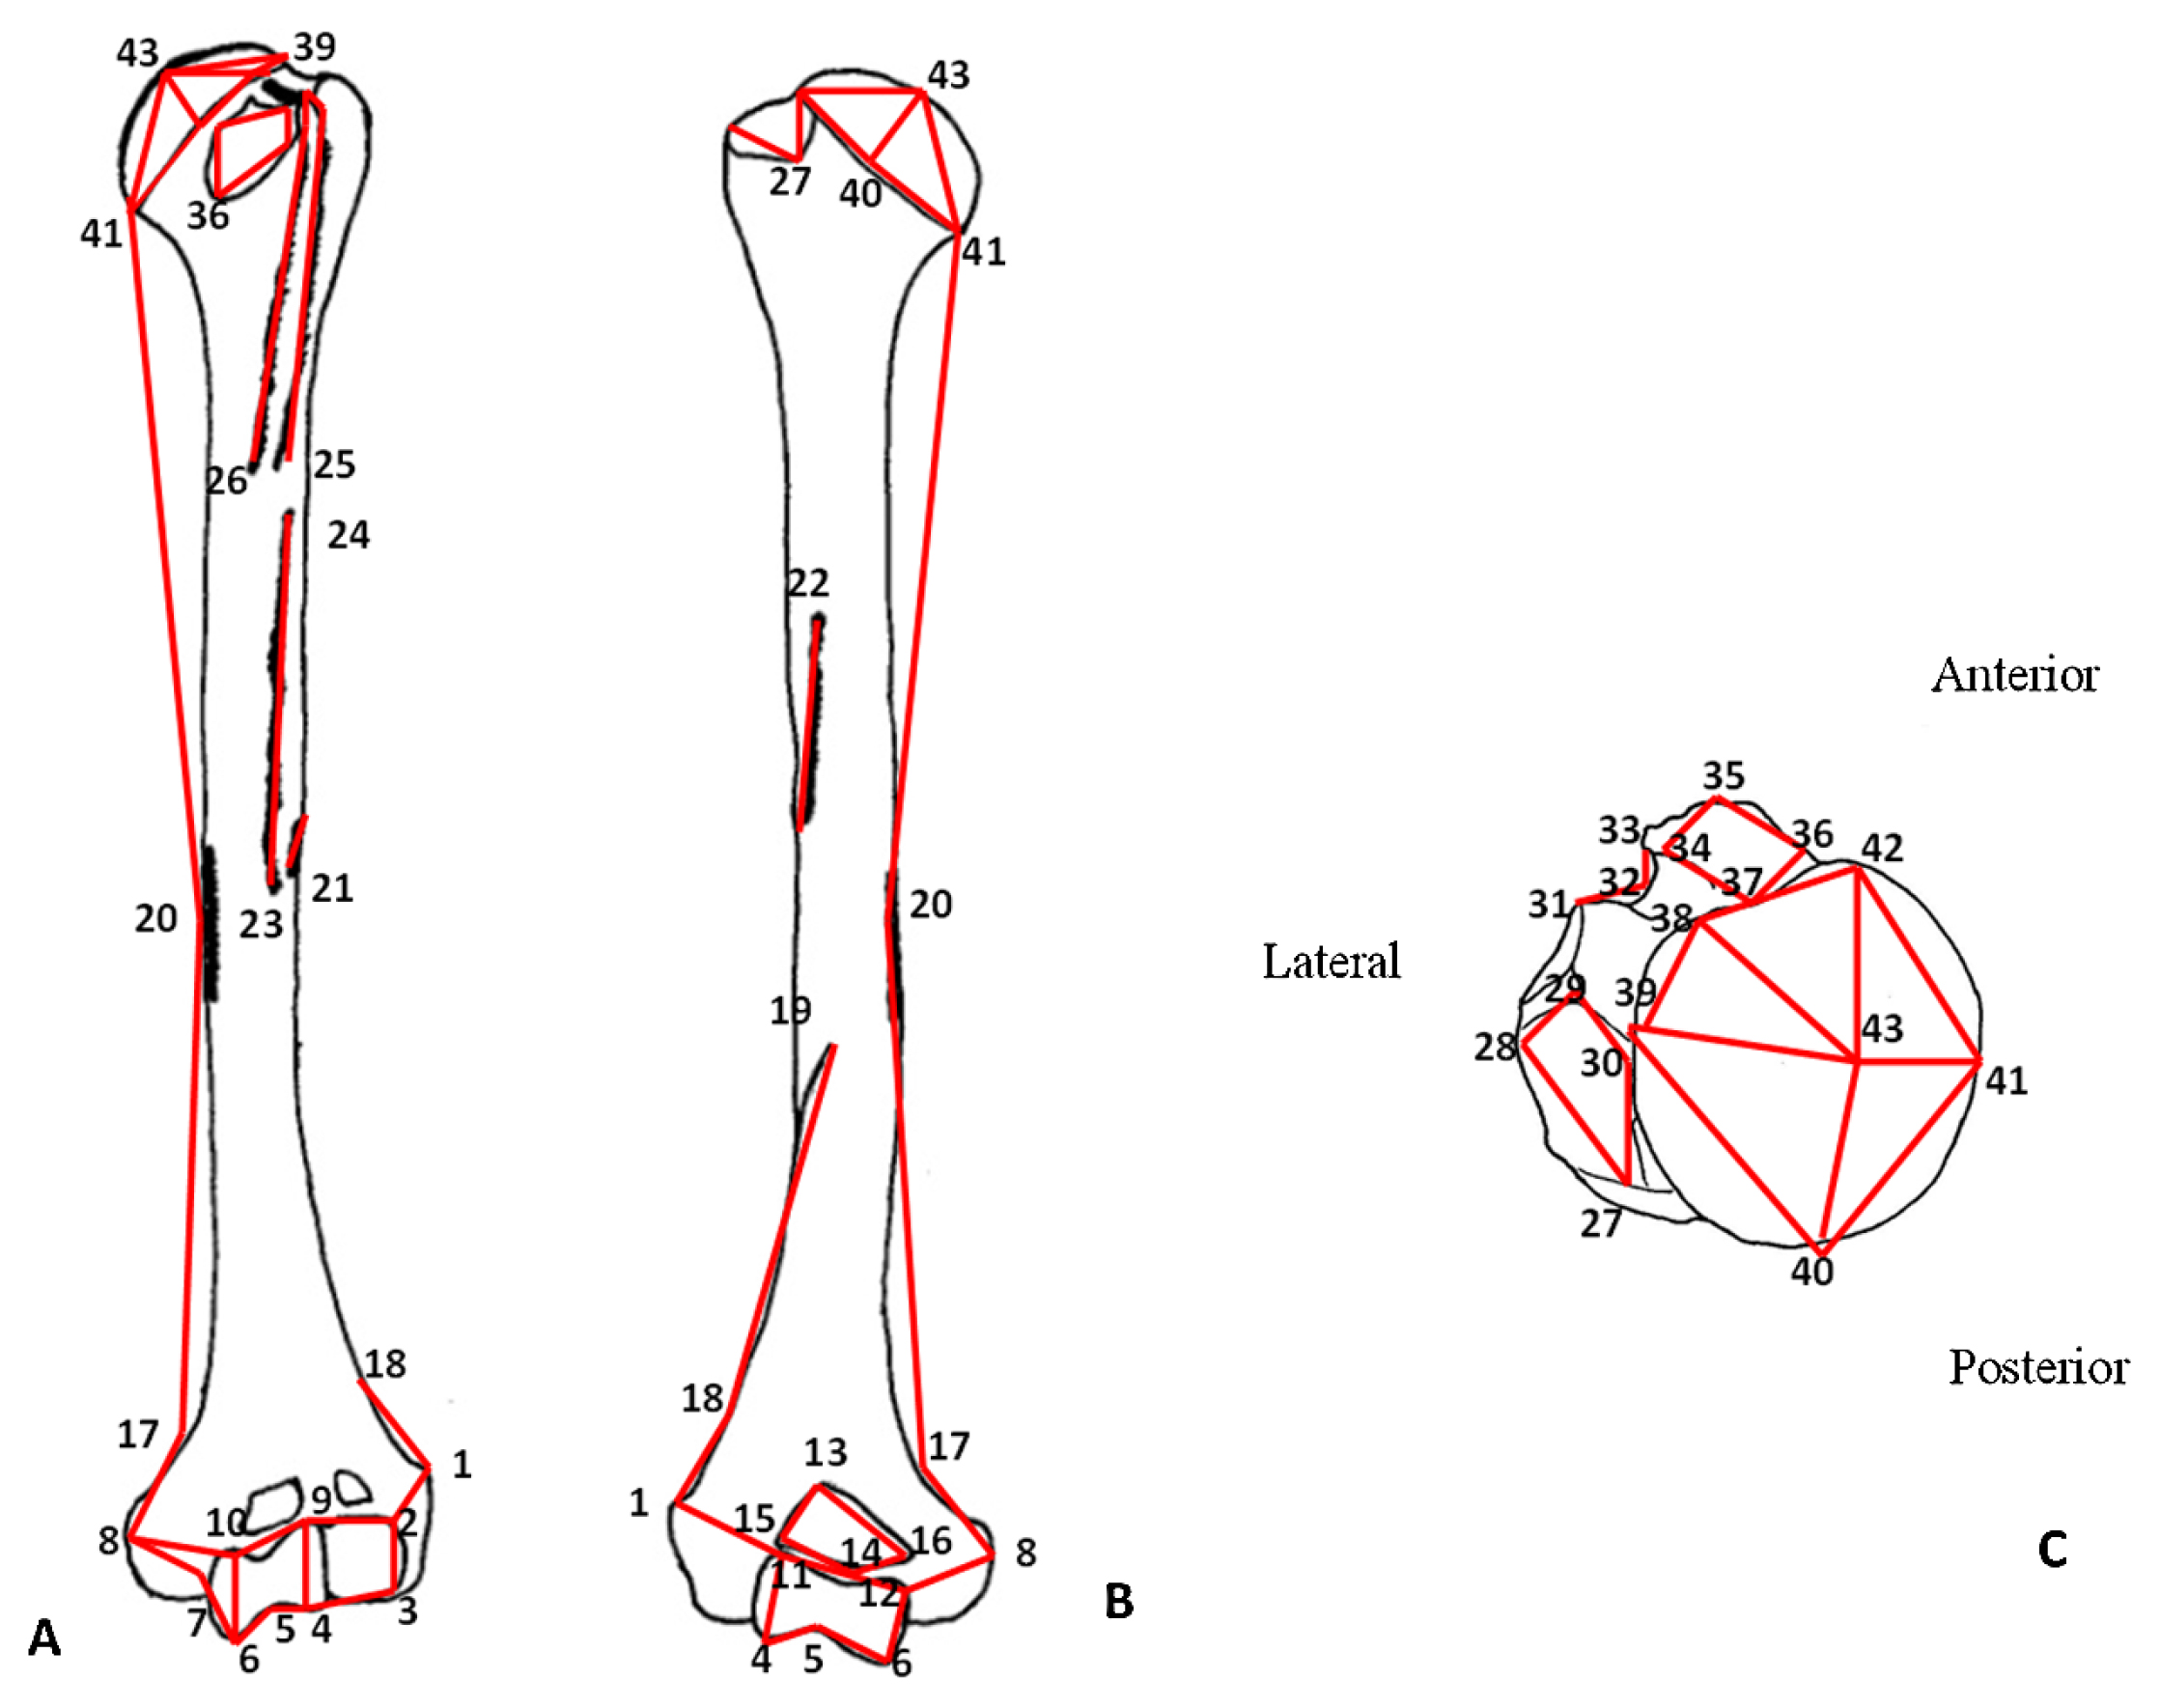
Anatomical location of the landmarks in anterior (A) and posterior (B) humeral view. (C) Proximal epiphysis in superior view. Numbers indicate the landmark positions, and red lines are the wireframes used for visualization.
The study of laterality in the Neanderthal sample was carried out considering the anatomical region present in both arms. La Ferrassie 1 preserves the diaphysis and distal epiphysis in both humeri, apart from some landmarks on the olecranon fossa (lm 1–10, 13, 15–26; Figure 2A). Spy 14 right and left humeri preserve diaphysis and distal epiphysis without lateral epicondyle and capitulum (lm 4–25; Figure 2B). Régourdou 1 preserves only the distal epiphysis (lm 1–18; Figure 2C), because its left humerus has a fracture in the diaphysis. Finally, Feldhofer preserves the diaphyses and distal epiphyses in both humeri (lm 1–26; Figure 2D). This specimen has a pathological left ulna, so the left humerus is less well-developed and some anatomical regions are affected. In this study, the landmarks taken on this specimen are not in the affected region.

Neanderthal samples used in this study: La Ferrassie 1 (A), Spy 14 (B), Régourdou 1 (C), and Feldhofer (D).
Landmarks were taken with a MicroScribe® digitizer in both modern humans and high-quality replicas, whereas Amira 5.4.1 software (Stalling et al., 2005) was used for measuring virtual specimens. To test the intra-observer error between the two digitization methods, one humerus was measured five times using the MicroScribe® device and five additional times with Amira. These digitizations were compared with other humeri through Procrustes distances. The largest Procrustes distance between repetitions (0.038) was less than the smallest Procrustes distance measures (0.049). Therefore, we considered this an admissible intra-observer error and the analyses were performed.
To study the modern human population, a partial Procrustes superimposition was conducted. It reflects, rotates, scales, and translates the landmark coordinates in order to study shape, from the Procrustes distances, and size, via centroid size (CS), independently (Bookstein, 1991; Zelditch et al., 2004; Mitteroecker and Gunz, 2009). First, a mean centroid size (CS) analysis was performed to compare the differences between sides. A Kolmogorov–Smirnov test revealed a normal distribution of the data and thus a parametric Student’s t-test was performed with SPSS v. 20 software (IBM Corporation, 2011). A linear regression analysis is used to verify that the shape is independent of age (P = 0.1263) and that the mean shape comparison analysis between right and left shapes can therefore be performed. The mean shape comparisons were carried out on Procrustes distances with a permutation test (N = 10000) using MorphoJ software, in order to test the null hypothesis of equal group means (Klingenberg, 2011). Furthermore, with this software, allometry was studied through multivariate linear regression to analyze the covariation between shape and size. Finally, a mean shape comparison analysis between right and left side of the regression residuals, as a means of correcting for the effects of external factors such as size, was performed to analyze the non-allometric component. These analyses were performed on both left and right complete humeri (lm 1–43), and three separate analyses were also performed: distal epiphysis (lm 1–17), proximal epiphysis (lm 27–43), and diaphysis (lm 13, 17–26).
Furthermore, to see if there are differences in humeral laterality related to sexual dimorphism, size and shape analyses were performed on the complete sample, and on males and females separately. To compare the laterality pattern between males and females, a multivariate regression analysis with qualitative variables was carried out for each sex, where the dependent variable was the shape and the independent variable was the side (right and left). For each sex a regression vector was obtained. These were compared and the difference between them was quantified through an angle under the null hypothesis that the vectors are randomly distributed in the shape space (Cobb and O’Higgins, 2007; Bastir et al., 2013; Klingenberg and Marugán-Lobón, 2013). Small angles indicate similarities between the pattern of laterality and big angle differences. All these analyses were conducted with MorphoJ software.
In the Neanderthal sample a partial Procrustes superimposition was carried out to study size and shape in each individual. First, CS was calculated for each humerus. These were then compared individually. After this, the right humerus shape was superimposed on the left shape, and the differences were assessed in each Neanderthal. In addition, a mean shape comparison analysis was carried out with the landmarks that all Neanderthals have in common (lm 4–10, 13, 15–18).
In order to compare the laterality pattern between AMHs and Neanderthals, a multivariate regression analysis with qualitative variables was carried out for each species, where the dependent variable is the shape and the independent variable is the side (right and left), with the common landmarks of the sample (lm 4–10, 13, 15–18). The regression vectors obtained were compared, where the dependent variable is the shape and the independent variable is the side (right and left). Finally, to study a specific feature such as the olecranon fossa width from the two corresponding landmarks that define this anatomical region, its classical anthropometric measurements (mm) were obtained with Morpheus software (Slice, 2013).
Modern human laterality has been analyzed through size and shape independently. The study of size shows that 84.15% of the sample has a larger right humerus. The comparison between right and left CS does not show significant differences in the various analyses performed (Table 2), but the mean size is greater in the right humerus than the left in all analyses (pooled sexes and male and female separately).
| Size | |||||
|---|---|---|---|---|---|
| Male + female | Mean | SD | t | P | |
| Complete | Right | 809.28 | 55.34 | 1.112 | 0.268 |
| Left | 800.30 | 55.66 | |||
| Distal epiphysis | Right | 85.012 | 7.23 | 0.409 | 0.683 |
| Left | 84.586 | 7.01 | |||
| Proximal epiphysis | Right | 77.105 | 6.188 | 1.282 | 0.201 |
| Left | 75.94 | 6.198 | |||
| Diaphysis | Right | 223.91 | 17.19 | 1.737 | 0.084 |
| Left | 219.56 | 17.24 | |||
| Male | |||||
| Complete | Right | 842.72 | 39.42 | 1.028 | 0.307 |
| Left | 834.26 | 40.80 | |||
| Distal epiphysis | Right | 90.05 | 5.30 | 0.860 | 0.392 |
| Left | 89.07 | 5.77 | |||
| Proximal epiphysis | Right | 81.42 | 4.13 | 1.553 | 0.124 |
| Left | 79.95 | 5.02 | |||
| Diaphysis | Right | 232.95 | 13.51 | 1.380 | 0.171 |
| Left | 229.11 | 13.67 | |||
| Female | |||||
| Complete | Right | 775.85 | 48.51 | 1.041 | 0.300 |
| Left | 765.59 | 46.87 | |||
| Distal epiphysis | Right | 80.06 | 5.13 | 0.164 | 0.870 |
| Left | 79.89 | 4.78 | |||
| Proximal epiphysis | Right | 72.31 | 4.52 | 1.046 | 0.298 |
| Left | 71.81 | 7.39 | |||
| Diaphysis | Right | 214.87 | 15.74 | 1.595 | 0.114 |
| Left | 209.81 | 14.98 | |||
Significant differences in shape can be clearly observed in all analyses (Table 3: mean shape), except in the male diaphysis. The analysis shows the following features of the right humerus when compared to the left (Figure 3): a more posterior orientation of the humeral head with a lower vertical diameter; a greater muscle insertion area for the teres major muscle; a proximal end of the lateral supracondylar ridge that is located more distally on the shaft; a maximum width of both tubercles that is more posterior; a bicipital groove that is wider and deeper; an olecranon fossa that is taller and wider; a trochlea that is wider; and a capitulum that is narrower and more distoposteriorly projected
| Laterality | ||||
|---|---|---|---|---|
| Mean shape | Residual regression | |||
| Male + female | Procrustes distance | P | Procrustes distance | P |
| Complete | 0.01121569 | <0.0001 | 0.01089014 | <0.0001 |
| Distal epiphysis | 0.04462009 | <0.0001 | 0.04459662 | <0.0001 |
| Proximal epiphysis | 0.06123095 | <0.0001 | 0.06062660 | <0.0001 |
| Diaphysis | 0.02164011 | 0.01 | 0.01844830 | 0.07 |
| Male | ||||
| Complete | 0.01077659 | <0.0001 | 0.01037940 | 0.02 |
| Distal epiphysis | 0.03976152 | <0.0001 | 0.04015404 | <0.0001 |
| Proximal epiphysis | 0.05949123 | <0.0001 | 0.05725435 | <0.0001 |
| Diaphysis | 0.02118332 | 0.18 | 0.01776656 | 0.37 |
| Female | ||||
| Complete | 0.01364673 | <0.0001 | 0.01309990 | <0.0001 |
| Distal epiphysis | 0.05189159 | <0.0001 | 0.05188257 | <0.0001 |
| Proximal epiphysis | 0.06862515 | <0.0001 | 0.06716869 | <0.0001 |
| Diaphysis | 0.02915477 | 0.03 | 0.02565685 | 0.07 |
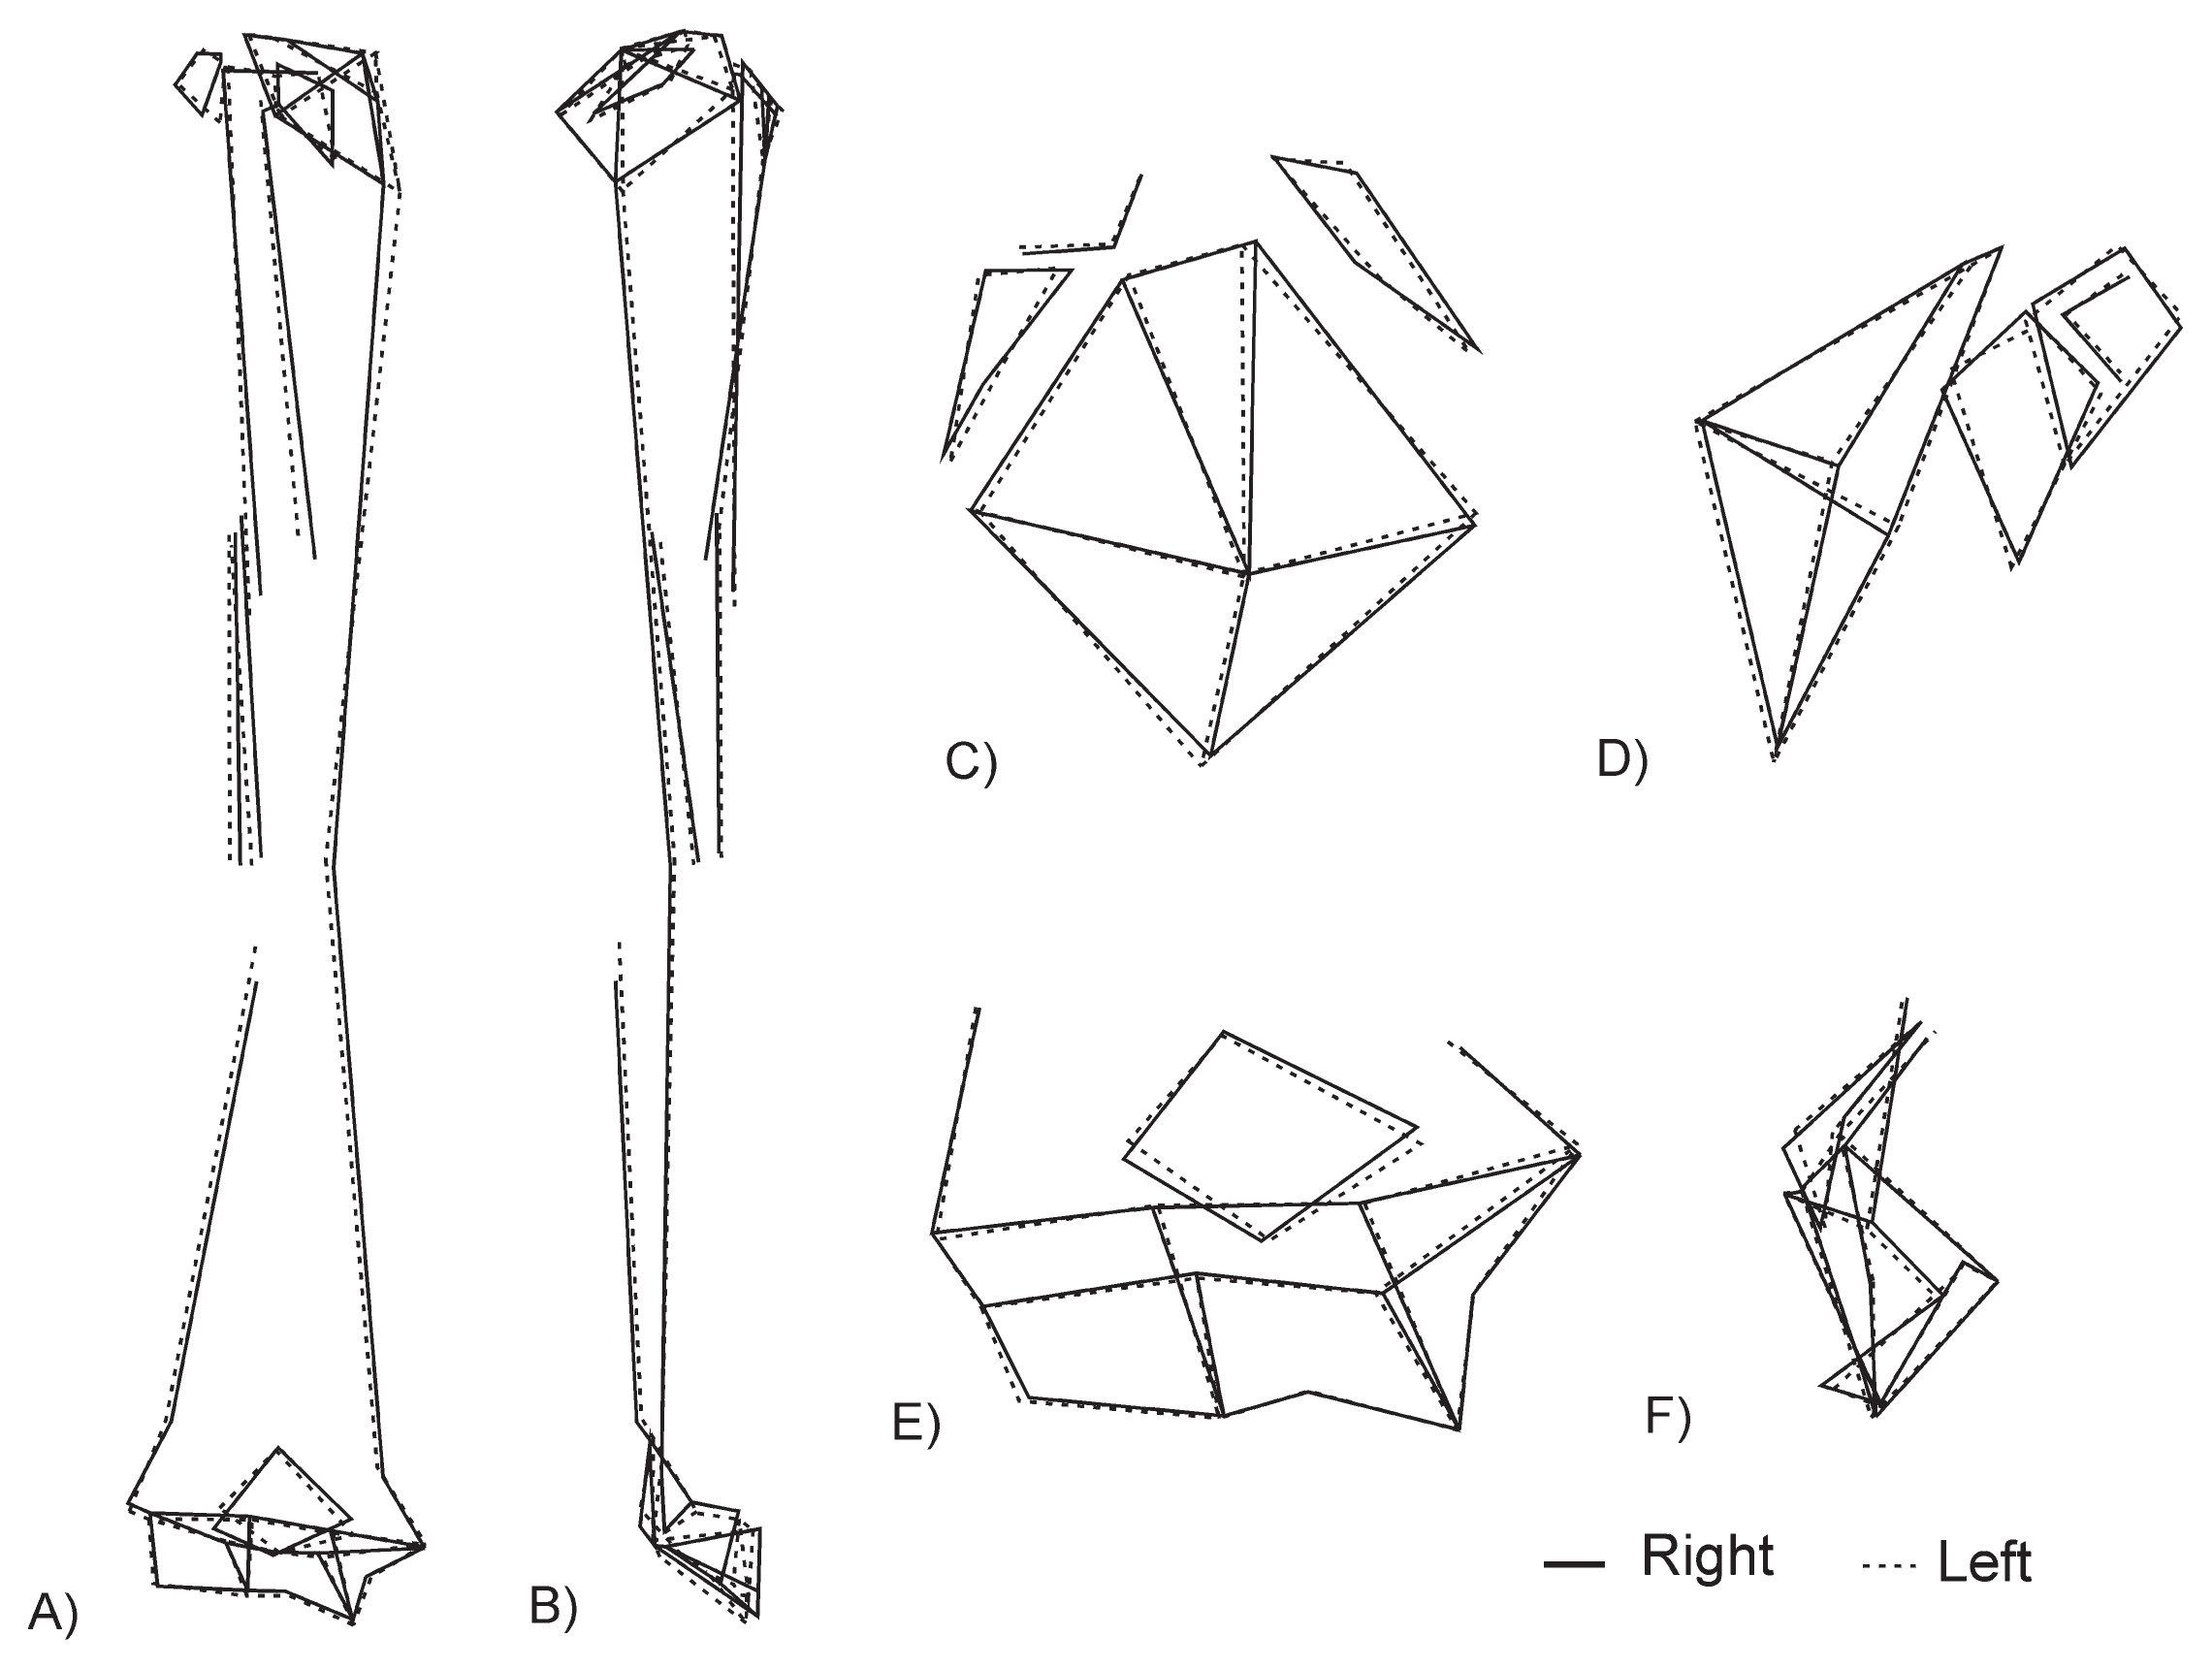
Illustration by wireframes of the shape differences of laterality in H. sapiens. The complete humerus is represented in anterior (A) and lateral (B) views, the proximal region in superior (C) and lateral (D) orientations, and the distal region in anterior (E) and lateral (F) views.
To study the non-allometric component of the shape, first a multiple linear regression was conducted in order to analyze the allometry and verify whether shape depends on size. All of these analyses are significant (P < 0.01), indicating that an allometric pattern exists. Then, a mean shape analysis comparison with the residual regressions was carried out, revealing that the results continued to be significant, except for the diaphysis (Table 3: residual regression).
Finally, in order to investigate whether the laterality pattern is different between both sexes, a multivariate regression analysis with qualitative variables was performed for males and females separately and then the regression vectors were compared. This showed an angle of 46.59° between them, which is statistically significant (P < 0.0001). This result indicates a similar pattern of laterality between sexes. Although the pattern of laterality is similar, some differences have been observed in the mean shape comparison. These more prominent features in female humeri (Figure 4) are a longer teres major in the right humerus and pectoralis major in the left; a lateral supracondylar ridge that is more developed on the left side; a deltoid tuberosity that is positioned more laterally in the left humerus; and a humeral head that is larger in the left humerus.
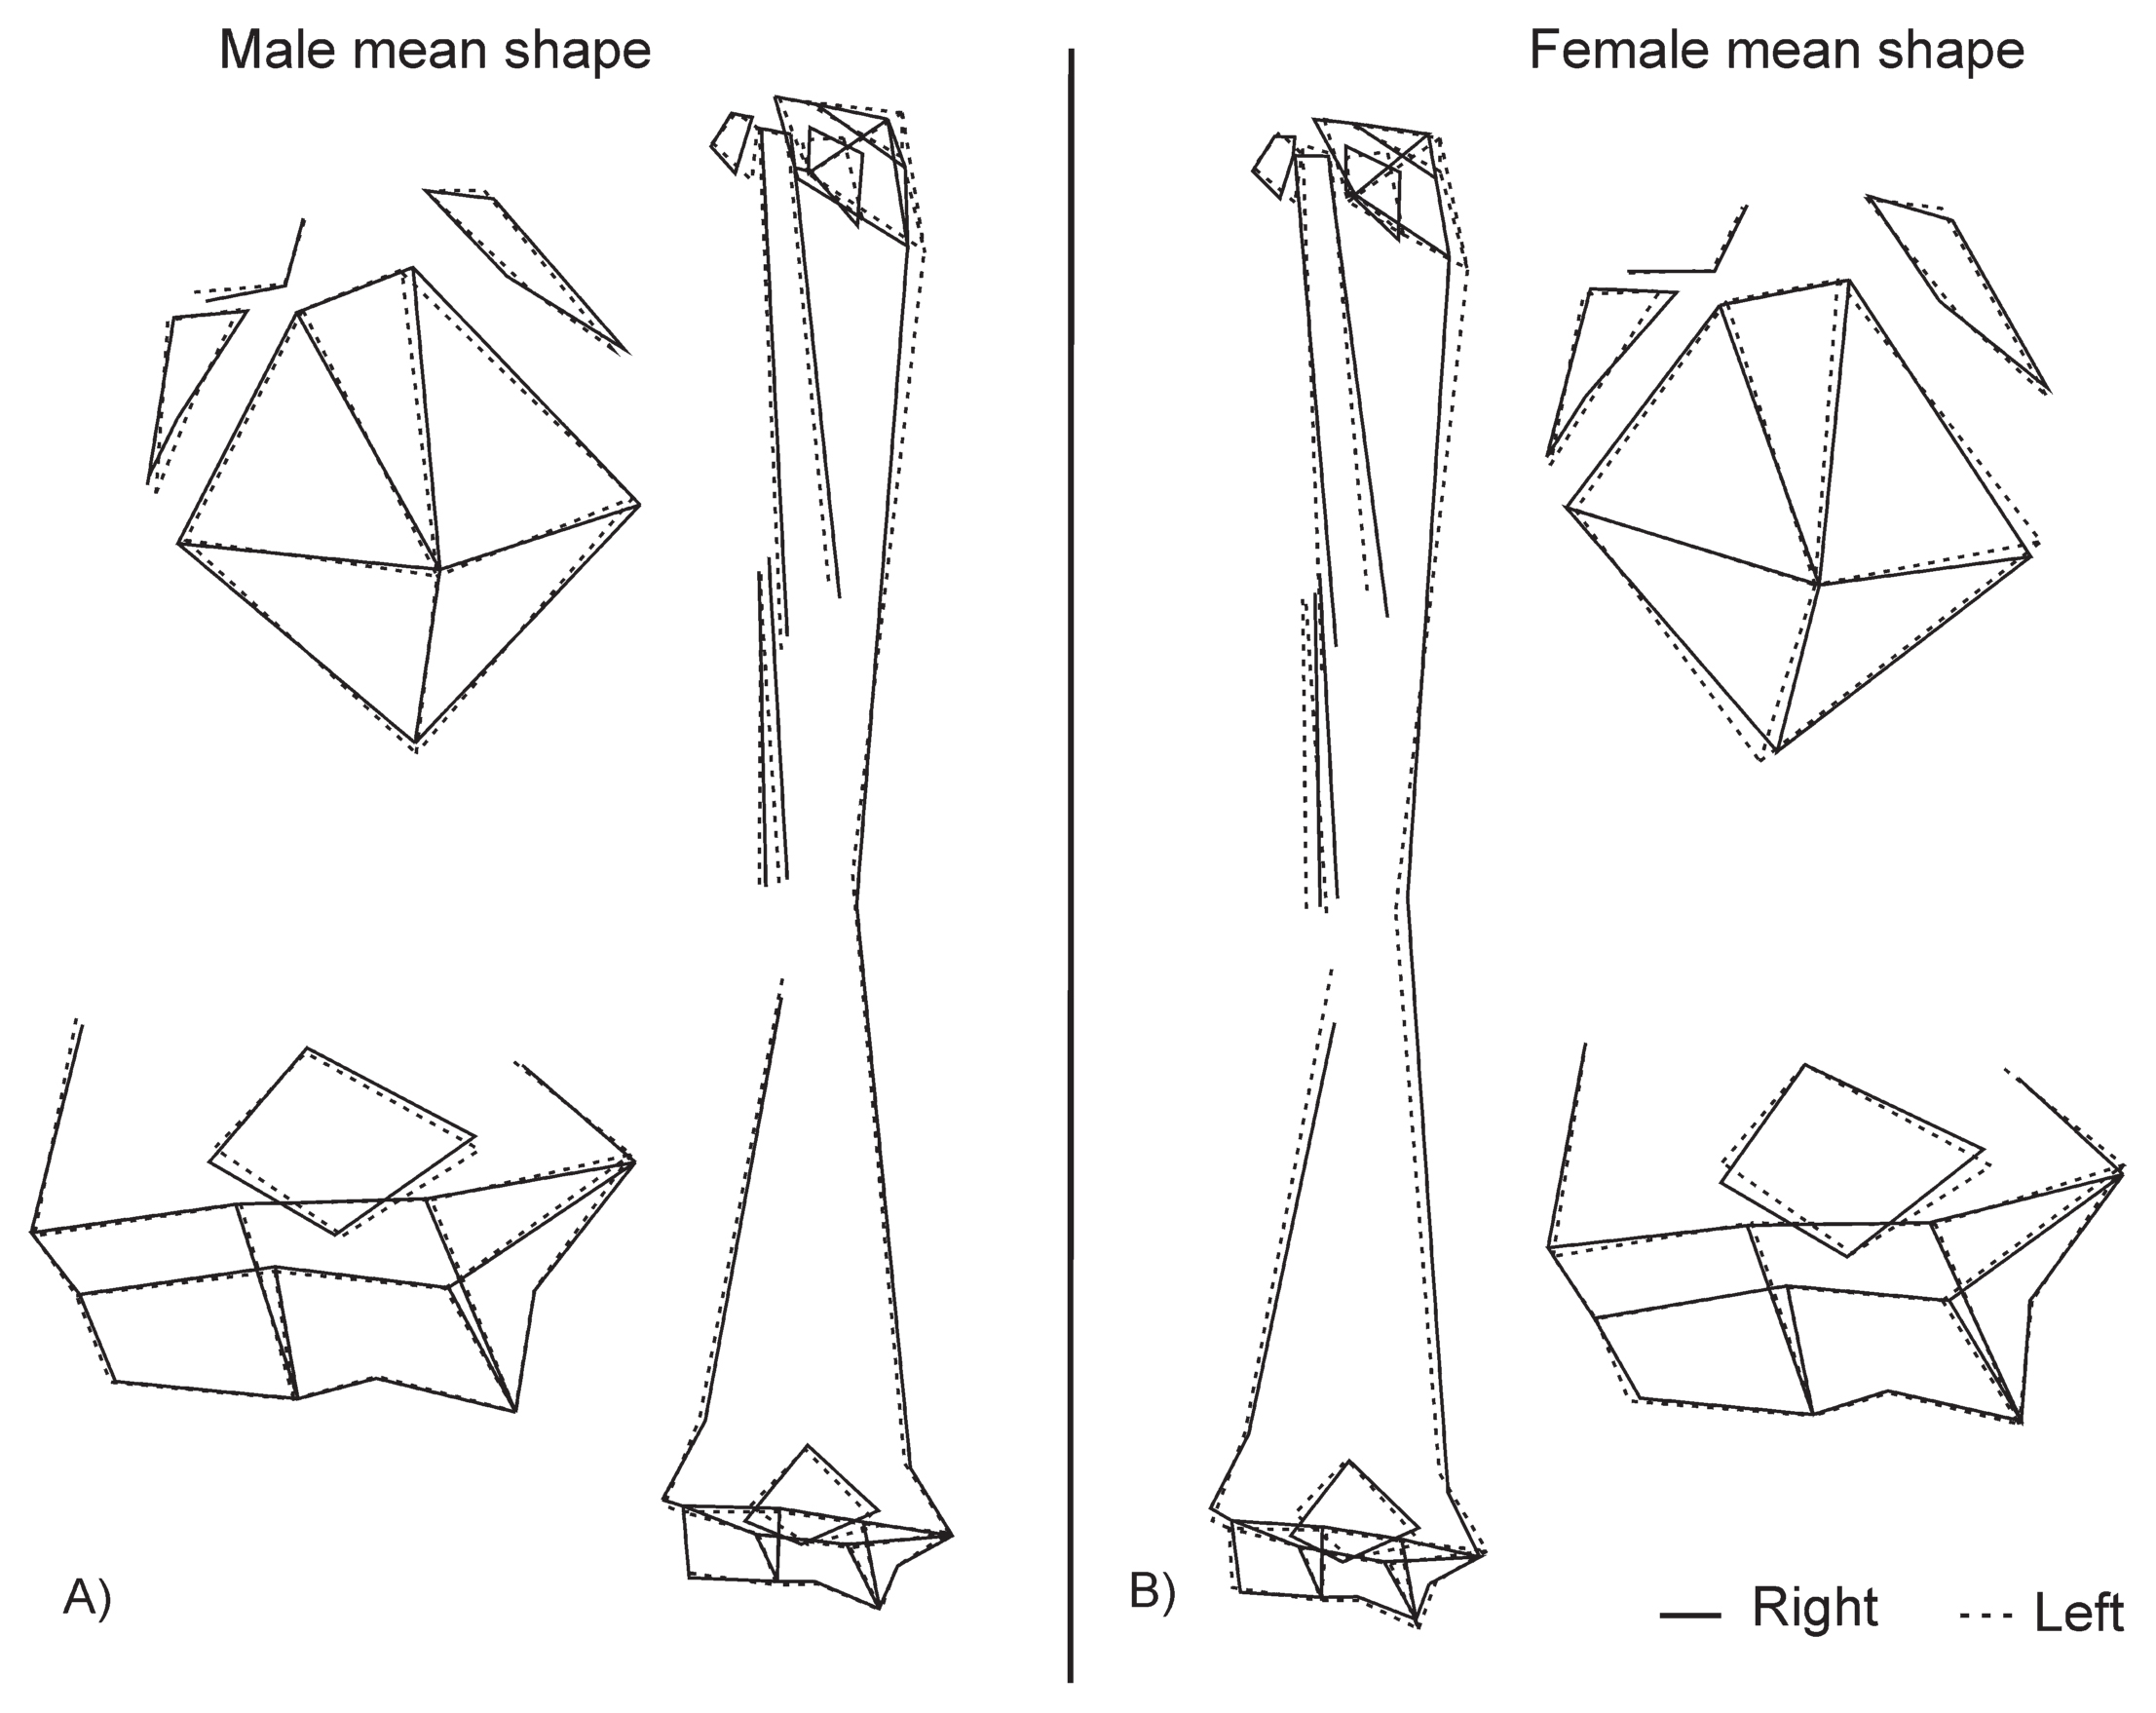
Illustrations by wireframes of the laterality mean shape comparisons in male (A) and female (B) in H. sapiens.
Laterality has been observed in the four Neanderthals analyzed here. The CS comparison shows that the right humerus is bigger than the left (Table 4) except in La Ferrassie 1. The greatest differences were noted between the Feldhofer humeri.
| Sample | Right | Left |
|---|---|---|
| Feldhofer | 396.99 | 382.01 |
| Régourdou1 | 276.61 | 271.72 |
| La Ferrassie 1 | 397.49 | 399.07 |
| Spy 14 | 359.15 | 356.97 |
Regarding shape analyses, we observed anatomical differences when the right and left shapes were superimposed and then compared. These differences are depicted in Figure 5. The Neanderthal right arm is characterized by a small olecranon fossa. The capitulum is oriented more distally. The medial trochlea is higher and the shaft is larger but it shows high variability in the length of different muscle attachments analyzed between the four Neanderthals studied. The deltoid tuberosity is wider, and the coracobrachialis attachment is located more proximally in the left humerus except in the Feldhofer humeri. Furthermore, a mean shape comparison analysis between right and left humeri with 12 common landmarks (lm 4–10, 13, 15–18) shows a non-significant result (P = 0.0802), although in the overlap of mean shape the differences between the left and right shape show some anatomical differences that are very similar to those described above.
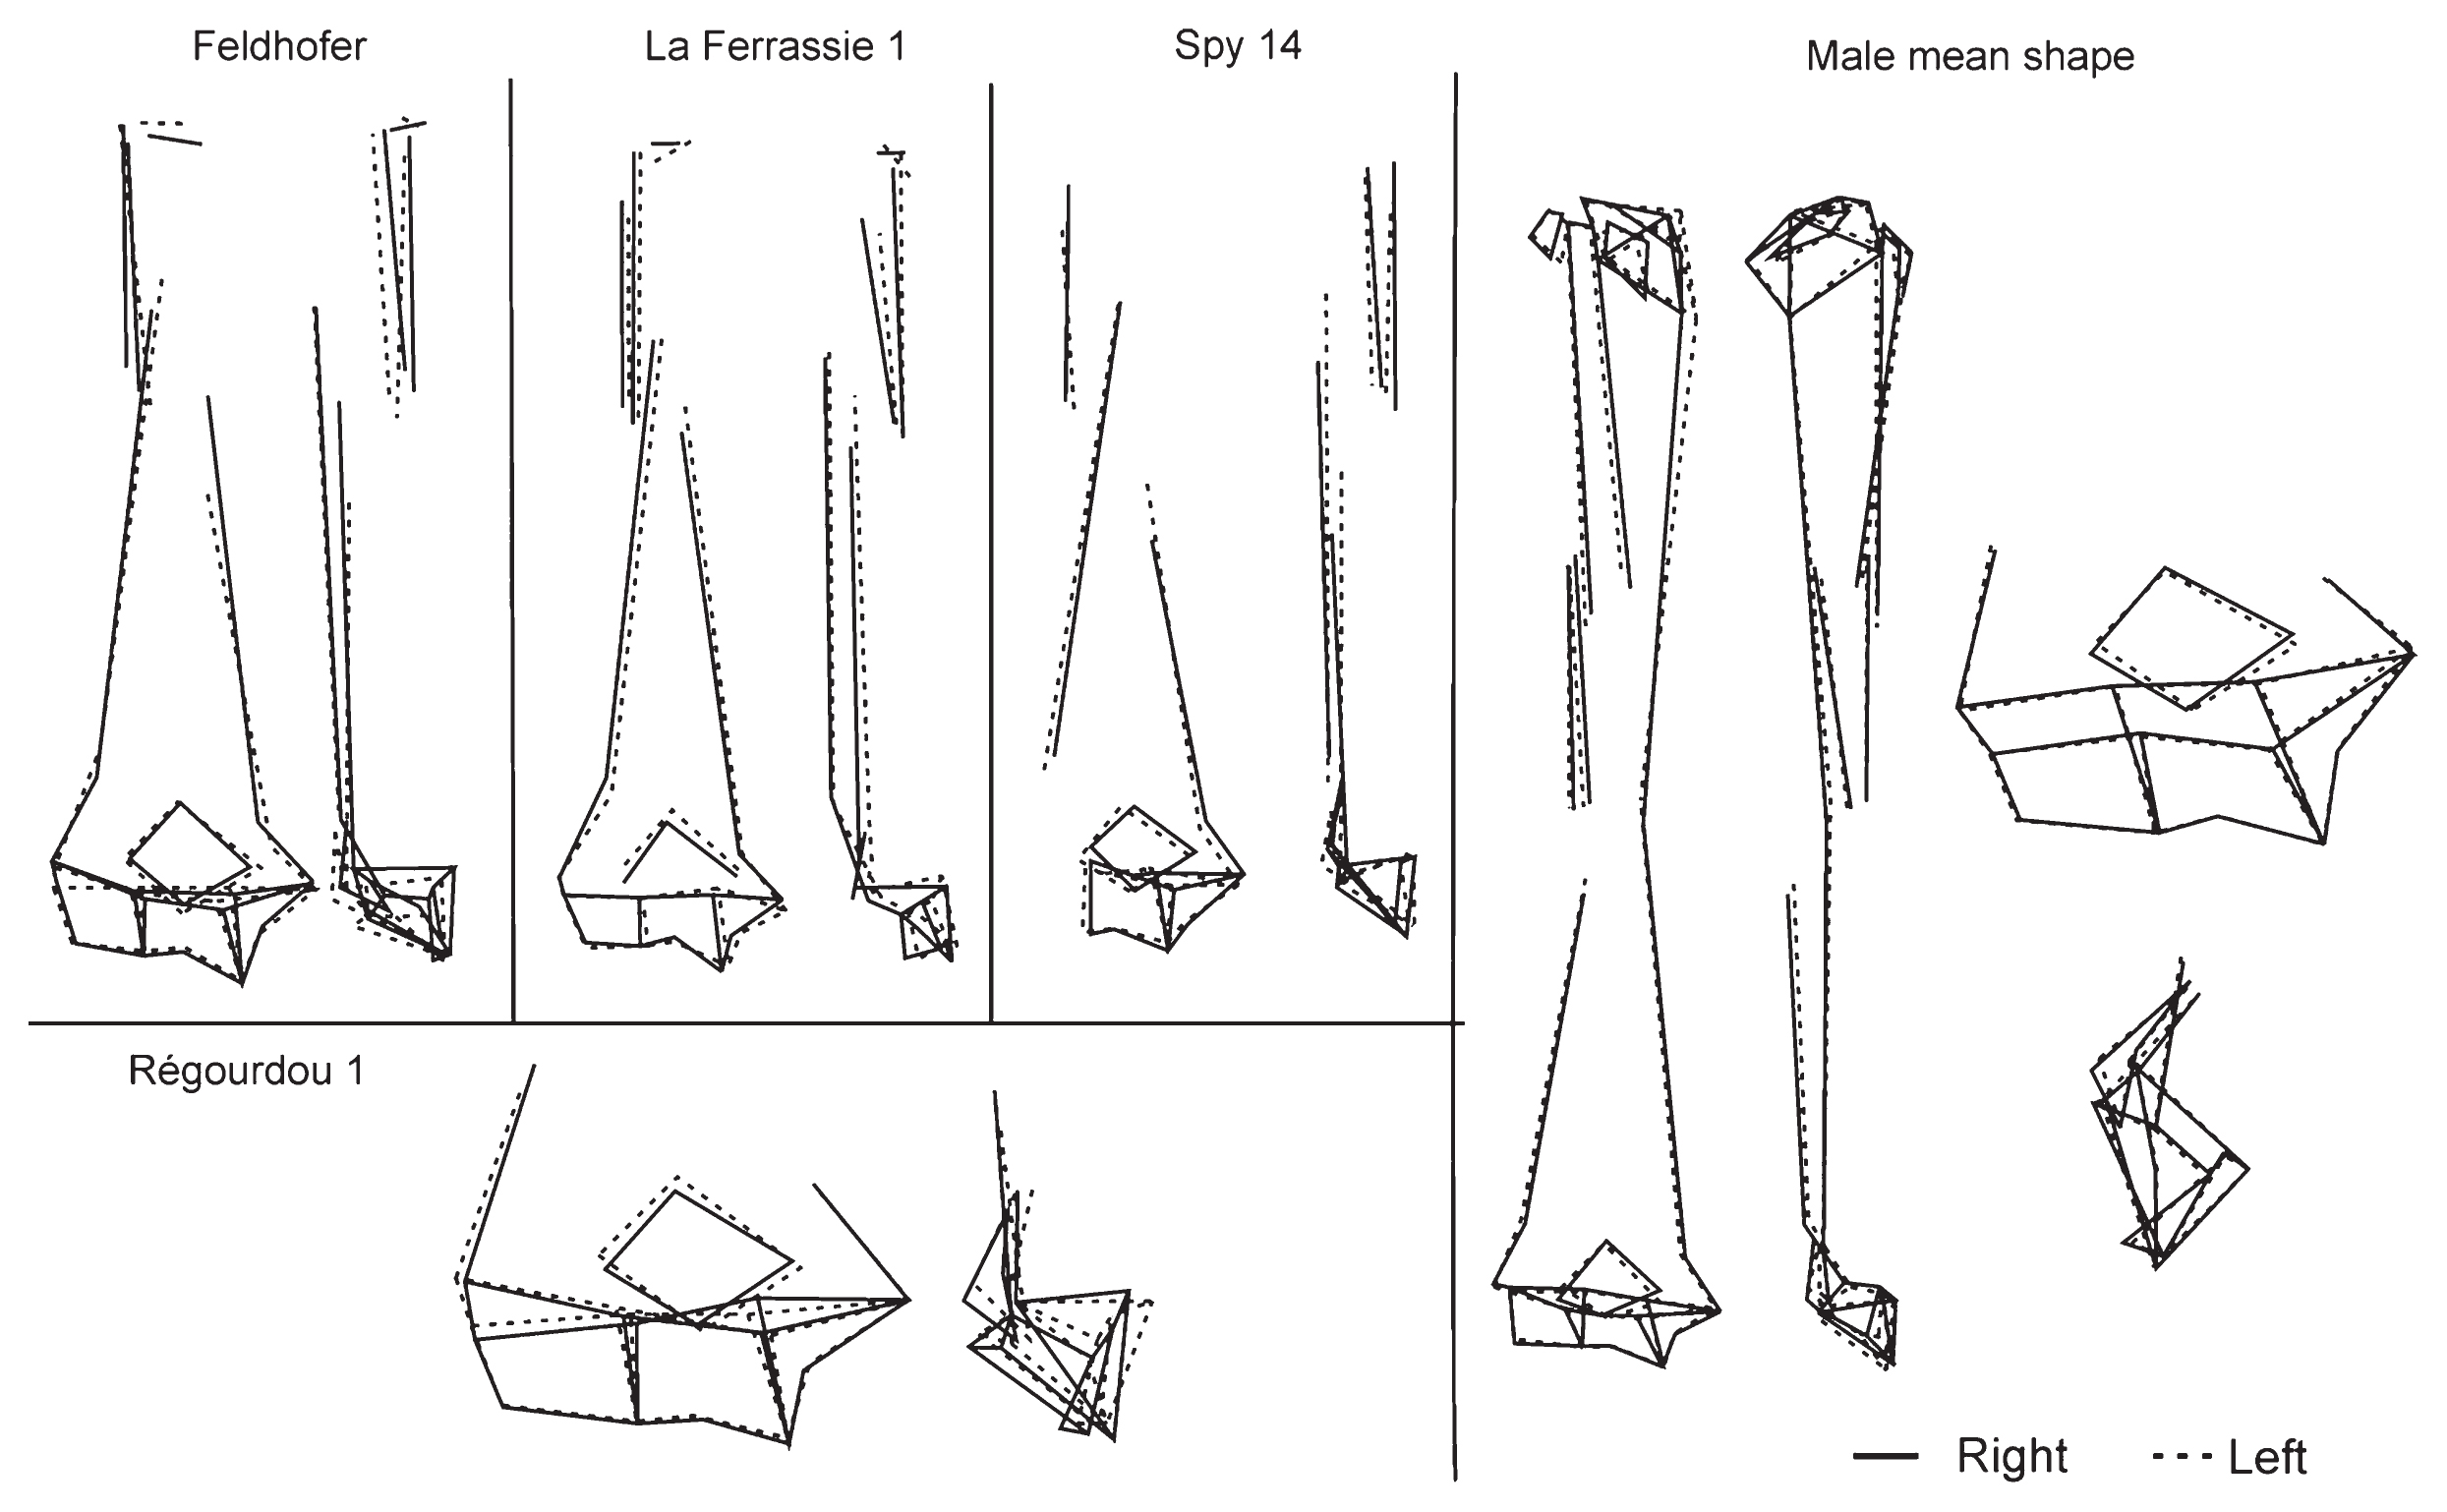
Representation by wireframes of the Neanderthal laterality and the male mean shape of the modern human population.
To compare the laterality patterns between the Neanderthals and the AMHs, only males from the modern sample were considered because all Neanderthal individuals were identified to be male. To test the laterality pattern between these two species a multivariate regression analysis with qualitative variables (shape vs. side) was carried out for each species and then the regression vectors were compared. The result of this analysis shows an angle of 76.72° between them, which is not statistically significant (P = 0.111). This result indicates a different pattern of laterality between AMHs and Neanderthals. In Figure 5 it can be observed that Neanderthal morphology presents variability in its features. However, the best preserved feature in all the Neanderthal samples, and the one that shows the same pattern in all of them, is the olecranon fossa width. It is larger in the Neanderthals’ left humeri, while in AMHs it is larger on the right side.
Finally, the olecranon fossa width was calculated in order to confirm this laterality pattern. In AMHs the olecranon fossa width mean of the right humerus (26.91 mm) is greater than that of the left humerus (26.07 mm), whereas in Neanderthals the right olecranon fossa width (29.15 mm) is smaller than that of the left humerus (31.77 mm).
The laterality pattern in the AMH population studied here shows that 84.15% of right humeri are larger than left humeri. This percentage fits into the proportion of right-handed individuals within current populations (Annett, 1970, 2002; McManus, 1979; Porac et al., 1980, 1986; Perelle and Ehrman, 1994; Marchant et al., 1995; Marchant and McGrew, 1998; Singh et al., 2001; Faurie et al., 2005). When the mean CS between right and left humeri is compared the results are not significant, although the mean of the right humerus is larger than the left. This greater size of the right humerus was also observed in previous studies such as Cuk et al. (2001), Auerbach and Ruff (2006), Sládek et al. (2007), Weiss (2009) and Blackburn (2011), who associated this difference in size with the preferential use of the right side.
All shape analyses (except the male diaphysis) show significant differences between sides. However, when the allometry effect is removed (i.e. the shape component related with the size) we obtain two different results.
On one hand, the complete humerus and both epiphyses continue to be significant. Therefore, humeral laterality can be explained by a non-allometric component (not related to the size). This result could imply a differential activity pattern in both arms. Because mechanical loads on epiphyses experienced before adulthood may produce changes in these structures (Blackburm, 2011), they are therefore manifest in the complete humerus. These differences could be reflected in features such as humeral torsion (Rhodes, 2006; Rhodes and Churchill, 2009; Roach et al., 2012), septal perforation in the olecranon fossa (Singhal and Rao, 2007), and the carrying angle (Paraskevas et al., 2004; Tükenmez et al., 2004).
On the other hand, the result obtained for the diaphysis indicates that its shape variation could be explained by an allometric component, i.e. shape variability is related to size variability. In the present study, shaft laterality has mainly been analyzed via muscle attachment length (pectoralis major, teres major, and deltoids) and the coracobrachialis position. These results show that the relative length of the muscle attachments depends on shaft size: when the shaft is greater, the muscle attachment will be longer. Our findings complement previous studies about shaft cross-section (Cuk et al., 2001; Auerbach and Ruff, 2006; Stock et al., 2013). These authors concluded that the diaphysis is the most asymmetric region in the humerus in response to physical activity, because in the shaft higher mechanical stresses provoke greater muscle pressures in the bone, causing an increase in cortical bone (Cuk et al., 2001; Auerbach and Ruff, 2006; Stock et al., 2013). Therefore physical activity causes an increase in the thickness of the cortical bone in the diaphysis, but the shape of the shaft can be explained by size.
Our qualitative regression analysis shows that the patterns of humeral asymmetry are similar between the sexes, although some differences in shape have been described, with female samples showing greater differences in the diaphysis than male ones. These results do not coincide with those of Auerbach and Ruff (2006), who observed a different asymmetry pattern based on sex. They concluded that in men diaphyseal dimensions and vertical head diameter are more asymmetric, while in women the humeral length is more asymmetric. Despite differences between the two studies, the laterality pattern could be associated with different activity patterns related to the different manipulative behaviors of the sexes (Sládek et al., 2007, 2016). In this work, we have observed through 3DGM that the female mean shape presents higher laterality differences than in males. This could be explained by the sociocultural structure of the sample. In the Palencia and Valladolid population of the early 20th century, 75.3% worked in agriculture. Of the active population, 91.5% were men, while women took care of the housework along with their children (Azagra Ros and Chorén Rodríguez, 2006, 2007). This marked sexual division of labor could explain this small difference in the laterality pattern between the sexes.
In the comparative study of laterality between Neanderthal and modern human populations, the same size pattern is found in both samples (the right humerus is larger than the left), except in La Ferrassie 1, in which the left humerus is slightly larger. This result may be due to the methodology. 3DGM studies size in a relative way based on the distances between each landmark and the centroid (Zelditch et al., 2004), and so this result depends on a relative measure instead of an absolute one. The most asymmetric specimen in size is Feldhofer, due to the presence of a proximal epiphyseal fracture in the left ulna. This causes pathological alterations in the distal epiphysis of the humerus (Schwalbe, 1901; Trinkaus et al., 1994), such that the elbow joint would have had limited movement in this arm, which would explain the reduced size of the arm.
In shape analysis, the mean shape comparison performed with common landmarks shows a non-significant result, which could be due to the small sample and/or to the fact that it only represents a small part of the humeral distal region, where no structure is fully represented. However, the right–left superposition indicates that the Neanderthal humerus has a different degree of variability in its morphology. The least variable feature is the olecranon fossa width, which is greater on the left side in all the Neanderthal samples. Furthermore, when the comparison between AMHs and Neanderthals was carried out with 12 landmarks, a different laterality pattern was observed. The feature that is maintained in all Neanderthals, and is different to AMHs, is the olecranon fossa width. In Neanderthals the left olecranon fossa is wider than the right, opposite to AMHs. As we have observed in the linear measurements, this coincides with the classical measurements taken by Heim (1982).
Neanderthals have been determined to be right-handed by different methodologies (LeMay, 1976; Holloway and De La Coste-Lareymondie, 1982; Trinkaus et al., 1994; Vandermeersch and Trinkaus, 1995) with an approximate ratio of 90% (Frayer et al., 2012; Uomini, 2011; Volpato et al., 2012). This proportion is very similar to that found in modern human populations, which ranges from 70% to 98% (Perelle and Ehrman, 1994; Marchant and McGrew, 1998; Faurie et al., 2005; among others). Although the right-handed proportion is similar between these two populations, the laterality pattern between Neanderthals and AMHs is different, as the 12-landmark comparison shows, the olecarnon fossa asymmetry being observed clearly in all Neanderthals studied. In light of these results it is necessary to consider the functional aspects of the olecranon fossa and, knowing that Neanderthals were right-handed, we raise the question of what kind of activities could be different in Neanderthals and H. sapiens populations in order to produce a differential size in the olecranon fossa.
The olecranon fossa is the anatomical region of the humerus that accommodates the olecranon process of the ulna during extension of the elbow (Staubesand, 1988; Williams et al., 1995). Different studies have observed that the larger size of the olecranon fossa and lesser breadth of the distodorsal pillars in Neanderthals compared with H. sapiens is a classical feature of this human group (Vandermeersch and Trinkaus, 1995; Bacon, 2000; Rosas et al., 2015). There are several studies about septal perforation in the modern human population (Singhal and Rao, 2007; Ndou et al., 2013) that suggest that the larger size and septal perforation are the result of bone resorption caused by an intermittent pressure of ulna olecranon or coronoid processes on the septum of the humerus during the flexion–extension movement of the elbow, which produces a greater hyperextension of this joint. In Neanderthals, this same phenomenon could explain the larger size of the left olecranon fossa.
Here, three possible behavioral patterns are proposed as part of a set of factors that can modify the skeletal morphology, where the larger size of the left olecranon fossa in Neanderthals may be due to functional factors. Perhaps the left arm made a stronger extension movement. These movements could be related to the ‘stuff-and-cut’ technique (Brace, 1975). This technique involves holding some material with the teeth and stretching it with the extended non-dominant armm while the dominant arm cuts the material. In addition, close-range hunting with thrusting spears (Schmitt et al., 2003; Shea and Sisk, 2010) could cause olecranon fossa asymmetry. The dominant arm (right side) would perform the pushing force at the back of the spear, while the non-dominant arm (left side) would act as a guide at the front of the spear, producing complete extension of the elbow (Schmitt et al., 2003). Furthermore, Shaw et al. (2012) have observed that the maximum muscle activity during the hunt occurs in the left side. These behaviors could have produced the differential pattern in arm asymmetry observed between Neanderthals and AMHs (Churchill et al., 1996).
Finally, we also propose that dragging a weight with the left arm in complete extension could also provoke greater pressure from the olecranon process on the olecranon fossa, increasing fossa size. Neanderthals were hunter-gatherers, and they would have had to walk long distances, transporting a range of objects, including relatively heavy materials or materials that require precise manipulation (lithic industry, spears, or fire). Materials that require more precise manipulation may have been transported with the dominant arm (the right hand in most cases) while heavier items could have been dragged with the non-dominant arm.
A set of all these activities, together with other factors, could explain the differential pattern in the olecranon fossa laterality of these two human species.
Here, we performed a humeral laterality study using 3DGM techniques in a current population of modern humans, and we compared this laterality pattern with a Neanderthal sample. With this methodology we can observe different results to those described in previous work. We conclude that there is a laterality pattern in shape that is statistically significant in the Spanish modern human population. Shape differences in both epiphyses and in the complete humerus can be caused by non-allometric factors, and the shaft shape laterality could be explained by allometry. In Neanderthals the right humerus is higher, and the mean shape comparison does not show significant differences.
In the AMH–Neanderthal comparison, the feature that shows the clearest differences between these species is the olecranon fossa, which is wider on the Neanderthal left side and on the modern human population right side. This difference could be due to a combination of different behaviors such as the ‘stuff-and-cut’ technique, close-range hunting and dragging weights with the left arm extended, among others, which are likely to have been regular Neanderthal activities.
We acknowledge the other members of the Paleoanthropology Group, MNCN–CSIC, and NESPOS and the people behind it for providing CT data. We are very thankful to T. Holliday (Tulane University), T. Kivell (University of Kent), A. Estalrrich (Senckenberg Research Institute and Natural History Museum Frankfurt) and I. Lozano-Fernandez (IPHES) for their suggestions and comments. We acknowledge reviewers for detailed suggestions which helped to improve the manuscript. We also thank copyeditor Zach Tobias (zstobias@gmail.com) for proofreading and correcting the manuscript. This work was supported by MINECO of Spain, grant nos. CGL2012-36682 and CGL2016-75109-P. L.P.C. has a predoctoral grant, BES-2013-066056, from MINECO, Spain.