Abstract
Ancient DNA analysis became paleogenomics once high-throughput sequencing technology was applied to ancient DNA sequencing. Paleogenomics based on whole-genome information from Neanderthals and Denisovans showed that small fragments of these genomes remain in the modern human genome, and corresponding studies of anatomical modern humans clarified the history of migration and expansion among Homo sapiens. Due to geographical and environmental conditions, paleogenomic studies have fallen behind in Eastern compared with Western Eurasia. Recently, however, various capture sequencing techniques, which can enrich ancient DNA, have been used in East Eurasia, and the field of paleogenomics has been further developed. This review briefly introduces the history of ancient DNA analysis leading to paleogenomics, outlines three sequencing stages (partial, draft, and complete genome sequencing) and capture methods, and discusses the necessity of high-quality sequencing for paleogenomes of Eastern Eurasia.
Introduction
Ancient DNA analysis started in the mid-1980s based on the Sanger sequencing method following molecular cloning using plasmids (Higuchi et al., 1984; Pääbo, 1985). With the spread of the polymerase chain reaction method, ancient DNA analysis began to be used from the end of the 20th century to examine many remains from various extinct organisms, including archaic hominins. First of all, Neanderthal mitochondrial (mt) DNA sequences had a strong impact on human evolutionary studies: the nucleotide sequence data of the hypervariable region (HVR) showed that Neanderthals (Homo neanderthalensis) were outside of modern humans (Homo sapiens) in terms of genetic diversity (Krings et al., 1997). The next epoch began when high-throughput sequencing technology (next-generation sequencing (NGS)) was applied for analyzing the nuclear genome from the skeletal remains of a Neanderthal (Green et al., 2006). This partial genome sequencing (0.04% of the whole genome) confirmed the conclusion of mtDNA D-loop sequencing. Since then, ancient DNA analysis has come to be known as paleogenomics.
Many have expressed amazement at the subsequent breakthroughs made possible by paleogenomics. A draft whole-genome sequence of a Neanderthal revealed that the genomes of non-African H. sapiens today contain about 1–4% of the sequence inherited from Neanderthals (Green et al., 2010). In the same year, a draft whole-genome sequence of a Denisovan was also reported: no complete skeletal remains had been recovered, but DNA was successfully extracted from a piece of tiny bone excavated from Denisova Cave in the Altai mountains. The genomic data identified Denisovans as a sister group to the Neanderthal lineage (Reich et al., 2010). Subsequently, the great achievements of “non-draft” whole-genome sequencing of three archaic hominin individuals, Denisovan, Altai, and Vindija Neanderthals, were reported (Meyer et al., 2012; Prüfer et al., 2014, 2017). The high-coverage genome sequences (30- and 52-fold coverages for Denisovans and Neanderthals from Altai, respectively) depicted a new human evolutionary history, including changes in population size and gene flow over time among archaic hominins and H. sapiens (Browning et al., 2018; Enard and Petrov, 2018; Greenbaum et al., 2019; Jacobs et al., 2019; Laval et al., 2019; Meyer et al., 2012; Moorjani et al., 2016; Prüfer et al., 2014; Qin and Stoneking, 2015; Racimo et al., 2017; Sankararaman et al., 2012, 2014, 2016; Slon et al., 2018; Vernot et al., 2016; Vernot and Akey, 2014; Villanea and Schraiber, 2019).
Paleogenomic technology has also been applied to ancient H. sapiens (anatomical modern humans (AMH)) specimens, but the sequencing strategy in several research projects has been slightly modified compared with those in archaic hominins. Namely, in archaic humans, complete whole-genome sequencing was the aim, but in many ancient AMH specimens, complete sequencing was not achieved after draft sequencing had been reported, and analyses based on partial sequencing and single-nucleotide polymorphism (SNP) capture became the mainstream. The whole-genome sequence of Paleo-Eskimo (4000 years ago (hereafter 4.0 kya)) was reported in 20-fold coverage (Rasmussen et al., 2010). Similarly, the whole-genome sequence of the oldest West Eurasian individual, Ust’-Ishim (45 kya) from Russia, was reported with high-quality (42.0-fold coverage) wholegenome sequencing (Fu et al., 2014). However, the coverages of the whole-genome sequences of the oldest East Eurasian individual excavated from the Tianyuan cave site (41.1–39.5 kya) and the oldest individual found to date with a close relationship to present-day Europeans, Kostenki 14 (38.7–36.2 kya) from Russia, were moderate (1.7–4.1- and 2.84-fold coverage, respectively) (Fu et al., 2013; Seguin-Orlando et al., 2014; Yang et al., 2017). The genome sequences of Goyet Q116-1 from Belgium (35.1–34.4 kya; the individual shows genetic affinity with both present-day Europeans and Tianyuan) and Mal’ta 1 from Russia (24 kya; the individual is closely related to Native Americans) were 1.05- and 1.17-fold coverages (Fu et al., 2016; Raghavan et al., 2014), respectively. Different sequencing strategies between archaic hominins and ancient AMHs are probably because a reference sequence of H. sapiens is already available and ancient AMHs are not substantially different from modern humans. Therefore, more recent paleogenomic studies have been conducted using many individuals with low-coverage genome sequences (Allentoft et al., 2015; de Barros Damgaard et al., 2018; Fu et al., 2016; Gamba et al., 2014; González-Fortes et al., 2017; Haak et al., 2015; Hofmanová et al., 2016; Lazaridis et al., 2014, 2016; Lipson et al., 2017, 2018; Mathieson et al., 2015, 2018; McColl et al., 2018; Narasimhan et al., 2019; Olalde et al., 2015, 2018, 2019; Patterson et al., 2012; Raghavan et al., 2014, 2015; Reich et al., 2012; Sikora et al., 2017, 2019; Siska et al., 2017; Villalba-Mouco et al., 2019; Yang et al., 2020; Yu et al., 2020).
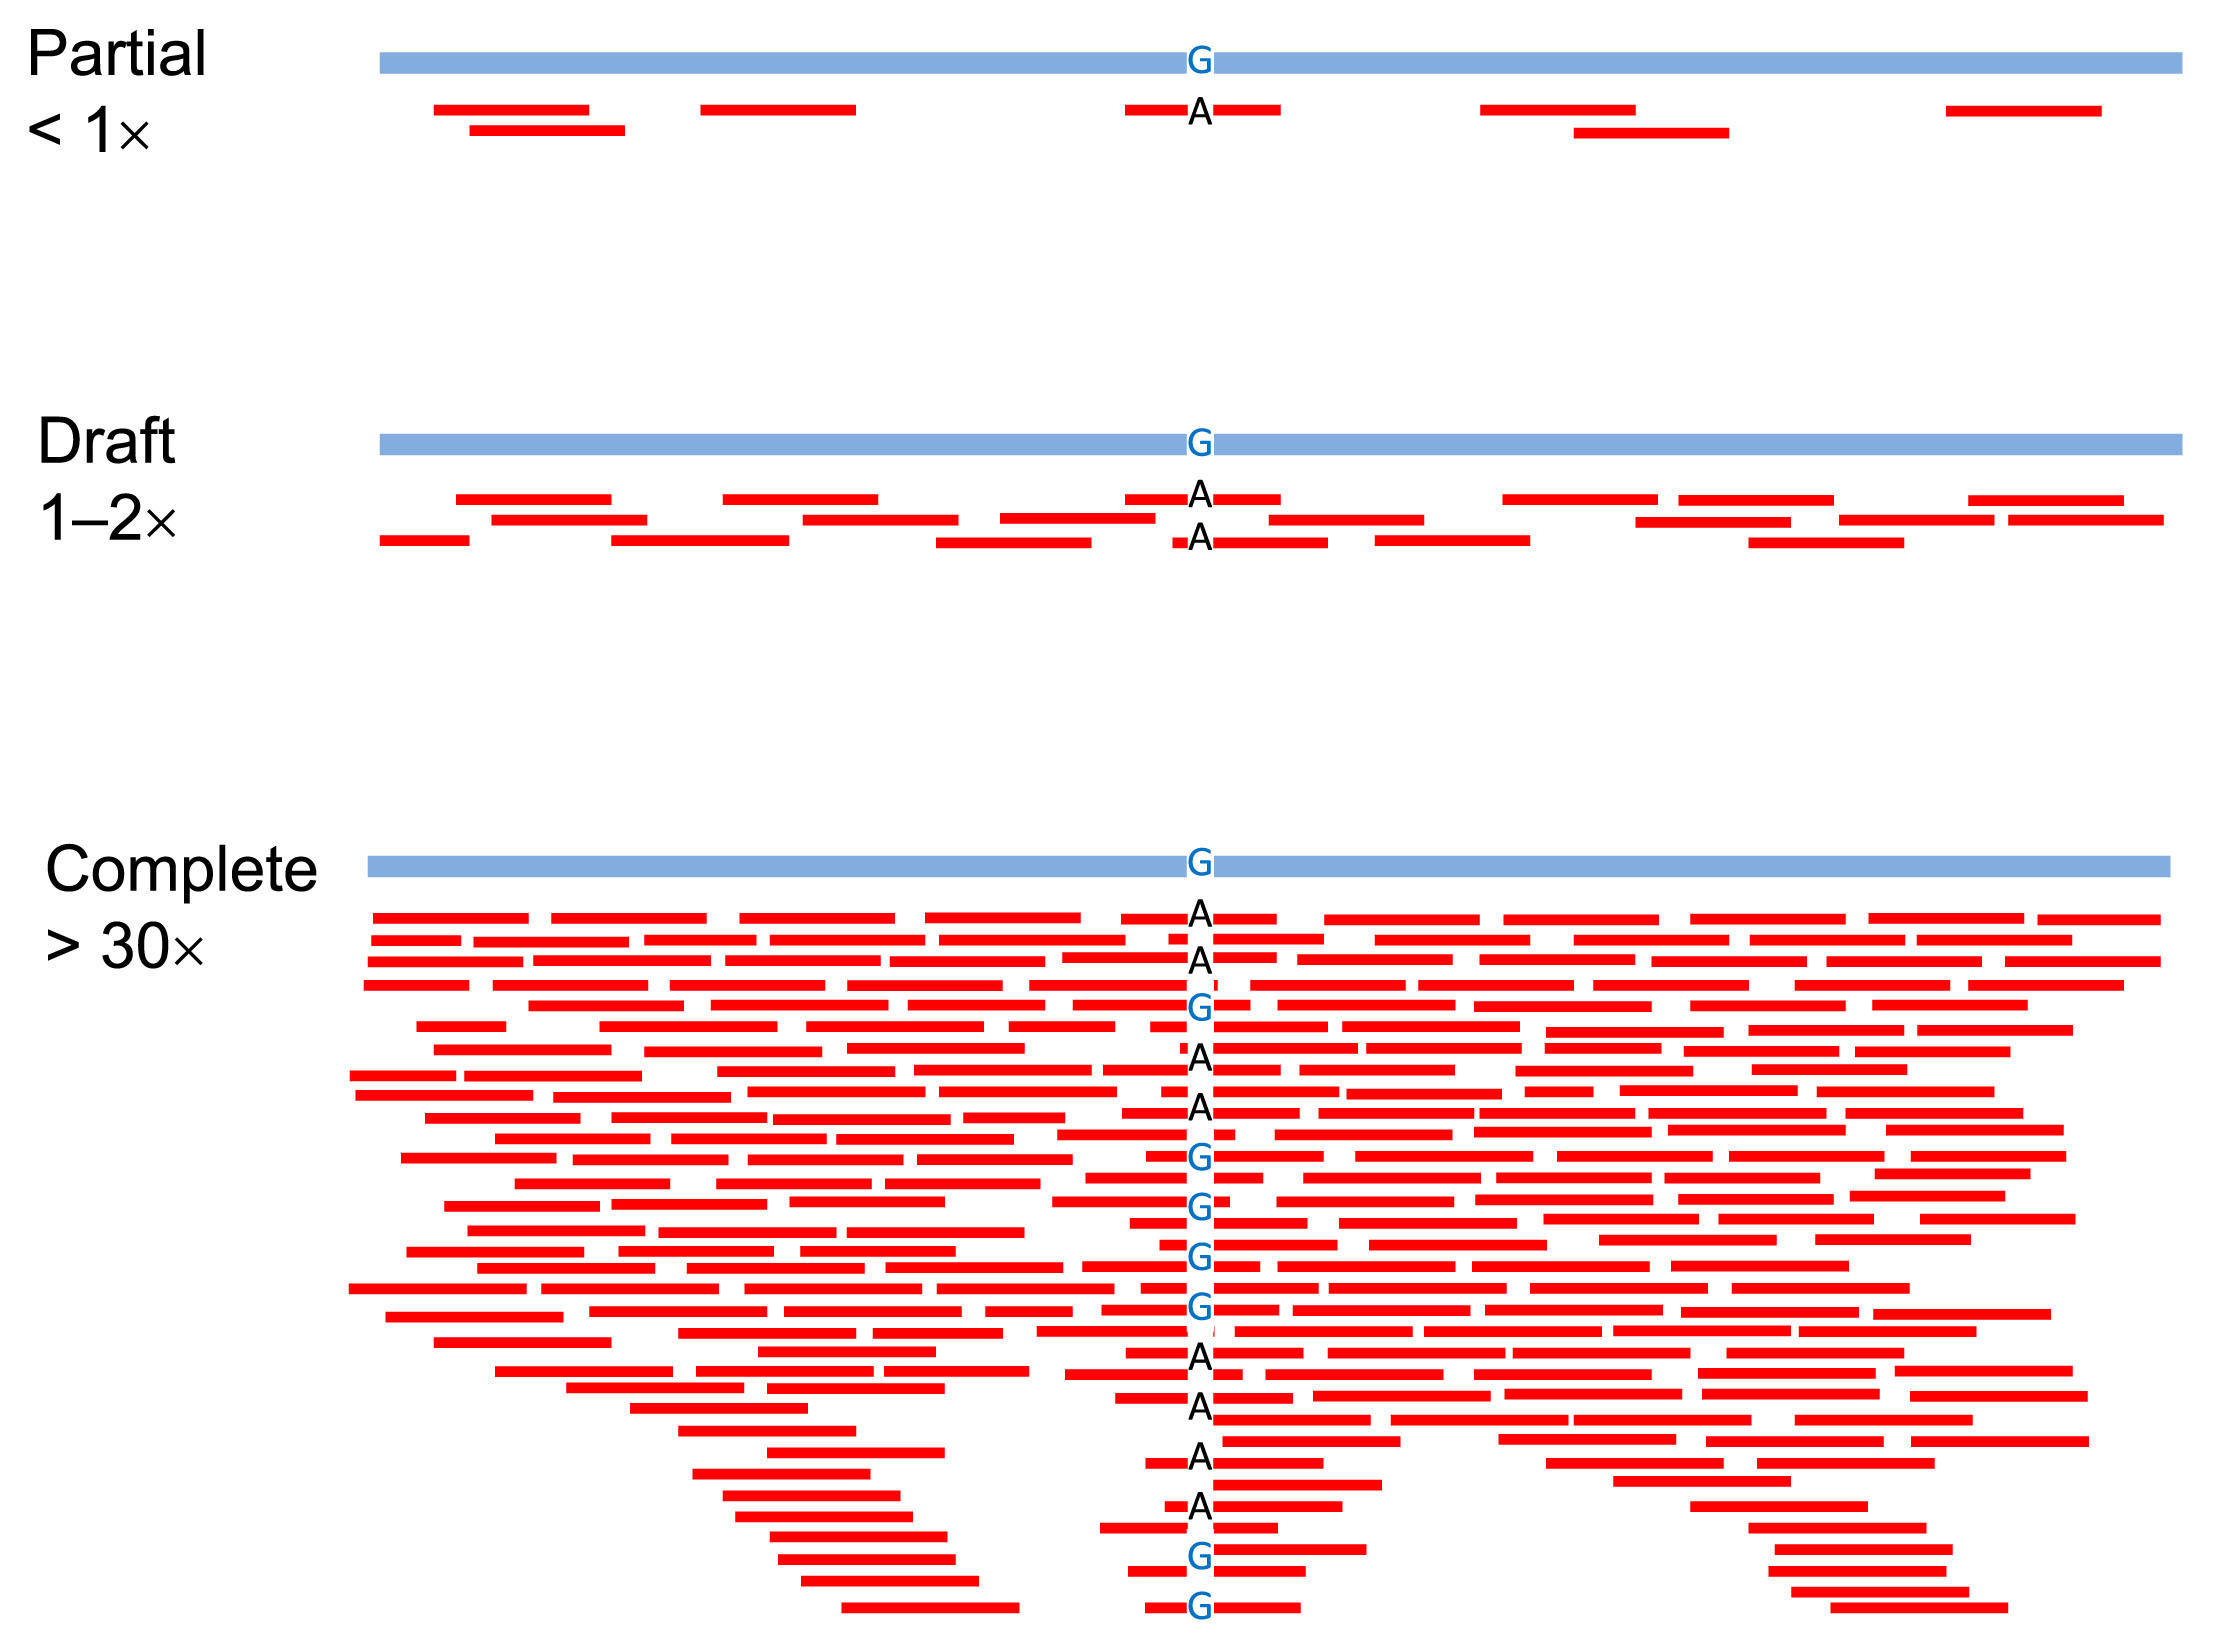
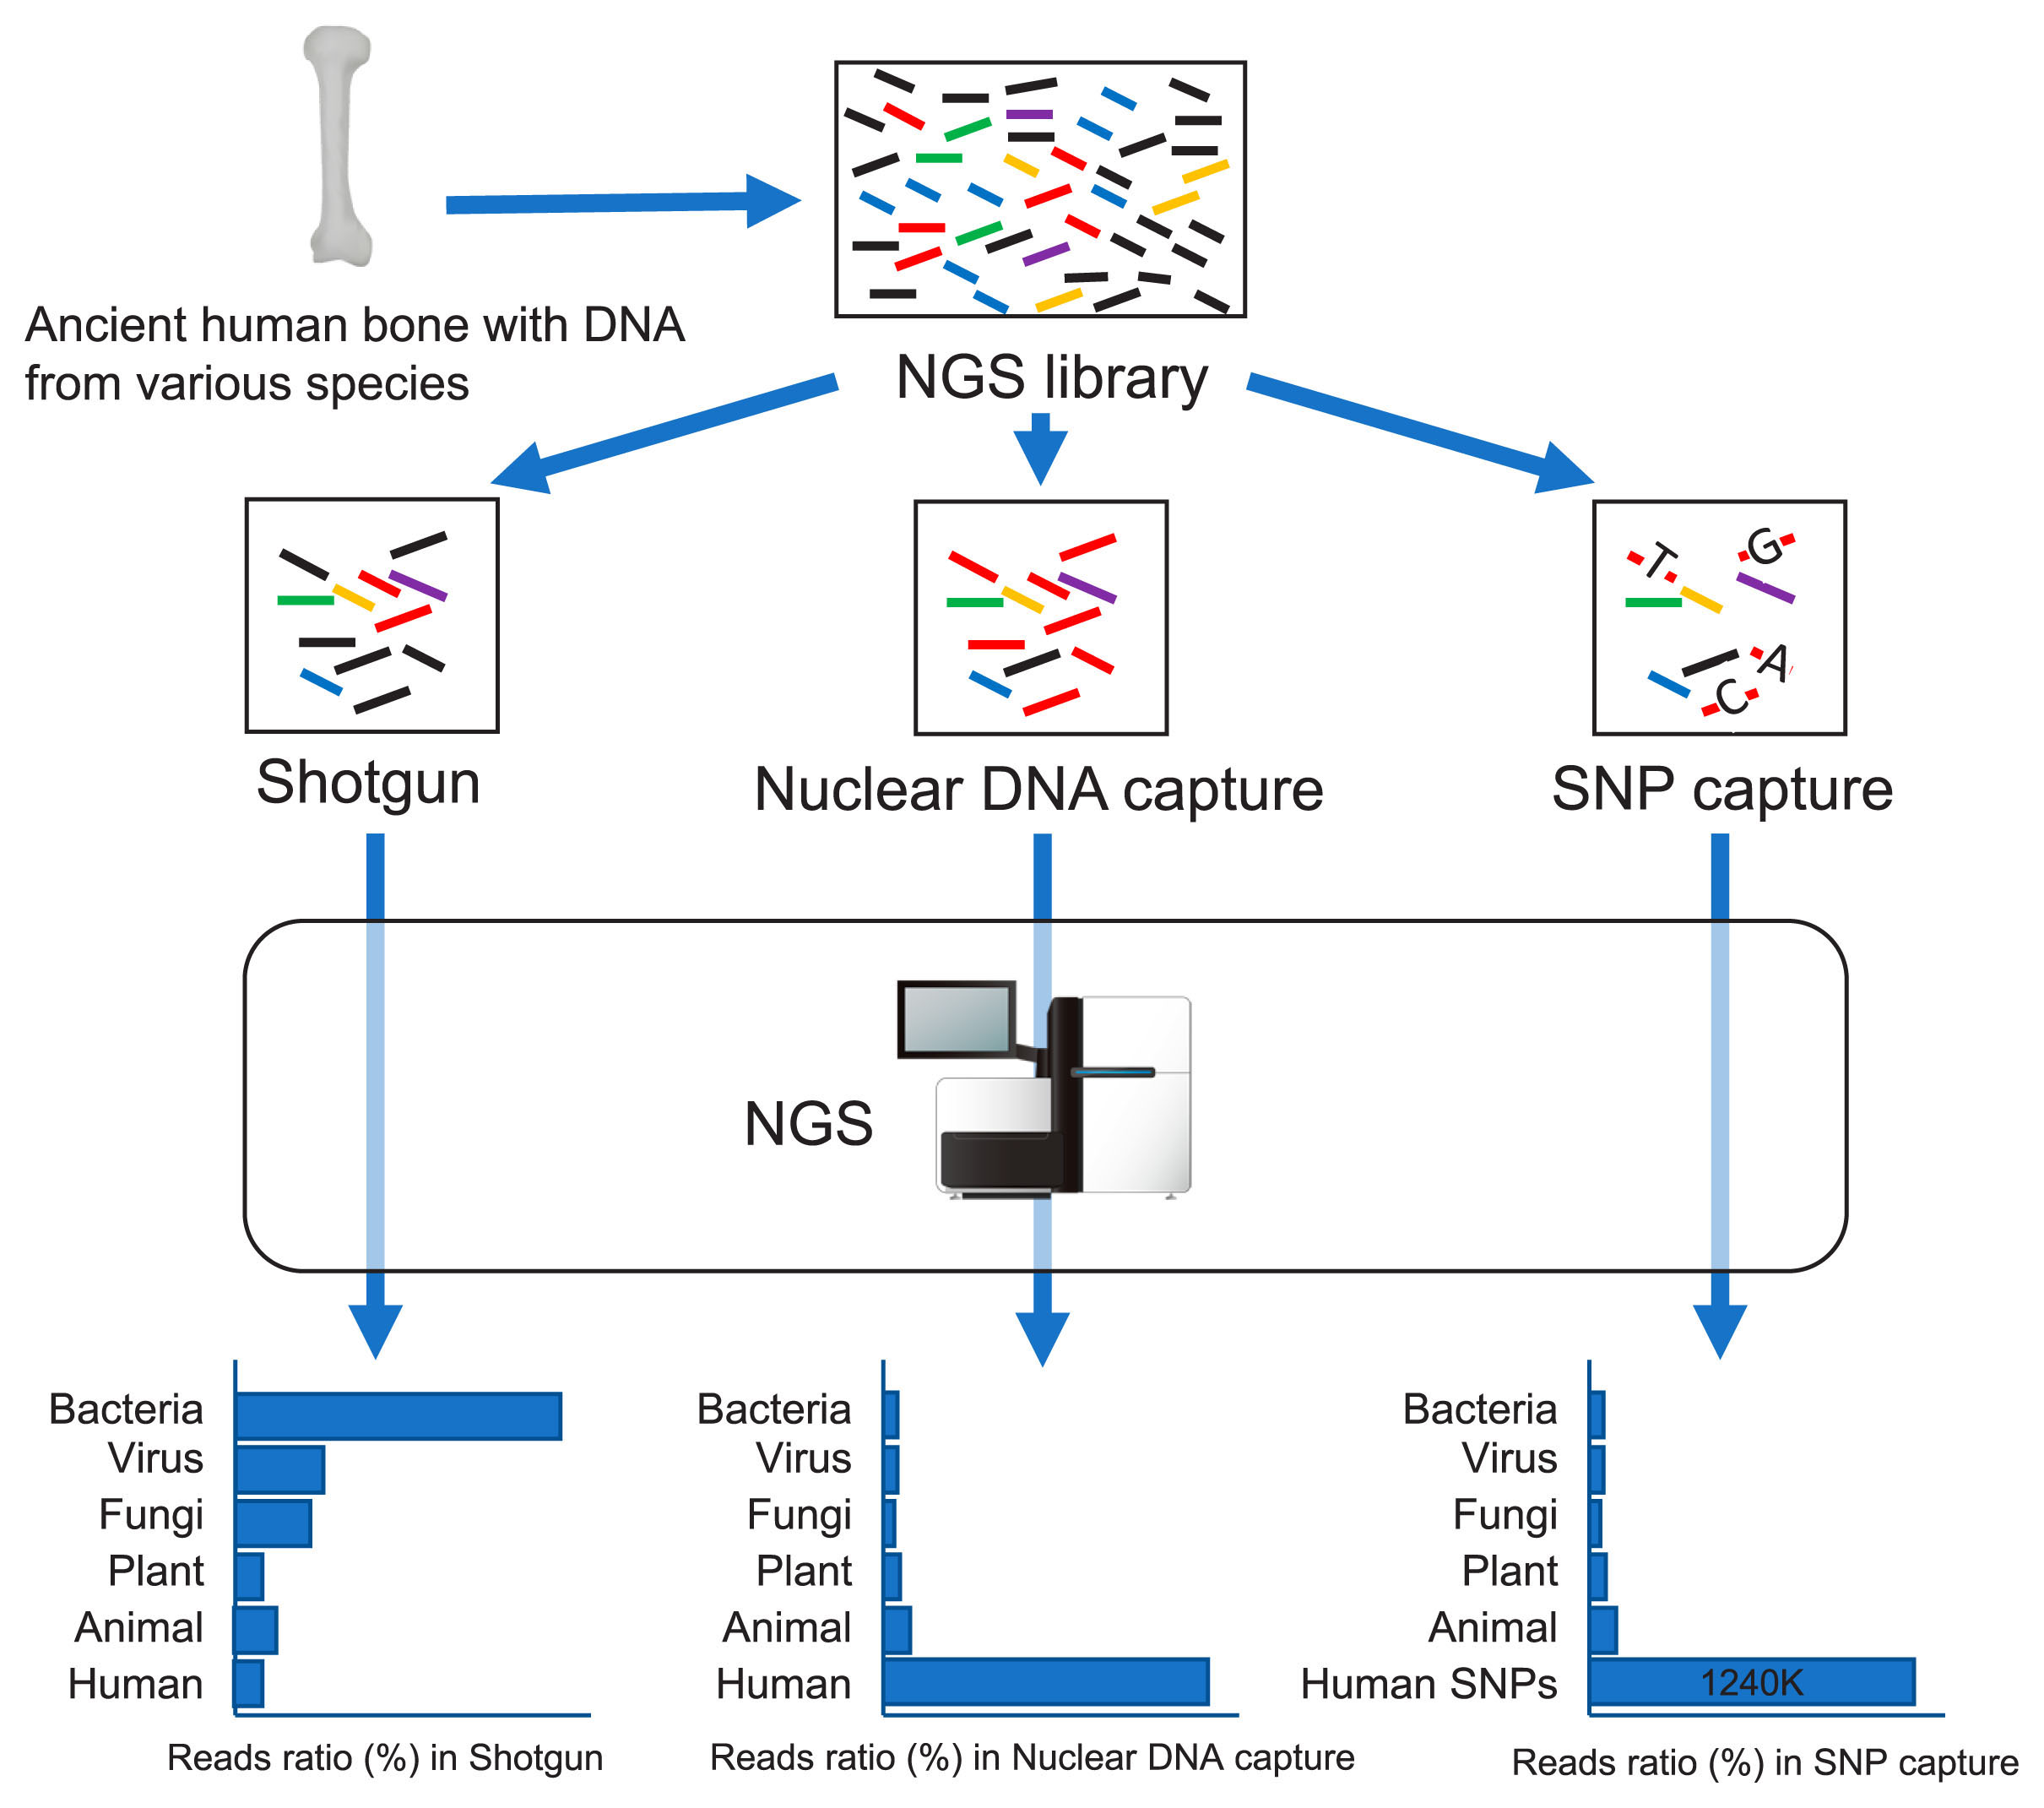
No exact definition currently exists for distinguishing partial, draft, and complete sequencing. However, in this review, we tentatively refer to 1- to 2-fold coverage wholegenome sequencing as ‘draft sequencing,’ 30-fold coverage and above as ‘complete whole-genome sequencing,’ and less than 1-fold coverage as ‘partial genome sequencing’ (Figure 1). We then discuss the advantages of each, including SNP capture sequencing (Figure 2), and what direction should be considered in paleogenomic research in East Asia, including the Japanese archipelago (Yaponesia), in the near future.
Increasing the reliability of genome sequence on paleogenomics
The three levels of sequence quality defined in this paper are shown visually in Figure 1. The top line of each row is the human reference sequence determined by the Human Genome Project (International Consortium Human Genome Sequencing, 2004). The short pieces below are the outputs of NGS analysis, each called a ‘read.’ In the partial sequencing, the reads mapped to the reference sequence are sparse, but in the draft sequencing, they ideally cover the entire reference sequence. Thus, a draft sequence means that the entire genome sequence has been read at least once or twice on average. Meanwhile, in the ‘complete’ whole-genome sequence, the same region in the reference sequence is read multiple times. Since reads overlap many times, this is called ‘read deeply.’ If a different allele from the reference sequence is detected (e.g. G to A) in the partial sequence, an error may have occurred in the NGS reaction. If it is A in the draft sequence, it might be a ‘real’ A allele. The deeper the read, the clearer it is. However, when the depth remains shallow, it is unknown whether it is homozygous or heterozygous. It is generally considered that homozygous/heterozygous status can be distinguished when reading more than 30 times, and therefore in many cases it is permissible to consider 30-fold coverage or higher as ‘complete’ whole-genome sequencing.
Sequencing methods for paleogenomics
Three sequencing methods have mainly been adopted in paleogenomic analysis based on the state of DNA preservation and/or depending on the researchers’ purpose (Figure 2). After extracting DNA from ancient human bone, an artificial sequence (adapter) is attached to the end of the DNA; this is called the ‘NGS library.’ In addition to the DNA of the specimen, the DNA extracted from ancient human bone contains the DNA of bacteria, virus, fungi, plants, and animals that entered from the soil postmortem. Shotgun sequencing is a method to read all of these DNA sequences with NGS. However, depending on the state of preservation of ancient human bones, more than 99% of the extracted DNA is that of non-human organisms; the endogenous DNA of ancient human bone is often less than 1%. Nuclear DNA capture is a method of enriching only human nuclear DNA from an NGS library containing the DNA of various species (e.g. bacteria, fungi). The method can find not only known SNPs but also novel ones. SNP (e.g. 1240K) capture techniques enrich reads including only known SNPs from the outputs of NGS. Only the reads containing particular SNPs are concentrated, so the depth of the reads containing the SNPs becomes deeper. However, if the original NGS library contains too little human DNA, capture methods do not work.
Difficult delivery of paleogenomics in Yaponesia
Japanese researchers soon began to analyze ancient AMH DNA. In the earliest analysis, mtDNA HVRs were sequenced in five Jomon individuals (Horai et al., 1991). Subsequently, nuclear polymorphic loci (variable number of tandem repeats) were examined in two individuals from the Kofun (tumulus) period (Kurosaki et al., 1993). Population studies of ancient mtDNA had already begun in the 1990s (Oota et al., 1995, 1999, 2001; Shinoda and Kanai, 1999; Wang et al., 2000), and subsequently expanded into mtDNA haplogroup analysis and entire mtDNA sequencing (Adachi et al., 2009, 2013; Kanzawa-Kiriyama et al., 2013; Mizuno et al., 2014, 2017; Sato et al., 2007), even into a nuclear locus encoding a functional gene (Sato et al., 2010).
However, the application of NGS to ancient genome sequencing in Japan, which was first achieved by Kanzawa-Kiriyama et al. (2017), was 10 years later than its application to the Neanderthal genome. This delay was greatly influenced by the burial environment surrounding ancient Japanese human bones. The climate of the Japanese archipelago (Yaponesia) is warm and humid, and the soil is acidic because of the volcanic nature of the region. For these reasons, especially on Honshu (the largest island of the Japanese archipelago), it is difficult for human bones buried in the soil to survive, and even if they do, there is a high possibility that the DNA does not. Therefore, very few human remains from the paleolithic period have been found in Honshu, which is a big difference in comparison with Europe. For these geographical and geological reasons, ancient genome research in Japan has become extremely difficult. However, the situation has improved since discovering that abundant DNA could often be extracted from the petrous part of the temporal bone (Hansen et al., 2017; Pinhasi et al., 2015). A draft whole-genome sequence of a 2500-year-old Jomon woman from the Ikawazu shell-mound site in the Atsumi peninsula, Honshu, was subsequently reported (McColl et al., 2018), and a complete whole-genome sequencing of a Jomon individual from the Funadomari site in Rebun Island, Hokkaidō, was successfully achieved (Kanzawa-Kiriyama et al., 2019). The successful complete genome sequencing of the Funadomari Jomon individual might be due to the fact that the site is located in a subarctic zone where DNA is better preserved than in the temperate zones.
Increasing paleogenomic data in East Eurasia
As well as the Japanese archipelago, the geographical areas of Southeast Asia and southern China are not suitable for the preservation of ancient DNA because of their hot and humid environments. Table 1 summarizes ancient human genome studies, primarily in eastern Eurasia east of Lake Baikal. There is a wide range of eras from Upper Paleolithic to Iron Age, and the most common ones are Neolithic. If we look at the coverages of each individual, most of them do not exceed 1-fold coverage, and individuals with more than 10- fold coverage are rare. Because of the poor DNA preservation, strategies using capture techniques as opposed to shotgun sequencing have largely been standardized in the genome studies of East Eurasian human remains, except for Jomon genomes (Table 1). In the first report of Tianyuan, the oldest AMH specimen in East Asia, nuclear genome sequencing was restricted to a particular chromosome by target capture sequencing (Fu et al., 2013). Nuclear DNA capture sequencing was subsequently conducted (2.98- to 4.10-fold coverage) (Yang et al., 2017). The whole genomes of Mal’ta, Yana RHS, and Duvanny Yar in Siberia were sequenced by shotgun sequencing, but were not ‘complete,’ and those of some specimens used in the same papers had less than 1-fold coverage (Raghavan et al., 2014; Sikora et al., 2019).
Table 1
Ancient nuclear genome studies in Eastern Eurasia (East of Lake Baikal)
| Citation |
Period |
No. of individuals |
Local area/site/population |
Approximate dating (years before present) |
Nuclear genome coverage (fold) |
Method |
| Fu et al. (2013) |
Upper Paleolithic |
1 |
Near the Zhoukoudian site in northern China (Tianyuan) |
40000 |
1.75 (Chr. 21) |
Targeted capture sequencing |
| Yang et al. (2017) |
1.71–4.09 |
Nuclear DNA capture |
| Raghavan et al. (2014) |
Upper Paleolithic |
1 |
MA-1 |
24000 |
1.17 |
Shotgun sequencing |
| Sikora et al. (2019) |
Upper Paleolithic –Post Iron Age |
1 |
Yana RHS (Yana1) |
31600 |
25 |
Shotgun sequencing |
| 1 |
Yana RHS (Yana2) |
|
7 |
| 1 |
Duvanny Yar (Kolyma1) |
9800 |
14 |
| 14 |
Ekven, Uelen, Magadan |
3000–2000 |
0.003–1.681 |
| 6 |
Devil’s Gate Cave |
7600 |
0.105–6.56 |
| 6 |
Ust’Belaya |
6500–600 |
0.058–1.835 |
| 1 |
Yana (Young Yana) |
800 |
1.947 |
| Jeong et al. (2016) |
Prehistoric |
1 |
Himalayan arc (Chokhopani) |
3150–2400 |
7.253 |
Shotgun sequencing |
| 3 |
Himalayan arc (Mebrak) |
2400–1850 |
0.044–1.048 |
| 4 |
Himalayan arc (Samdzong) |
1750–1250 |
0.090–3.493 |
| Kanzawa-Kiriyama et al. (2017) |
Neolithic |
1 |
Fukushima Prefecture (Sanganji 131421-3) |
3000 |
0.01* |
Shotgun sequencing |
| 1 |
Fukushima Prefecture (Sanganji 131464) |
3100 |
0.02* |
| Siska et al. (2017) |
Neolithic |
5 |
Devil’s Gate Cave |
9400–7200 |
0.001–0.059 |
Shotgun sequencing |
| McColl et al. (2018) |
Neolithic–Iron Age |
3 |
Laos |
8000–2400 |
0.603–1.341 |
Shotgun sequencing |
| 3 |
Malaysia |
3200–450 |
0.012–1.729 |
| 9 |
Vietnam |
4300–300 |
0.103–0.257 |
| 1 |
Indonesia |
2300 |
0.143 |
| 3 |
Thailand |
1800–1700 |
0.161–0.422 |
| 1 |
Japan |
2500 |
1.85 |
| 0 |
Philippines |
— |
— |
| 1 |
Laos |
2400 |
0.942 |
Nuclear DNA capture |
| 3 |
Malaysia |
3900–400 |
0.021–0.343 |
| 3 |
Vietnam |
3800 |
0.006–0.009 |
| 1 |
Indonesia |
1900 |
0.105 |
| 5 |
Thailand |
1800–1700 |
0.008–0.163 |
| 0 |
Japan |
— |
— |
| 2 |
Philippines |
1900–1800 |
0.004–0.029 |
| Lipson et al. (2018) |
Neolithic–Iron Age |
8 |
Vietnam (Man Bac) |
4100–3600 |
0.005–0.106 |
1240K capture |
| 2 |
Vietnam (Nui Nap) |
2100–1900 |
0.042–0.373 |
| 2 |
Myanmar (Oakaie 1) |
3200–2700 |
0.011–0.178 |
| 5 |
Thailand (Ban Chiang) |
3500–2400 |
0.005–0.030 |
| 1 |
Cambodia (Vat Komnou) |
1900–1700 |
0.047 |
| Kanzawa-Kiriyama et al. (2019) |
Neolithic |
1 |
Rebun Island (F23) |
3500–3800 |
48 (peak of depth) |
Shotgun sequencing |
| 1 |
Rebun Island (F5) |
3500–3800 |
1 (peak of depth) |
| Yang et al. (2020) |
Neolithic–Historic |
1 |
Innner Mongolia (Yumin) |
8400–8300 |
7.25 |
Nuclear DNA capture |
| 1 |
Shandong (Bianbian) |
9500 |
2.21 |
| 1 |
Shandong (Xiaogao) |
8800–8600 |
7.6 |
| 1 |
Shandong (Boshan) |
8300–8000 |
7.36 |
| 3 |
Shandong (Xiaojingshan) |
7900–7700 |
0.22–0.64 |
| 1 |
Fujan (Qihe) |
8400 |
0.45 |
| 1 |
Liang Island (Liangdao1) |
8300–8100 |
2.72 |
| 1 |
Liang Island (Liangdao2) |
7600 |
1.68 |
| 2 |
Fujan (Suogang) |
4800–4300 |
0.03–0.04 |
| 8 |
Fujan (Xitoucun) |
4600–4200 |
0.01–0.66 |
| 5 |
Fujan (Tanshian) |
4500–4200 |
0.01–0.41 |
| 1 |
Fujan (Chuanyun) |
300 |
0.38 |
| Ning et al. (2020) |
Neolithic–Iron Age |
2 |
Amur River Basin (early Neolithic) |
7500–7300 |
0.239–0.287 |
Shotgun sequencing |
| 1 |
Amur River Basin (Iron Age) |
2200–2100 |
0.068 |
| 3 |
Amur River Basin (Xianbei_Iron Age) |
2300–2100 |
0.095–0.241 |
| 1 |
West Liao River (Haminmangha_Middle Neolithic) |
5700 |
1.431 |
| 3 |
West Liao River (Banlashan_Middle Neolithic) |
5600–5100 |
0.048–5.878 |
| 3 |
West Liao River (Late Neolithic) |
4100–3300 |
0.212–2.398 |
| 2 |
West Liao River (Bronze Age) |
3100–2400 |
0.574–0.579 |
| 1 |
West Liao River (Bronze Age) |
3100–2400 |
1.653 |
| 3 |
Inner Mongolia (Middle Neolithic) |
5600–5100 |
0.065–0.348 |
| 3 |
Shaanxi (Late Neolithic) |
4300–4000 |
0.026–4.478 |
| 7 |
Upper Yellow River Basin (Late Neolithic) |
4100–3900 |
0.043–2.416 |
| 4 |
Upper Yellow River Basin (Late Neolithic) |
1900–1800 |
0.034–2.439 |
| 8 |
Yellow River Basin (Iron Age) |
6300–5100 |
0.047–6.824 |
| 8 |
Yellow River Basin (Late Neolithic) |
4300–3800 |
0.202–7.533 |
| 6 |
Yellow River Basin (later Bronze/Iron Age) |
2600–2100 |
0.033–2.048 |
| Yu et al. (2020) |
Upper Paleolithic–Bronze Age |
0 |
Angara River |
— |
— |
Shotgun sequencing |
| 0 |
Yenisei River |
— |
— |
| 1 |
Irkutsk City |
4400 |
0.449 |
| 0 |
Lena River |
— |
— |
| 4 |
Upper Lena River |
4000–3800 |
0.149–0.349 |
| 2 |
Lower Lena River |
4600–6600 |
0.487–0.579 |
| 1 |
Eastern Siberia |
14000 |
1.991 |
| 1 |
Angara River |
7300 |
0.037 |
1240K capture |
| 1 |
Yenisei River |
4700 |
1.628 |
| 3 |
Irkutsk City |
4400 |
0.465–1.518 |
| 9 |
Lena River |
6900–3700 |
0.220–1.511 |
| 2 |
Upper Lena River |
4000–3800 |
0.044–2.034 |
| 2 |
Lower Lena River |
4600–6600 |
1.665–2.067 |
| 1 |
Eastern Siberia |
14000 |
1.656 |
* Estimated value based on the percentage of bases covering hg19.
Many studies in East/Southeast Asia have combined and fully adopted capture sequencing techniques (Lipson et al., 2018; McColl et al., 2018; Yang et al., 2020; Yu et al., 2020). One characteristic of ancient genome analyses in East Eurasia is that the coverage remains low even after such enrichment, and SNP capture sequencing is often slightly better than nucleotide DNA capture sequencing. These techniques are based on a strategy of abandoning high-coverage sequencing because of poor DNA preservation and ‘thinly’ and efficiently obtaining as much information of polymorphic sites as possible from more individuals. The strategy is suitable for analyzing the genomic information of ancient ‘populations’ rather than of ‘individual’ rare specimens by phylogenetic analysis.
Comparison of sequencing coverage
Low-coverage sequencing results in a small numbers of SNPs. If more than 5000 SNPs are available, it is generally thought that there will be no problem summarizing the population structure, such as with a principal-component analysis (PCA) plot (Wang et al., 2012). However, when trying to extract not only phylogeny, but also more information about biological functions, from the genome sequences, the low-coverage genome causes difficulty in estimating the phenotypes based on homozygous/heterozygous status, and the high-coverage genome turns out to be overwhelmingly reliable.
To discuss the effects of differences in coverage, we performed variant calls on four Jomon individuals whose genome sequences have been reported so far, categorizing them according to their coverages and comparing the genotypes of the genes that have been well studied in East Asia (Table 2). There are 39 SNPs in 12 genes that we are interested in because the derived alleles are particularly found in East Eurasian populations. We investigated genotypes and their allele depths based on the sequence data of Sanganji131464 (partial genome), IK002 and F5 (draft whole genome), and F23 (complete whole genome). We processed those data based on a method used in Sikora et al. (2017). Complete whole genome was called as diploid genome. Partial and draft whole genomes were called as pseudohaploid genomes which is a widely used method for low-coverage ancient genomes. For these particular SNPs, the partial genome sequence showed no information, even though phylogenetic analysis has been successfully carried out (Kanzawa-Kiriyama et al., 2017). The draft whole-genome sequences of IK002 and F5 gave 79.5% and 69.2% genotyping data, respectively. The complete whole-genome sequence of F23 gave 100% genotyping at the 39 SNP sites. The accuracy of these genotypings was supported by the allele depth. For example, a variation was observed between the rs13419896 genotypes (A/A in IK002 and G/G in F5) of the EPAS1 gene in Jomon people. The genotype involves the A/G heterozygotes shown in F23; this is based on the consistent results of the ancestral allele (G) and derived allele (A) determined by 10 and 8 reads, respectively. The two draft sequences detected only one allele on the basis of 3–4 reads and showed different genotypes being homozygous for A/A or G/G because of the generated pseudohaploid calls. However, those genotypes were called as homozygous based on the pseudohaploid calling method for low-coverage ancient genomes, and could actually be heterozygous. In F23, 10 of 39 SNPs were heterozygotes, whereas in IK002 and F5, all SNP sites were typed as homozygotes. Therefore, it is difficult to distinguish between homozygotes and heterozygotes in draft genome sequencing, and a complete genome sequence is required to distinguish between them.
Table 2
Comparison between sequencing coverages
|
Genotype |
Allele depth (reference/alternative) |
|
| Partial genome |
Draft whole genome |
Complete whole genome |
Partial genome |
Draft whole genome |
Complete whole genome |
| Gene |
rs number |
Chromosome |
Position |
Ancestral |
Derived |
Sanganji131464 |
IK002 |
F5 |
F23 |
Sanganji131464 |
IK002 |
F5 |
F23 |
Citation |
| EPAS1 |
rs13419896 |
2 |
46556345 |
G |
A |
—/— |
A/A |
G/G |
G/A |
0/0 |
0/3 |
4/0 |
10/8 |
Hanaoka et al. (2012), Beall et al. (2010) |
| rs4953354 |
2 |
46575388 |
A |
G |
—/— |
A/A |
A/A |
A/G |
0/0 |
3/0 |
2/0 |
6/5 |
| rs4953388 |
2 |
46713201 |
G |
A |
—/— |
G/G |
G/G |
G/G |
0/0 |
3/0 |
3/0 |
23/0 |
| EDAR |
rs3827760 |
2 |
109513601 |
A |
G |
—/— |
A/A |
A/A |
A/A |
0/0 |
4/0 |
3/0 |
15/0 |
Kanzawa-Kiriyama et al. (2019), Kimura et al. (2009) |
| WNT10A |
rs10177996 |
2 |
219746561 |
C |
T |
—/— |
C/C |
T/T |
T/T |
0/0 |
3/0 |
0/5 |
0/13 |
Kanzawa-Kiriyama et al. (2019), Kimura et al. (2015) |
| PERIOD2 |
rs934945 |
2 |
239155053 |
C |
T |
—/— |
C/C |
C/C |
C/C |
0/0 |
4/0 |
3/0 |
19/0 |
Akiyama et al. (2017) |
| rs11894535 |
2 |
239177073 |
C |
T |
—/— |
—/— |
—/— |
T/T |
0/0 |
0/0 |
0/0 |
0/16 |
| rs142175638 |
2 |
239187042 |
A |
G |
—/— |
G/G |
G/G |
G/G |
0/0 |
0/6 |
0/1 |
0/15 |
| rs190386281 |
2 |
239187679 |
G |
A |
—/— |
G/G |
G/G |
G/G |
0/0 |
1/0 |
1/0 |
20/0 |
| rs147573126 |
2 |
239187680 |
G |
C |
—/— |
G/G |
G/G |
G/G |
0/0 |
1/0 |
1/0 |
19/0 |
| rs4663302 |
2 |
239203761 |
C |
T |
—/— |
C/C |
C/C |
C/C |
0/0 |
4/0 |
1/0 |
23/1 |
| ADH1B |
rs2066702 |
4 |
100229017 |
C |
T |
—/— |
C/C |
C/C |
C/C |
0/0 |
3/0 |
3/0 |
12/0 |
Koganebuchi et al. (2017) |
| rs2066701 |
4 |
100238413 |
C |
T |
—/— |
C/C |
—/— |
C/C |
0/0 |
1/0 |
0/0 |
2/0† |
| rs1229984 |
4 |
100239319 |
G |
A |
—/— |
G/G |
—/— |
G/G |
0/0 |
1/0 |
0/0 |
14/0 |
| ADH1C |
rs698 |
4 |
100260789 |
C |
T |
—/— |
C/C |
—/— |
T/C |
0/0 |
3/0 |
0/0 |
3/3† |
| rs1693425 |
4 |
100266112 |
C |
T |
—/— |
—/— |
T/T |
C/T |
0/0 |
0/0 |
0/1 |
4/6 |
| rs1789920 |
4 |
100268856 |
A |
C |
—/— |
A/A |
—/— |
C/C |
0/0 |
1/0 |
0/0 |
0/1† |
| ALDH2 |
rs886205 |
12 |
112204427 |
C |
T |
—/— |
—/— |
T/T |
T/T |
0/0 |
0/0 |
0/3 |
0/15 |
| rs2238151 |
12 |
112211833 |
C |
T |
—/— |
C/C |
C/C |
T/C |
0/0 |
1/0 |
2/0 |
14/14 |
| rs4648328 |
12 |
112222788 |
C |
T |
—/— |
C/C |
—/— |
C/C |
0/0 |
4/0 |
0/0 |
13/0 |
| rs441 |
12 |
112228849 |
C |
T |
—/— |
T/T |
T/T |
T/T |
0/0 |
0/2 |
0/2 |
0/21 |
| rs671 |
12 |
112241766 |
G |
A |
—/— |
G/G |
G/G |
G/G |
0/0 |
1/0 |
3/0 |
10/0 |
| UCP1 |
rs3113195 |
4 |
141475837 |
A |
G |
—/— |
G/G |
G/G |
A/A |
0/0 |
1/2* |
0/2 |
7/0† |
Nishimura et al. (2017) |
| rs6536991 |
4 |
141481581 |
C |
T |
—/— |
T/T |
T/T |
T/T |
0/0 |
0/2 |
0/1 |
0/9† |
| rs12502572 |
4 |
141485134 |
A |
G |
—/— |
—/— |
G/G |
A/A |
0/0 |
0/0 |
0/1 |
5/0† |
| rs1800592 |
4 |
141493961 |
T |
C |
—/— |
T/T |
—/— |
T/C |
0/0 |
2/0 |
0/0 |
7/13 |
| rs4956451 |
4 |
141501338 |
A |
G |
—/— |
—/— |
—/— |
A/G |
0/0 |
0/0 |
0/0 |
1/3† |
| rs9995751 |
4 |
141515213 |
C |
T |
—/— |
C/C |
T/T |
T/C |
0/0 |
2/0 |
0/3 |
8/6 |
| TNFSF15 |
rs10114470 |
9 |
117547772 |
C |
T |
—/— |
C/C |
—/— |
C/C |
0/0 |
3/1* |
0/0 |
22/0 |
Nakagome et al. (2017) |
| rs3810936 |
9 |
117552885 |
C |
T |
—/— |
—/— |
C/C |
C/C |
0/0 |
0/0 |
1/0 |
15/0 |
| rs6478108 |
9 |
117558703 |
T |
C |
—/— |
T/T |
—/— |
T/T |
0/0 |
1/0 |
0/0 |
13/0 |
| rs4372078 |
9 |
117563687 |
G |
T |
—/— |
G/G |
—/— |
G/G |
0/0 |
1/0 |
0/0 |
11/0 |
| rs7848647 |
9 |
117569046 |
C |
T |
—/— |
C/C |
C/C |
C/C |
0/0 |
3/0 |
4/0 |
20/0 |
| rs10817678 |
9 |
117579457 |
A |
G |
—/— |
—/— |
—/— |
A/A |
0/0 |
0/0 |
0/0 |
8/0† |
| OCA2 |
rs1800414 |
15 |
28197037 |
T |
C |
—/— |
T/T |
T/T |
T/C |
0/0 |
1/0 |
2/1* |
15/7 |
Kanzawa-Kiriyama et al. (2019), Yang et al. (2016) |
| ABCC11 |
rs17822931 |
16 |
48258198 |
C |
T |
—/— |
T/T |
C/C |
C/T |
0/0 |
0/2 |
1/0 |
11/2 |
Kanzawa-Kiriyama et al. (2019), Yoshiura et al. (2006) |
| MC1R |
rs2228479 |
16 |
89985940 |
G |
A |
—/— |
—/— |
G/G |
G/A |
0/0 |
0/0 |
2/0 |
17/2 |
Kanzawa-Kiriyama et al. (2019) |
| rs885479 |
16 |
89986154 |
G |
A |
—/— |
G/G |
G/G |
G/G |
0/0 |
2/0 |
2/0 |
17/0 |
Yamaguchi et al. (2012), Motokawa et al. (2007) |
| RNF213 |
rs112735431 |
17 |
78358945 |
G |
A |
—/— |
G/G |
G/G |
G/G |
0/0 |
2/0 |
2/0 |
26/0 |
Koganebuchi et al. (under review) |
Data processing after bam (file name to store the alignment information obtained after mapping) followed Sikora et al. (2017). Processed as low coverage: IK002, F5, Sanganji. Processed as high coverage: F23.
* Sites that found two alleles in a low-coverage genome.
† Sites that were less than 10× in a high-coverage genome.
Definition of coverage in this review: <1.0× = partial genome sequence; 1.0×−4.0× = low-coverage (draft) genome sequence; 4.0×−10× = middle-coverage whole-genome sequence; >10× = high-coverage whole-genome sequence.
The need for high-coverage sequencing
Current trends in paleogenomics in East Eurasia include the reconstruction of population history using low-coverage sequences with many individuals (Table 1). However, a lack of correct genotype information (homozygotes or heterozygotes) leads to some analytical difficulties. First, the phenotype is unclear when the homozygote has a trait that differs from the heterozygote. For example, the G/G homozygote is alcohol-tolerant at rs671 in the ALDH2 gene, whereas the A/G heterozygote causes flushes and makes one feel sick after drinking alcohol (Harada et al., 1981; Oota et al., 2004). We found no derived allele in the three Jomon individuals (Table 2), which was consistent with our prediction based on a survey of Okinawa and Sakishima islanders (Koganebuchi et al., 2017). We also predicted that the derived allele at rs671 must have started arriving in the Japanese archipelago from the East Eurasian continent around 3000 years ago, but found it difficult to find individual(s) with the derived allele in recently published ancient genome data from continental specimens because of their very low coverage. Second, if homozygous/heterozygous status is unclear in regions including SNPs on the genome, it is difficult to conduct phasing and define haplotypes. Hence, all population genomic analyses based on haplotype frequency and/or linkage between SNPs (e.g. fineSTRUCTURE) are prone to error and/or not available when the homozygous/heterozygous status is unknown because of low-coverage sequencing (Parks and Lambert, 2015).
SNP capture sequencing with sufficient depth to determine homozygous/heterozygous status would be useful, but raises some issues: every genotyping array has ascertainment biases. It has been reported that standard f4 statistics in population genomics sometimes shows opposite results in SNP array and sequencing data for the same multiple populations (Bergström et al., 2020). Similar problems might occur with SNP capture sequencing because of ascertainment biases. In addition, in principle, SNP array and capture sequencing ignore rare variants; information on these rare variants is very useful for clarifying local population differentiation. Therefore, high-coverage sequencing is required for phenotypic prediction and local population history studies that make full use of genomic information.
Jomon genomes and Denisovan introgression into East Eurasia
All the Jomon genomes from Sanganji (131464), Ikawazu (IK002), and Funadomari (F5 and F23) reported thus far intriguingly show that the Jomon lineage diverged before the diversification of present-day East Eurasian populations; this was initially indicated in the Sanganji Jomon (Kanzawa-Kiriyama et al., 2017). The Ikawazu Jomon (IK002) was closely related to an 8000-year-old hunter-gatherer in Laos (McColl et al., 2018). The Funadomari Jomon (F23) was likely to have diverged from East Eurasians before the divergence of present-day Native Americans, and after that of the 40000-year-old Tianyuan (Kanzawa-Kiriyama et al., 2019). Detailed analyses of the IK002 genome showed that the Ikawazu Jomon lineage diverged before 26 kya from basal East Eurasians involving the ancestorial population of presentday East Asians, Northeast Asians (East Siberians), and Native Americans, without gene flow from Mal’ta (MA-1) (Gakuhari et al., 2020), which the ancestors of Northeast Asians and Native Americans received (Raghavan et al., 2014). Thus, the Jomon would be one of the oldest lineages in East Eurasia, and this is highly important for understanding human genome diversity in East Eurasian populations.
Another important issue in East Eurasian population history is Denisovan introgression. Initially, Denisovan introgression into Papua New Guinean people was described (Reich et al., 2010), but no such introgression was present in continental Southeast/East Asia (Reich et al., 2011). However, Denisovan alleles were found in Southeast/East Asians afterwards (Qin and Stoneking, 2015; Skoglund and Jakobsson, 2011). Both Neanderthal and Denisovan genomes were found in Melanesian individuals at various ratios (Vernot et al., 2016), and the Denisovan genome was found in Philippine Negritos (Jinam et al., 2017). More recently, multiple Denisovan lineages were detected in Oceania, Southeast/East Asia, and Siberia (Browning et al., 2018; Jacobs et al., 2019). Thus, the genomes of archaic hominins, especially those of Denisovans, are very important for understanding the population history in East Eurasia. Also from this perspective, as linkage disequilibrium in rare variants is often used to detect introgression from archaic hominins (e.g. Plagnol and Wall, 2006), high-coverage deep sequencing is also required.
Therefore, we conclude that the number of Jomon genomes needs to be increased with high-coverage as opposed to low-coverage or SNP capture sequencing. The Jomon genomes of Sanganji (131464), Ikawazu (IK002), and Funadomari (F5 and F23) make a cluster in a PCA plot (Kanzawa-Kiriyama et al., 2019); however, only F23 has sufficiently high coverage. Because the Jomon period lasted for more than 10000 years, from 16000 to 3000 years ago, whether people of all ages and regions were homogeneous should be investigated further; this would not only help reveal the history of human populations in the Japanese archipelago, but also clarify the human population history in East Eurasia.
Acknowledgments
We thank Dr. Takashi Gakuhari, Dr. Shigeki Nakagome, Dr. Daisuke Waku, Dr. Yusuke Watanabe, and Dr. Jun Ohashi for the many discussions on our research. This work was supported by JSPS KAKENHI grant no. 19H05350 to H.O.
References
- Adachi N., Shinoda K., Umetsu K., and Matsumura H. (2009) Mitochondrial DNA analysis of Jomon skeletons from the Funadomari site, Hokkaido, and its implication for the origins of Native American. American Journal of Physical Anthropology, 138: 255–265 DOI: 10.1002/ajpa.20923
- Adachi N., Sawada J., Yoneda M., Kobayashi K., and Itoh S. (2013) Mitochondrial DNA analysis of the human skeleton of the initial Jomon phase excavated at the Yugura cave site, Nagano, Japan. Anthropological Science, 121: 137–143 DOI: 10.1537/ase.130313
- Akiyama T., Katsumura T., Nakagome S., Lee S. Il, Joh K., et al.. (2017) An ancestral haplotype of the human PERIOD2 gene associates with reduced sensitivity to light-induced melatonin suppression. PLoS ONE, 12: e0178373 1–19. DOI: 10.1371/journal.pone.0178373
- Allentoft M.E., Sikora M., Sjögren K.G., Rasmussen S., Rasmussen M., et al.. (2015) Population genomics of Bronze Age Eurasia. Nature, 522: 167–172 DOI: 10.1038/nature14507
- Beall C.M., Cavalleri G.L., Deng L., Elston R.C., Gao Y., et al.. (2010) Natural selection on EPAS1 (HIF2α) associated with low hemoglobin concentration in Tibetan highlanders. Proceedings of the National Academy of Sciences of the United States of America, 107: 11459–11464 DOI: 10.1073/pnas.1002443107
- Bergström A., McCarthy S.A., Hui R., Almarri M.A., Ayub Q., et al.. (2020) Insights into human genetic variation and population history from 929 diverse genomes. Science, 367: eaay5012. 10.1126/science.aay5012
- Browning S.R., Browning B.L., Zhou Y., Tucci S., and Akey J.M. (2018) Analysis of human sequence data reveals two pulses of archaic Denisovan admixture. Cell, 173: 53–61 DOI: 10.1016/j.cell.2018.02.031
- de Barros Damgaard P., Marchi N., Rasmussen S., Peyrot M., Renaud G., et al.. (2018) 137 ancient human genomes from across the Eurasian steppes. Nature, 557: 369–374 DOI: 10.1038/s41586-018-0094-2
- Enard D. and Petrov D.A. (2018) Evidence that RNA viruses drove adaptive introgression between Neanderthals and modern humans. Cell, 175: 360–371 DOI: 10.1016/j.cell.2018.08.034
- Fu Q., Meyer M., Gao X., Stenzel U., Burbano H.A., et al.. (2013) DNA analysis of an early modern human from Tianyuan Cave, China. Proceedings of the National Academy of Sciences of the United States of America, 110: 2223–2227 DOI: 10.1073/pnas.1221359110
- Fu Q., Li H., Moorjani P., Jay F., Slepchenko S.M., et al.. (2014) Genome sequence of a 45,000-year-old modern human from western Siberia. Nature, 514: 445–449.DOI: 10.1038/nature13810
- Fu Q., Posth C., Hajdinjak M., Petr M., Mallick S., et al.. (2016) The genetic history of Ice Age Europe. Nature, 534: 200–205 https://doi.org/10.1038/nature17993
- Gakuhari T., Nakagome S., Rasmussen S., Allentoft M.E., Sato T., et al.. (2020). Ancient Jomon genome sequence analysis sheds light on migration patterns of early East Asian. Communications Biology, 3: 437DOI: 10.1038/s42003-020-01162-2
- Gamba C., Jones E.R., Teasdale M.D., McLaughlin R.L., Gonzalez-Fortes G., et al.. (2014). Genome flux and stasis in a five millennium transect of European prehistory. Nature Communications, 5: 5257DOI: 10.1038/ncomms6257
- González-Fortes G., Jones E.R., Lightfoot E., Bonsall C., Lazar C., et al.. (2017) Paleogenomic evidence for multi-generational mixing between Neolithic farmers and Mesolithic hunter-gatherers in the lower Danube Basin. Current Biology, 27: 1801–1810 DOI: 10.1016/j.cub.2017.05.023
- Green R.E., Krause J., Ptak S.E., Briggs A.W., Ronan M.T., et al.. (2006) Analysis of one million base pairs of Neanderthal DNA. Nature, 444: 330–336 DOI: 10.1038/nature05336
- Green R.E., Krause J., Briggs A.W., Maricic T., Stenzel U., Kircher M., et al.. (2010) A draft sequence of the Neandertal genome. Science, 328: 710–722 DOI: 10.1126/science.1188021
- Greenbaum G., Getz W.M., Rosenberg N.A., Feldman M.W., Hovers E., et al.. (2019) Disease transmission and introgression can explain the long-lasting contact zone of modern humans and Neanderthals. Nature Communications, 10: 5003DOI: 10.1038/s41467-019-12862-7
- Haak W., Lazaridis I., Patterson N., Rohland N., Mallick S., et al.. (2015) Massive migration from the steppe was a source for Indo-European languages in Europe. Nature, 522: 207–211 DOI: 10.1038/nature14317
- Hanaoka M., Droma Y., Basnyat B., Ito M., Kobayashi N., et al.. (2012) Genetic variants in EPAS1 contribute to adaptation to high-altitude hypoxia in Sherpas. PLoS ONE, 7: e50566 DOI: 10.1371/journal.pone.0050566
- Hansen H.B., Damgaard P.B., Margaryan A., Stenderup J., Lynnerup N., et al.. (2017) Comparing ancient DNA preservation in petrous bone and tooth cementum. PLoS ONE, 12: e0170940DOI: 10.1371/journal.pone.0170940
- Harada S., Agarwal D.P., and Goedde H.W. (1981) Aldehyde dehydrogenase deficiency as cause of facial flushing reaction to alcohol in Japanese. The Lancet, 318(8253): 982DOI: 10.1016/S0140-6736(81)91172-7
- Higuchi R., Bowman B., Freiberger M., Ryder O.A., and Wilson A.C. (1984) DNA sequences from the quagga, an extinct member of the horse family. Nature, 312: 282–284 DOI: 10.1038/312282a0
- Hofmanová Z., Kreutzer S., Hellenthal G., Sell C., Diekmann Y., et al.. (2016) Early farmers from across Europe directly descended from Neolithic Aegeans. Proceedings of the National Academy of Sciences of the United States of America, 113: 6886–6891 DOI: 10.1073/pnas.1523951113
- Horai S., Kondo R., Murayama K., Hayashi S., Koike H., et al.. (1991) Phylogenetic affiliation of ancient and contemporary humans inferred from mitochondrial DNA. Philosophical Transactions of the Royal Society of London. Series B, Biological Sciences, 333: 409–416 DOI: 10.1098/rstb.1991.0091
- International Consortium Human Genome Sequencing (2004) Finishing the euchromatic sequence of the human genome. Nature, 431: 931–945 DOI: 10.1038/nature03001
- Jacobs G.S., Hudjashov G., Saag L., Kusuma P., Darusallam C.C., et al.. (2019) Multiple deeply divergent Denisovan ancestries in Papuans. Cell, 177: 1010–1021 DOI: 10.1016/j.cell.2019.02.035
- Jeong C., Ozga A.T., Witonsky D.B., Malmström H., Edlund H., et al.. (2016) Long-term genetic stability and a high-altitude East Asian origin for the peoples of the high valleys of the Himalayan arc. Proceedings of the National Academy of Sciences of the United States of America, 113: 7485–7490 DOI: 10.1073/pnas.1520844113
- Jinam T.A., Phipps M.E., Aghakhanian F., Majumder P.P., Datar F., et al.. (2017) Discerning the origins of the Negritos, First Sundaland People: deep divergence and archaic admixture. Genome Biology and Evolution, 9: 2013–2022 DOI: 10.1093/gbe/evx118
- Kanzawa-Kiriyama H., Saso A., Suwa G., and Saitou N. (2013) Ancient mitochondrial DNA sequences of Jomon teeth samples from Sanganji, Tohoku district, Japan. Anthropological Science, 121: 89–103 DOI: 10.1537/ase.121113
- Kanzawa-Kiriyama H., Kryukov K., Jinam T.A., Hosomichi K., Saso A., et al.. (2017) A partial nuclear genome of the Jomons who lived 3000 years ago in Fukushima, Japan. Journal of Human Genetics, 62: 213–221 DOI: 10.1038/jhg.2016.110
- Kanzawa-Kiriyama H., Jinam T.A., Kawai Y., Sato T., Hosomichi K., et al.. (2019) Late Jomon male and female genome sequences from the Funadomari site in Hokkaido, Japan. Anthropological Science, 127: 83–108 DOI: 10.1537/ase.190415
- Kimura R., Yamaguchi T., Takeda M., Kondo O., Toma T., et al.. (2009) A common variation in EDAR is a genetic determinant of shovel-shaped incisors. American Journal of Human Genetics, 85: 528–535 DOI: 10.1016/j.ajhg.2009.09.006
- Kimura R., Watanabe C., Kawaguchi A., Kim Y. Il, Park S.B., et al.. (2015) Common polymorphisms in WNT10A affect tooth morphology as well as hair shape. Human Molecular Genetics, 24: 2673–2680 DOI: 10.1093/hmg/ddv014
- Koganebuchi K., Haneji K., Toma T., Joh K., Soejima H., et al.. (2017) The allele frequency of ALDH2*Glu504Lys and ADH1B*Arg47His for the Ryukyu islanders and their history of expansion among East Asians. American Journal of Human Biology, 29: e22933DOI: 10.1002/ajhb.22933
- Krings M., Stone A., Schmitz R.W., Krainitzki H., Stoneking M., et al.. (1997) Neandertal DNA sequences and the origin of modern humans. Cell, 90: 19–30 DOI: 10.1016/S0092-8674(00)80310-4
- Kurosaki K., Matsushita T., and Ueda S. (1993) Individual DNA identification from ancient human remains. American Journal of Human Genetics, 53: 638–643.
- Laval G., Peyrégne S., Zidane N., Harmant C., Renaud F., et al.. (2019) Recent adaptive acquisition by African rainforest hunter-gatherers of the Late Pleistocene sickle-cell mutation suggests past differences in malaria exposure. American Journal of Human Genetics, 104: 553–561 DOI: 10.1016/j.ajhg.2019.02.007
- Lazaridis I., Patterson N., Mittnik A., Renaud G., Mallick S., et al.. (2014) Ancient human genomes suggest three ancestral populations for present-day Europeans. Nature, 513: 409–413 DOI: 10.1038/nature13673
- Lazaridis I., Nadel D., Rollefson G., Merrett D.C., Rohland N., et al.. (2016) Genomic insights into the origin of farming in the ancient Near East. Nature, 536: 419–424 DOI: 10.1038/nature19310
- Lipson M., Szécsényi-Nagy A., Mallick S., Pósa A., Stégmár B., et al.. (2017) Parallel palaeogenomic transects reveal complex genetic history of early European farmers. Nature, 551: 368–372 DOI: 10.1038/nature24476
- Lipson M., Cheronet O., Mallick S., Rohland N., Oxenham M., et al.. (2018) Ancient genomes document multiple waves of migration in Southeast Asian prehistory. Science, 361: 92–95 DOI: 10.1126/science.aat3188
- Mathieson I., Lazaridis I., Rohland N., Mallick S., Patterson N., et al.. (2015) Genome-wide patterns of selection in 230 ancient Eurasians. Nature, 528: 499–503 DOI: 10.1038/nature16152
- Mathieson I., Alpaslan-Roodenberg S., Posth C., Szécsényi-Nagy A., Rohland N., et al.. (2018) The genomic history of southeastern Europe. Nature, 555: 197–203 DOI: 10.1038/nature25778
- McColl H., Racimo F., Vinner L., Demeter F., Gakuhari T., et al.. (2018) The prehistoric peopling of Southeast Asia. Science, 361: 88–92 DOI: 10.1126/science.aat3628
- Meyer M., Kircher M., Gansauge M.T., Li H., Racimo F., et al.. (2012) A high-coverage genome sequence from an archaic Denisovan individual. Science, 338: 222–226 DOI: 10.1126/science.1224344
- Mizuno F., Gojobori J., Wang L., Onishi K., Sugiyama S., et al.. (2014) Complete mitogenome analysis of indigenous populations in Mexico: its relevance for the origin of Mesoamericans. Journal of Human Genetics, 59: 359–367 DOI: 10.1038/jhg.2014.35
- Mizuno F., Kumagai M., Kurosaki K., Hayashi M., Sugiyama S., et al.. (2017) Imputation approach for deducing a complete mitogenome sequence from low-depth-coverage next-generation sequencing data: application to ancient remains from the Moon Pyramid, Mexico. Journal of Human Genetics, 62: 631–635 DOI: 10.1038/jhg.2017.14
- Moorjani P., Sankararaman S., Fu Q., Przeworski M., Patterson N., and Reich D. (2016) A genetic method for dating ancient genomes provides a direct estimate of human generation interval in the last 45,000 years. Proceedings of the National Academy of Sciences of the United States of America, 113: 5652–5657.DOI: 10.1073/pnas.1514696113
- Motokawa T., Kato T., Hashimoto Y., and Katagiri T. (2007) Effect of Val92Met and Arg163Gln variants of the MC1R gene on freckles and solar lentigines in Japanese. Pigment Cell Research, 20: 140–143 DOI: 10.1111/j.1600-0749.2007.00364.x
- Nakagome S., Chinen H., Iraha A., Hokama A., Takeyama Y., et al.. (2017) Confounding effects of microbiome on the susceptibility of TNFSF15 to Crohn’s disease in the Ryukyu Islands. Human Genetics, 136: 387–397 DOI: 10.1007/s00439-017-1764-0
- Narasimhan V.M., Patterson N., Moorjani P., Rohland N., Bernardos R., et al.. (2019) The formation of human populations in South and Central Asia. Science, 365: eaat7487 DOI: 10.1126/science.aat7487
- Ning C., Li T., Wang K., Zhang F., Li T., et al.. (2020) Ancient genomes from northern China suggest links between subsistence changes and human migration. Nature Communications, 11: 2700 https://doi.org/10.1038/s41467-020-16557-2
- Nishimura T., Katsumura T., Motoi M., Oota H., and Watanuki S. (2017) Experimental evidence reveals the UCP1 genotype changes the oxygen consumption attributed to non-shivering thermogenesis in humans. Scientific Reports, 7: 5570DOI: 10.1038/s41598-017-05766-3
- Olalde I., Schroeder H., Sandoval-Velasco M., Vinner L., Lobón I., et al.. (2015) A common genetic origin for early farmers from Mediterranean Cardial and Central European LBK cultures. Molecular Biology and Evolution, 32: 3132–3142 DOI: 10.1093/molbev/msv181
- Olalde I., Brace S., Allentoft M.E., Armit I., Kristiansen K., et al.. (2018) The Beaker phenomenon and the genomic transformation of northwest Europe. Nature, 555: 190–196 DOI: 10.1038/nature25738
- Olalde I., Mallick S., Patterson N., Rohland N., Villalba-Mouco V., et al.. (2019) The genomic history of the Iberian peninsula over the past 8000 years. Science, 363: 1230–1234 DOI: 10.1126/science.aav4040
- Oota H., Saitou N., Matsushita T., and Ueda S. (1995) A genetic study of 2,000-year-old human remains from Japan using mitochondrial DNA sequences. American Journal of Physical Anthropology, 98: 133–145.DOI: 10.1002/ajpa.1330980204
- Oota H., Saitou N., Matsushita T., and Ueda S. (1999) Molecular genetic analysis of remains of a 2,000-year-old human population in China—and its relevance for the origin of the modern Japanese population. American Journal of Human Genetics, 64: 250–258.DOI: 10.1086/302197
- Oota H., Kurosaki K., Pookajorn S., Ishida T., and Ueda S. (2001) Genetic study of the Paleolithic and Neolithic Southeast Asians. Human Biology, 73: 225–231 DOI: 10.1353/hub.2001.0023
- Oota H., Pakstis A.J., Bonne-Tamir B., Goldman D., Grigorenko E., et al.. (2004) The evolution and population genetics of the ALDH2 locus: random genetic drift, selection, and low levels of recombination. Annals of Human Genetics, 68: 93–109 DOI: 10.1046/j.1529-8817.2003.00060.x
- Pääbo S. (1985) Molecular cloning of ancient Egyptian mummy DNA. Nature, 314: 644–645 DOI: 10.1038/314644a0
- Parks M. and Lambert D. (2015) Impacts of low coverage depths and post-mortem DNA damage on variant calling: a simulation study. BMC Genomics, 16: 19DOI: 10.1186/s12864-015-1219-8
- Patterson N., Moorjani P., Luo Y., Mallick S., Rohland N., et al.. (2012) Ancient admixture in human history. Genetics, 192: 1065–1093 DOI: 10.1534/genetics.112.145037
- Pinhasi R., Fernandes D., Sirak K., Novak M., Connell S., et al.. (2015) Optimal ancient DNA yields from the inner ear part of the human petrous bone. PLoS ONE, 10: e0129102DOI: 10.1371/journal.pone.0129102
- Plagnol V. and Wall J.D. (2006) Possible ancestral structure in human populations. PLoS Genetics, 2: e105DOI: 10.1371/journal.pgen.0020105
- Prüfer K., Racimo F., Patterson N., Jay F., Sankararaman S., et al.. (2014) The complete genome sequence of a Neanderthal from the Altai Mountains. Nature, 505: 43–49 DOI: 10.1038/nature12886
- Prüfer K., Filippo C. de, Grote S., Mafessoni F., Korlević P., et al.. (2017) A high-coverage Neandertal genome from Vindija Cave in Croatia. Science, 358: 655–658 DOI: 10.1126/SCIENCE.AAO1887
- Qin P. and Stoneking M. (2015) Denisovan ancestry in East Eurasian and Native American populations. Molecular Biology and Evolution, 32: 2665–2674 DOI: 10.1093/molbev/msv141
- Racimo F., Marnetto D., and Huerta-Sánchez E. (2017) Signatures of archaic adaptive introgression in present-day human populations. Molecular Biology and Evolution, 34: 296–317 DOI: 10.1093/molbev/msw216
- Raghavan M., DeGiorgio M., Albrechtsen A., Moltke I., Skoglund P., et al.. (2014) The genetic prehistory of the New World Arctic. Science, 345: 1255832DOI: 10.1126/science.1255832
- Raghavan M., Steinrucken M., Harris K., Schiffels S., Rasmussen S., et al.. (2015) Genomic evidence for the Pleistocene and recent population history of Native Americans. Science, 349: aab3884. DOI: 10.1126/science.aab3884
- Rasmussen M., Li Y., LindGreen S., Pedersen J.S., Albrechtsen A., Moltke I., et al.. (2010) Ancient human genome sequence of an extinct Palaeo-Eskimo. Nature, 463: 757–762 DOI: 10.1038/nature08835
- Reich D., Green R.E., Kircher M., Krause J., Patterson N., et al.. (2010) Genetic history of an archaic hominin group from Denisova cave in Siberia. Nature, 468: 1053–1060 DOI: 10.1038/nature09710
- Reich D., Patterson N., Kircher M., Delfin F., Nandineni M.R., et al.. (2011) Denisova admixture and the first modern human dispersals into Southeast Asia and Oceania. American Journal of Human Genetics, 89: 516–528 DOI: 10.1016/j.ajhg.2011.09.005
- Reich D., Patterson N., Campbell D., Tandon A., Mazieres S., et al.. (2012) Reconstructing Native American population history. Nature, 488: 370–374 DOI: 10.1038/nature11258
- Sankararaman S., Patterson N., Li H., Pääbo S., and Reich D. (2012) The date of interbreeding between Neandertals and modern Humans. PLoS Genetics, 8: e1002947DOI: 10.1371/journal.pgen.1002947
- Sankararaman S., Mallick S., Dannemann M., Prüfer K., Kelso J., et al.. (2014) The genomic landscape of Neanderthal ancestry in present-day humans. Nature, 507: 354–357 DOI: 10.1038/nature12961
- Sankararaman S., Mallick S., Patterson N., and Reich D. (2016) The combined landscape of Denisovan and Neanderthal ancestry in present-day humans. Current Biology, 26: 1241–1247 DOI: 10.1016/j.cub.2016.03.037
- Sato T., Amano T., Ono H., Ishida H., Kodera H., et al.. (2007) Origins and genetic features of the Okhotsk people, revealed by ancient mitochondrial DNA analysis. Journal of Human Genetics, 52: 618–627 DOI: 10.1007/s10038-007-0164-z
- Sato T., Kazuta H., Amano T., Ono H., Ishida H., et al.. (2010) Polymorphisms and allele frequencies of the ABO blood group gene among the Jomon, Epi-Jomon and Okhotsk people in Hokkaido, northern Japan, revealed by ancient DNA analysis. Journal of Human Genetics, 55: 691–696 DOI: 10.1038/jhg.2010.90
- Seguin-Orlando A., Korneliussen T.S., Sikora M., Malaspinas A.S., Manica A., et al.. (2014) Genomic structure in Europeans dating back at least 36,200 years. Science, 346: 1113–1118.DOI: 10.1126/science.aaa0114
- Shinoda K.I. and Kanai S. (1999) Intracemetery genetic analysis at the Nakazuma Jomon site in Japan by mitochondrial DNA sequencing. Anthropological Science, 107: 129–140 DOI: 10.1537/ase.107.129
- Sikora M., Seguin-Orlando A., Sousa V.C., Albrechtsen A., Korneliussen T., et al.. (2017) Ancient genomes show social and reproductive behavior of early Upper Paleolithic foragers. Science, 358: 659–662 DOI: 10.1126/science.aao1807
- Sikora M., Pitulko V.V., Sousa V.C., Allentoft M.E., Vinner L., et al.. (2019) The population history of northeastern Siberia since the Pleistocene. Nature, 570: 182–188 DOI: 10.1038/s41586-019-1279-z
- Siska V., Jones E.R., Jeon S., Bhak Y., Kim H.M., et al.. (2017) Genome-wide data from two early Neolithic East Asian individuals dating to 7700 years ago. Science Advances, 3: e1601877DOI: 10.1126/sciadv.1601877
- Skoglund P. and Jakobsson M. (2011) Archaic human ancestry in East Asia. Proceedings of the National Academy of Sciences of the United States of America, 108: 18301–18306 DOI: 10.1073/pnas.1108181108
- Slon V., Mafessoni F., Vernot B., de Filippo C., Grote S., et al.. (2018) The genome of the offspring of a Neanderthal mother and a Denisovan father. Nature, 561: 113–116 DOI: 10.1038/s41586-018-0455-x
- Vernot B. and Akey J.M. (2014). Resurrecting surviving Neandertal lineages from modern human genomes. Science, 343: 1017–1021 DOI: 10.1126/science.1245938
- Vernot B., Tucci S., Kelso J., Schraiber J.G., Wolf A.B., et al.. (2016) Excavating Neandertal and Denisovan DNA from the genomes of Melanesian individuals. Science, 352: 235–239 DOI: 10.1126/science.aad9416
- Villalba-Mouco V., van de Loosdrecht M.S., Posth C., Mora R., Martínez-Moreno J., et al.. (2019) Survival of Late Pleistocene hunter-gatherer ancestry in the Iberian peninsula. Current Biology, 29: 1169–1177 DOI: 10.1016/j.cub.2019.02.006
- Villanea F.A. and Schraiber J.G. (2019) Multiple episodes of inter-breeding between Neanderthal and modern humans. Nature Ecology and Evolution, 3: 39–44 DOI: 10.1038/s41559-018-0735-8
- Wang C., Zöllner S., and Rosenberg N.A. (2012) A quantitative comparison of the similarity between genes and geography in worldwide human populations. PLoS Genetics, 8: e1002886DOI: 10.1371/journal.pgen.1002886
- Wang L., Oota H., Saitou N., Jin F., Matsushita T., et al.. (2000) Genetic structure of a 2,500-year-old human population in China and its spatiotemporal changes. Molecular Biology and Evolution, 17: 1396–1400.DOI: 10.1093/oxfordjournals.molbev.a026422
- Yamaguchi K., Watanabe C., Kawaguchi A., Sato T., Naka I., et al.. (2012) Association of melanocortin 1 receptor gene (MC1R) polymorphisms with skin reflectance and freckles in Japanese. Journal of Human Genetics, 57: 700–708 DOI: 10.1038/jhg.2012.96
- Yang M.A., Gao X., Theunert C., Tong H., Aximu-Petri A., et al.. (2017) 40,000-year-old individual from Asia provides insight into early population structure in Eurasia. Current Biology, 27: 3202–3208.DOI: 10.1016/j.cub.2017.09.030
- Yang M.A., Fan X., Sun B., Chen C., Lang J., et al.. (2020) Ancient DNA indicates human population shifts and admixture in northern and southern China. Science, 369: 282–288 DOI: 10.1126/science.aba0909
- Yang Z., Zhong H., Chen J., Zhang X., Zhang H., et al.. (2016) A genetic mechanism for convergent skin lightening during recent human evolution. Molecular Biology and Evolution, 33: 1177–1187 DOI: 10.1093/molbev/msw003
- Yoshiura K., Kinoshita A., Ishida T., Ninokata A., Ishikawa T., et al.. (2006) A SNP in the ABCC11 gene is the determinant of human earwax type. Nature Genetics, 38: 324–330 DOI: 10.1038/ng1733
- Yu H., Spyrou M.A., Karapetian M., Shnaider S., Radzevičiūtė R., et al.. (2020) Paleolithic to Bronze Age Siberians reveal connections with First Americans and across Eurasia. Cell, 181: 1232–1245 DOI: 10.1016/j.cell.2020.04.037