Introduction
The genetic structure of the current Japanese population is the result of several layers of migration and subsequent admixture. The Jomon period lasted from approximately 16000 to 2800 years ago, and the Jomon people were the prehistoric natives of the Japanese islands during that period. The Jomon culture flourished in the Japanese archipelago for over 12000 years. Therefore, indigenous Jomon people have been the subject of substantial archaeological, anthropological, and genetic research over the past several decades (e.g. Omoto and Saitou, 1997; Habu, 2004; Matsumura, 2007).
Ancient DNA (aDNA) studies provide direct genetic evidence for people from the past. Their genetic characteristics have been identified using next-generation sequencing in several studies over the last few years (e.g. Lazaridis et al., 2014; Haak et al., 2015; Yang et al., 2020). Most of the current knowledge about the genetic relations among the populations belonging to the Jomon culture is based on studies of mitochondrial DNA (e.g. Adachi et al., 2011, 2013; Kanzawa-Kiriyama et al., 2013; Takahashi et al., 2019). Because mitochondrial DNA is maternally inherited, there are limits to using only mitochondrial DNA to clarify the genetic characteristics of the population.
During the last few years, ancient nuclear genome data has revealed new insights into the Jomon people (Kanzawa-Kiriyama et al., 2017, 2019; McColl et al., 2018). However, the Jomon period lasted approximately 12000 years in the vast north–south-trending Japanese archipelago, and the samples reported in those studies were from the final Jomon period on Honshu Island, the main island of Japan, and Hokkaido Island. Therefore, the genetic features of the Jomon people are expected not to be fully represented by only a few samples. In fact, previous studies using mitochondrial DNA suggested that there are regional differences in the Jomon people (e.g. Adachi et al., 2009, 2011, 2013; Kanzawa-Kiriyama et al., 2013; Takahashi et al., 2019). To fully clarify the genetic characteristics of the Jomon people, it is necessary to accumulate genomic data that cover a wide range of regions and time throughout the Jomon period.
We had the opportunity to carry out aDNA analysis of human skeletal remains excavated from the Higashimyo shell midden site in Saga City, Kyushu Island. This site is located in the central part of the Saga Plain, approximately 12 km inland from the coastline of Ariake Bay (Figure 1). This site was discovered in 1990, and the first serious excavation was carried out from 1993 to 1996. In 2003, the shell middens were accidentally found at the site by flood control work conducted by the Ministry of Land, Infrastructure, Transport and Tourism. The second excavation was conducted from 2004 to 2007.
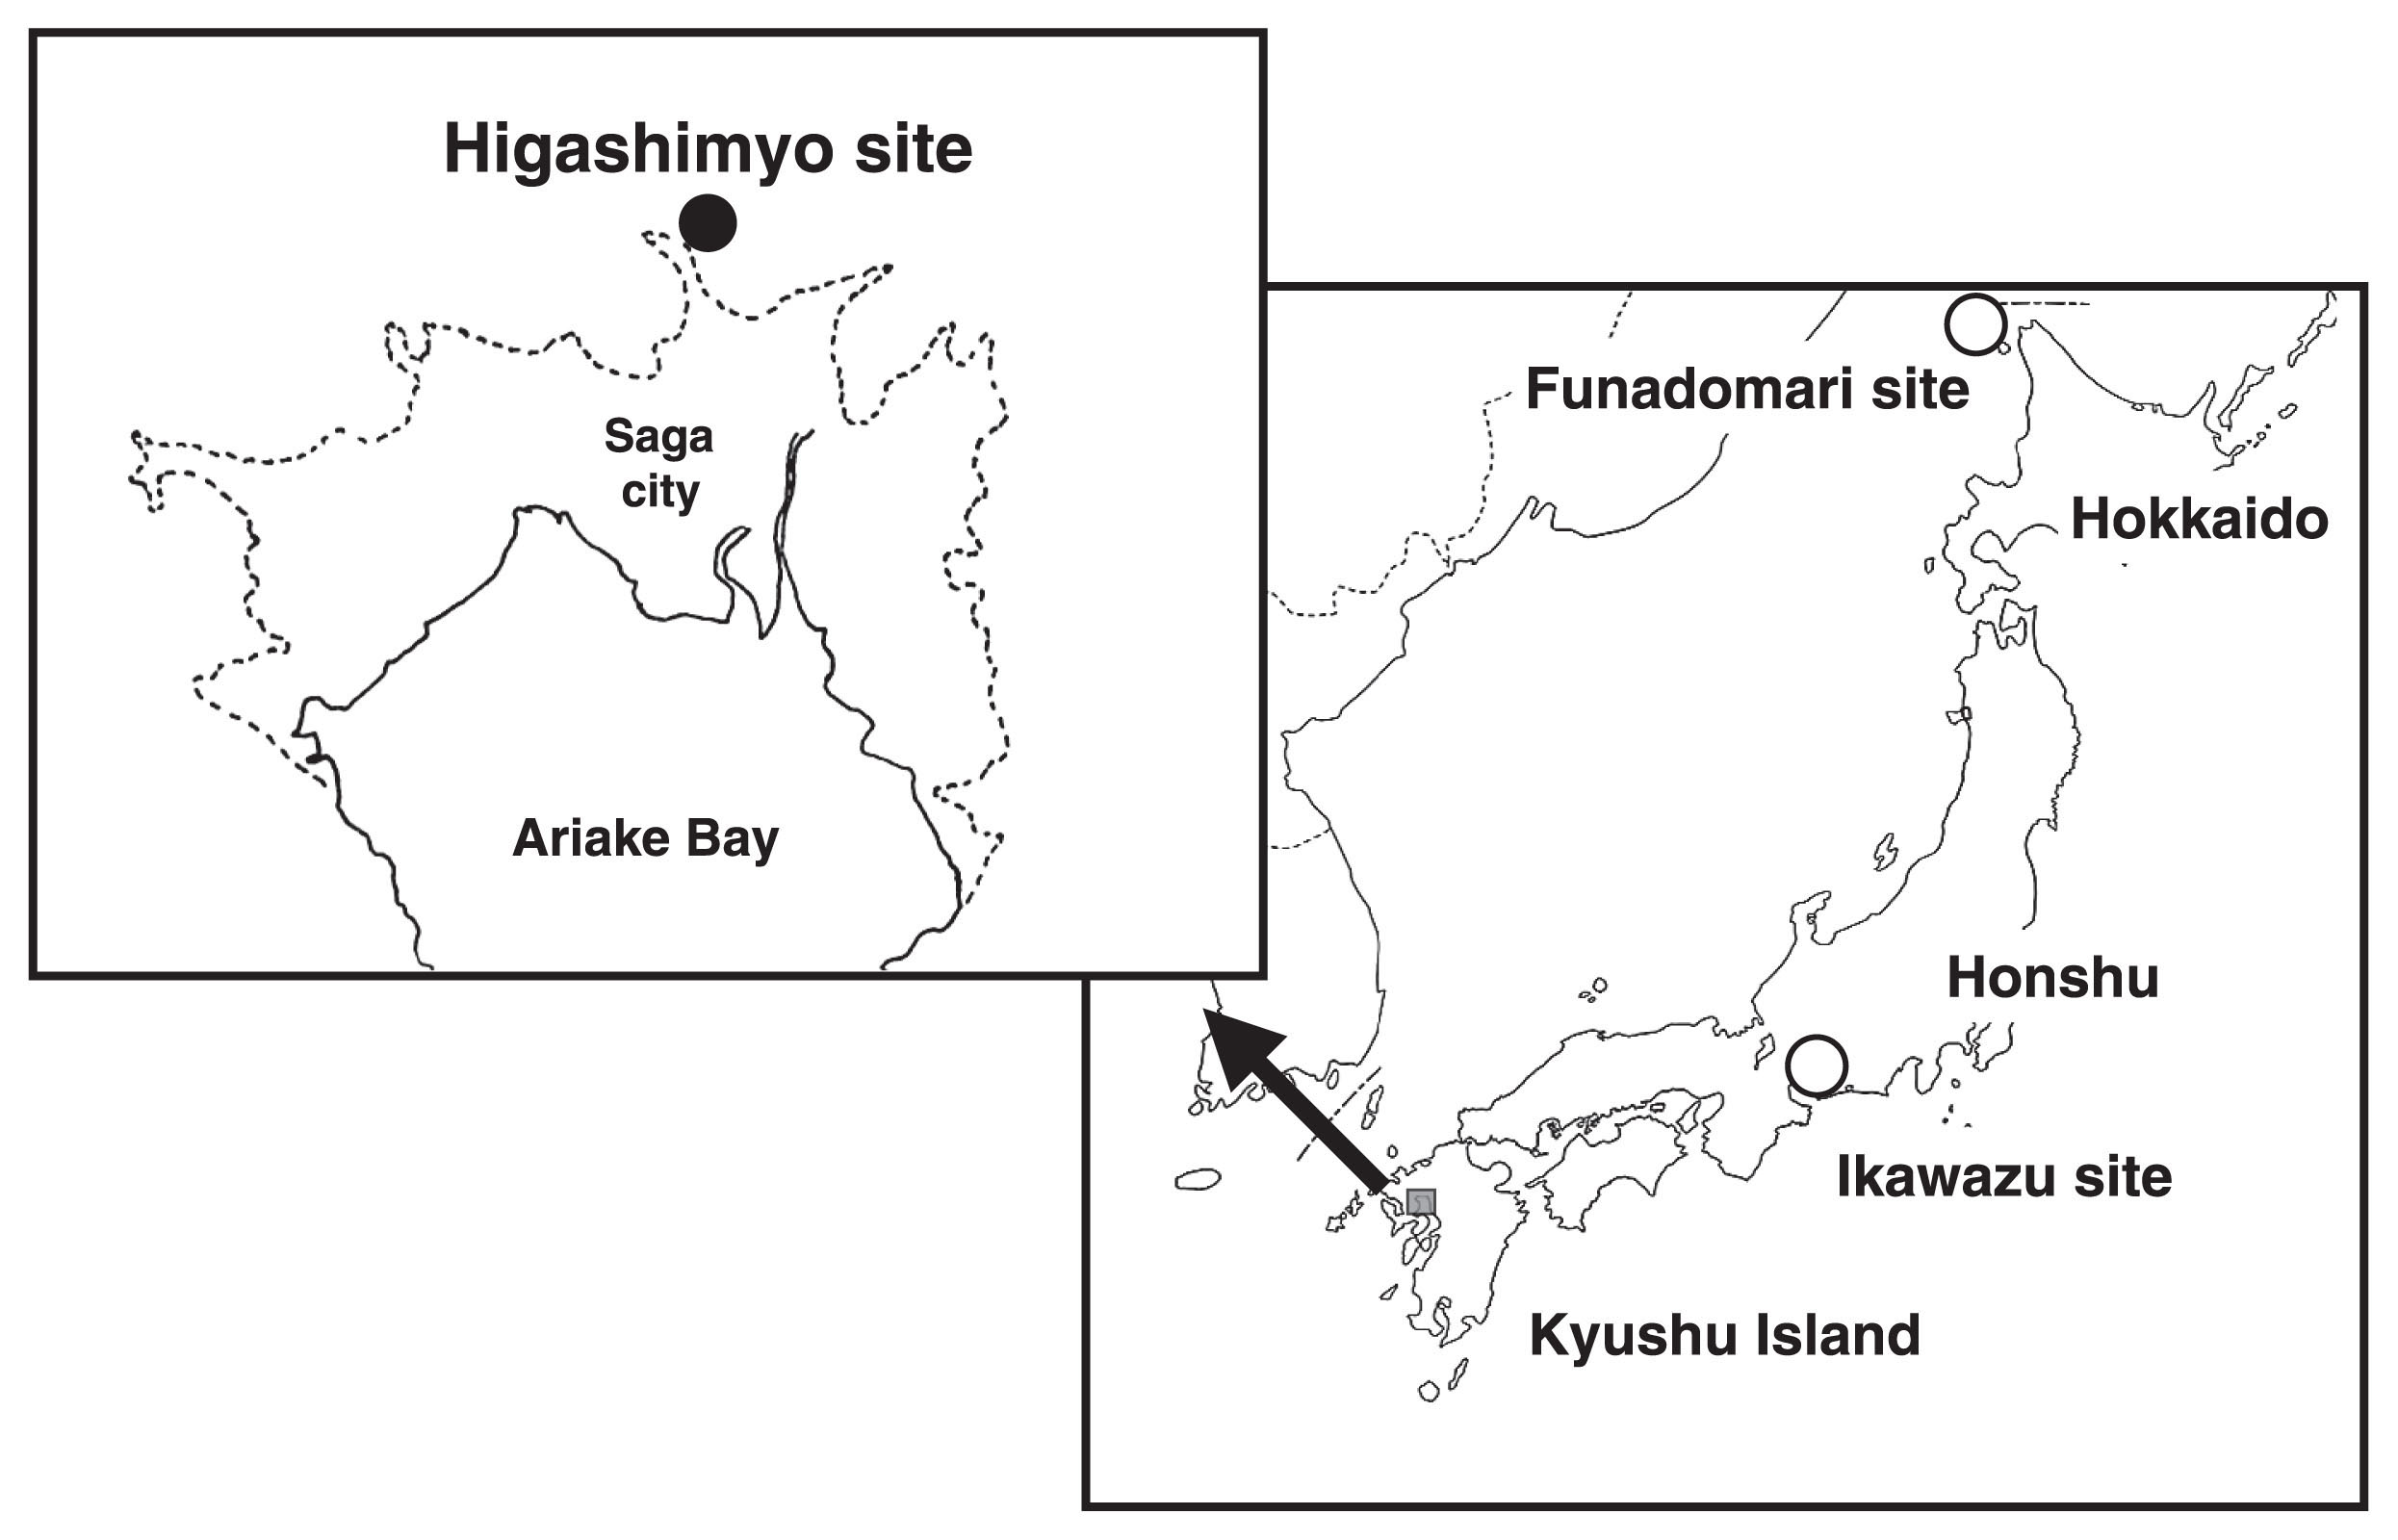
The site was covered by a sedimentary layer over 5 m thick, which preserved the organic matter there. Because the ruins were conserved without undergoing disturbance, it is possible to infer additional information about the life of the Jomon people. According to 14C dating, the ruins were formed c. 7460–7980 years ago (Saga City Board of Education, 2016); this corresponds to the initial Jomon period. This site is the oldest and largest wetland shell midden in Japan, and skeletal remains excavated there are among the oldest Jomon human remains from Kyushu Island.
In this study, we report the entire mitogenome and partial nuclear genome of the Higashimyo people. This is the first report on the genetic characteristics of the Jomon people of Kyushu Island and the first genome data from the initial Jomon period. These findings provide important data for understanding the regional differences and temporal transitions of the Jomon people.
Materials and Methods
Skeletal material
In the Higashimyo site, eight buried skeletons were unearthed from the accommodation space of the site. In addition, 69 scattered human remains were discovered from the valley, including in shell middens (Saga City Board of Education, 2016). Most of these skeletal materials were generally in a poor state of preservation.
In this study, a well-preserved isolated molar (morphologically identified as the right lower first molar), which was excavated during the second excavation in 2004 and named as skeletal sample 012, was used for genetic analyses. Because this tooth was isolated, we could not identify the individual to whom it belonged. Analysis of this tooth was officially approved by the Saga City Board of Education. Moreover, this study was approved by the Ethics Committee of the Faculty of Medicine of the University of Yamanashi.
Authentication methods
Meticulous care was taken to avoid contamination with modern DNA as previously described (Adachi et al., 2018). Briefly, DNA-based studies were performed in a laboratory dedicated to aDNA analysis. We employed standard precautions to avoid contamination, such as separation of pre- and post-polymerase chain reaction (PCR) experimental areas, use of disposable laboratory wares and filter-plugged pipette tips, treatment with DNA contamination removal solution (DNA Away; Molecular Bio Products, San Diego, CA, USA), UV irradiation of equipment and clean benches, and use of negative extraction and PCR controls.
DNA extraction and purification
The DNA sample was obtained as described in Adachi et al. (2018). Briefly, the tooth was dipped in a 13% bleach solution (Nacalai Tesque Inc., Kyoto, Japan) for 15 min, rinsed several times with DNase/RNase-free distilled water (Thermo Fisher Scientific, Waltham, MA, USA), and allowed to air-dry. Subsequently, the outer surface of the sample was removed to a depth of 1 mm using a dental drill. Next, the sample was rinsed with DNase/RNase-free distilled water, allowed to air-dry under irradiation in a UV crosslinker for 90 min, and then encased in Exafine silicone rubber (GC, Tokyo, Japan) as described by Gilbert et al. (2003). Once the rubber was hardened, the tip of the tooth root was removed with a horizontal cut and powdered using a mill (Multi-beads shocker; Yasui Kikai, Osaka, Japan). Then, the dentin around the dental cavity and the dental pulp were powdered using a dental drill.
The powdered sample was decalcified with 0.5 M EDTA (pH 8.0) (Thermo Fisher Scientific) at 56°C overnight. EDTA buffer was then refreshed, and the sample was decalcified for a further 36 h at 56°C. The decalcified sample was lysed in 1000 μl of Genomic Lysis buffer (Genetic ID, Fairfield, IA, USA) with 50 μl of 20 mg/ml proteinase K (QIAGEN, Hilden, Germany) overnight at 56°C. Finally, the lysate was extracted twice with 1200 μl of UltraPure phenol/ chloroform/isoamyl alcohol (25:24:1) (Thermo Fisher Scientific) and 1200 μl of Infinity Pure Chloroform (FUJIFILM Wako Pure Chemical Corporation, Osaka, Japan). DNA was extracted from the lysate using a FAST ID DNA Extraction Kit (Genetic ID) in accordance with the manufacturer’s instructions.
Library preparation
Three DNA libraries, Higashimyo-1 and -2 and -3, were prepared using 8 μl of DNA extract following Shinoda et al. (2017) and Meyer and Kircher (2010), respectively, for mitochondrial genome analysis (Supplementary Table 1). A multiplex PCR kit (QIAGEN) was used for the first round of PCR amplification. We used the barcode of TruSeq DNA LT Set A (Illumina, San Diego, CA, USA) for indexing. For nuclear genome analysis, we also prepared an additional DNA library (Higashimyo-4) following the protocol of ‘partial uracil–DNA–glycosylase treatment’ (Rohland et al., 2015) from the remaining DNA extract (~13 μl) with some modification; we used indexed primer and AccuPrime Pfx DNA polymerase (Thermo Fisher Scientific) for the first round of PCR amplification. The cycling conditions were as follows: 95°C for 2 min; 12 cycles of 95°C for 15 s, 60°C for 30 s, and 68°C for 30 s; and a hold at 4°C. The first PCR product was purified with a QIAquick PCR purification kit (QIAGEN) and eluted in 50 μl buffer EB supplied by the manufacturer.
A second round of PCR was set up as follows: 0.5 μl product from the first PCR, 10 μl of 10× AccuPrime Pfx reaction mix, 1000 nM of each multiplexing PCR primer, 2.5 U of AccuPrime Pfx DNA polymerase, and H2O were mixed to obtain a final reaction volume of 100 μl. We dispensed the mixture into two 200-μl PCR tubes. Cycling conditions were as follows: 95°C for 2 min; 8 cycles of 95°C for 15 s, 60°C for 30 s, and 68°C for 30 s; and a hold at 4°C. The second PCR product was purified with a QIAquick PCR purification kit and eluted in 30 μl buffer EB. The purified library was quantified with a D1000 ScreenTape system (Agilent Technologies, Santa Clara, CA, USA).
For reindexing of the three previously prepared DNA libraries, we conducted a third round of PCR amplification. The conditions were the same as the second round of PCR, but the input volume of PCR products was one to several microliters.
Mitochondrial genome capture and sequencing
Three DNA libraries, Higashimyo-1, -2 and -3, were independently enriched for mtDNA following the protocol of Maricic et al. (2010) and sequenced on the Illumina MiSeq platform (Illumina) (MiSeq Reagent Kit 150 or 300 cycles) with 75 or 150 cycles of paired-end runs at the National Museum of Nature and Science (Tsukuba City, Japan).
Raw sequence reads were processed using the protocol of Shinoda et al. (2017) with some modifications. After adapter trimming and merging of paired-end reads with AdapterRemoval version 2 (Schubert et al. 2016) (--trimns --trimqualities --minquality 25 --minlength 35 --collapse), the merged reads were mapped to a human reference genome (hg19) using the Burrows–Wheeler Aligner (version 0.7.8) aln option (Li and Durbin, 2009). For single indexed libraries, cross-contaminants among samples sequenced in the same sequencing run were removed using the process outlined by Kanzawa-Kiriyama et al. (2017) and Shinoda et al. (2017). The reads mapped to NUMT (nuclear mitochondrial DNA) or the mitochondrial genome were rescued and remapped to the human mitochondrial genome (revised Cambridge Reference Sequence) (Andrews et al., 1999) with the same mapping criteria as hg19. After retrieving correctly mapped reads (flag 0 or 16 in SAMtools file format), PCR duplicates were removed using DeDup version 0.11.3 (https://github.com/apeltzer/DeDup/releases/download/v0.11.3/DeDup.jar), and only reads with mapping quality ≥20 were retained. Total reads in each step are listed in Supplementary Table 1.
The coverage of width and average depth were calculated using the SAMtools version 1.0 (Li et al., 2009) depth option. The resulting bam file was also analyzed in the Genome Analysis Toolkit HaplotypeCaller (-stand_call_conf 30-stand_emit_conf 10) to call single-nucleotide polymorphisms (SNPs) and indels. The sites with low depth (<2) and high mismatch to consensus sequences (>30%) were masked, and the mtDNA haplogroup was then manually determined using PhyloTree-Build 17 (van Oven and Kayser, 2009). Some SNPs that were characteristic of the haplogroup, but masked because of low depth, were manually reidentified to classify each individual into sub-haplogroups. We also determined the mtDNA haplogroup using HaploGrep 2 (Weissensteiner et al., 2016) to reconfirm the haplotyping.
Capturing whole human genome, sequencing, and sequence mapping
We sequenced one of the four DNA libraries, Higashimyo-4, using the MiSeq platform to check the frequency of human DNA. Then, we judged the necessity of capturing human DNA before sequencing. Before the capture, all four DNA libraries were treated with SPRI size selection (0.7×) to remove relatively long DNA reads that include less human aDNA and a large amount of bacterial-derived DNA. The size-selected DNA libraries were treated with MYbaits Whole Genome Enrichment kit version 4 (MYcroarray, Ann Arbor, MI, USA) to enrich endogenous human-derived DNA. The enriched DNA libraries were amplified using the protocol described for the second round of PCR for the DNA library preparation with 12 cycles. The PCR products were mixed and sequenced on an Illumina HiSeq X platform using a paired-end run with 150 cycles at Macrogen Japan Co. Ltd (Kyoto, Japan).
After adapter trimming and merging of paired-end reads with AdapterRemoval version 2 (--trimns --trimqualities --adapter1 AGATCGGAAGAGCACACGTCTGAACTCC AGTCAC --adapter2 AGATCGGAAGAGCGTCGTGTAGGGAAAGAGTGTA --minquality 20 --minlength 30 --collapse), the merged reads were mapped to a human reference genome (hs37d5) using the Burrows–Wheeler Aligner (version 0.7.8) aln option instead of mem option as previous studies which handle low-coverage ancient genome data (e.g. McColl et al., 2018). Mapped reads with a mapping quality of 30 or more were retained, sorted, and merged. The number of filtered mapped reads were examined using SAMtools version 1.3.1 with the flagstat option. After removing PCR duplicates using DeDup version 0.11.3, we masked some bases in the termini of the reads as N using BamUtil version 1.0.14 to minimize the effect of C/T error. Ten and two bases of the termini were masked for DNA libraries 1–3 and DNA library 4, respectively.
DNA authenticity
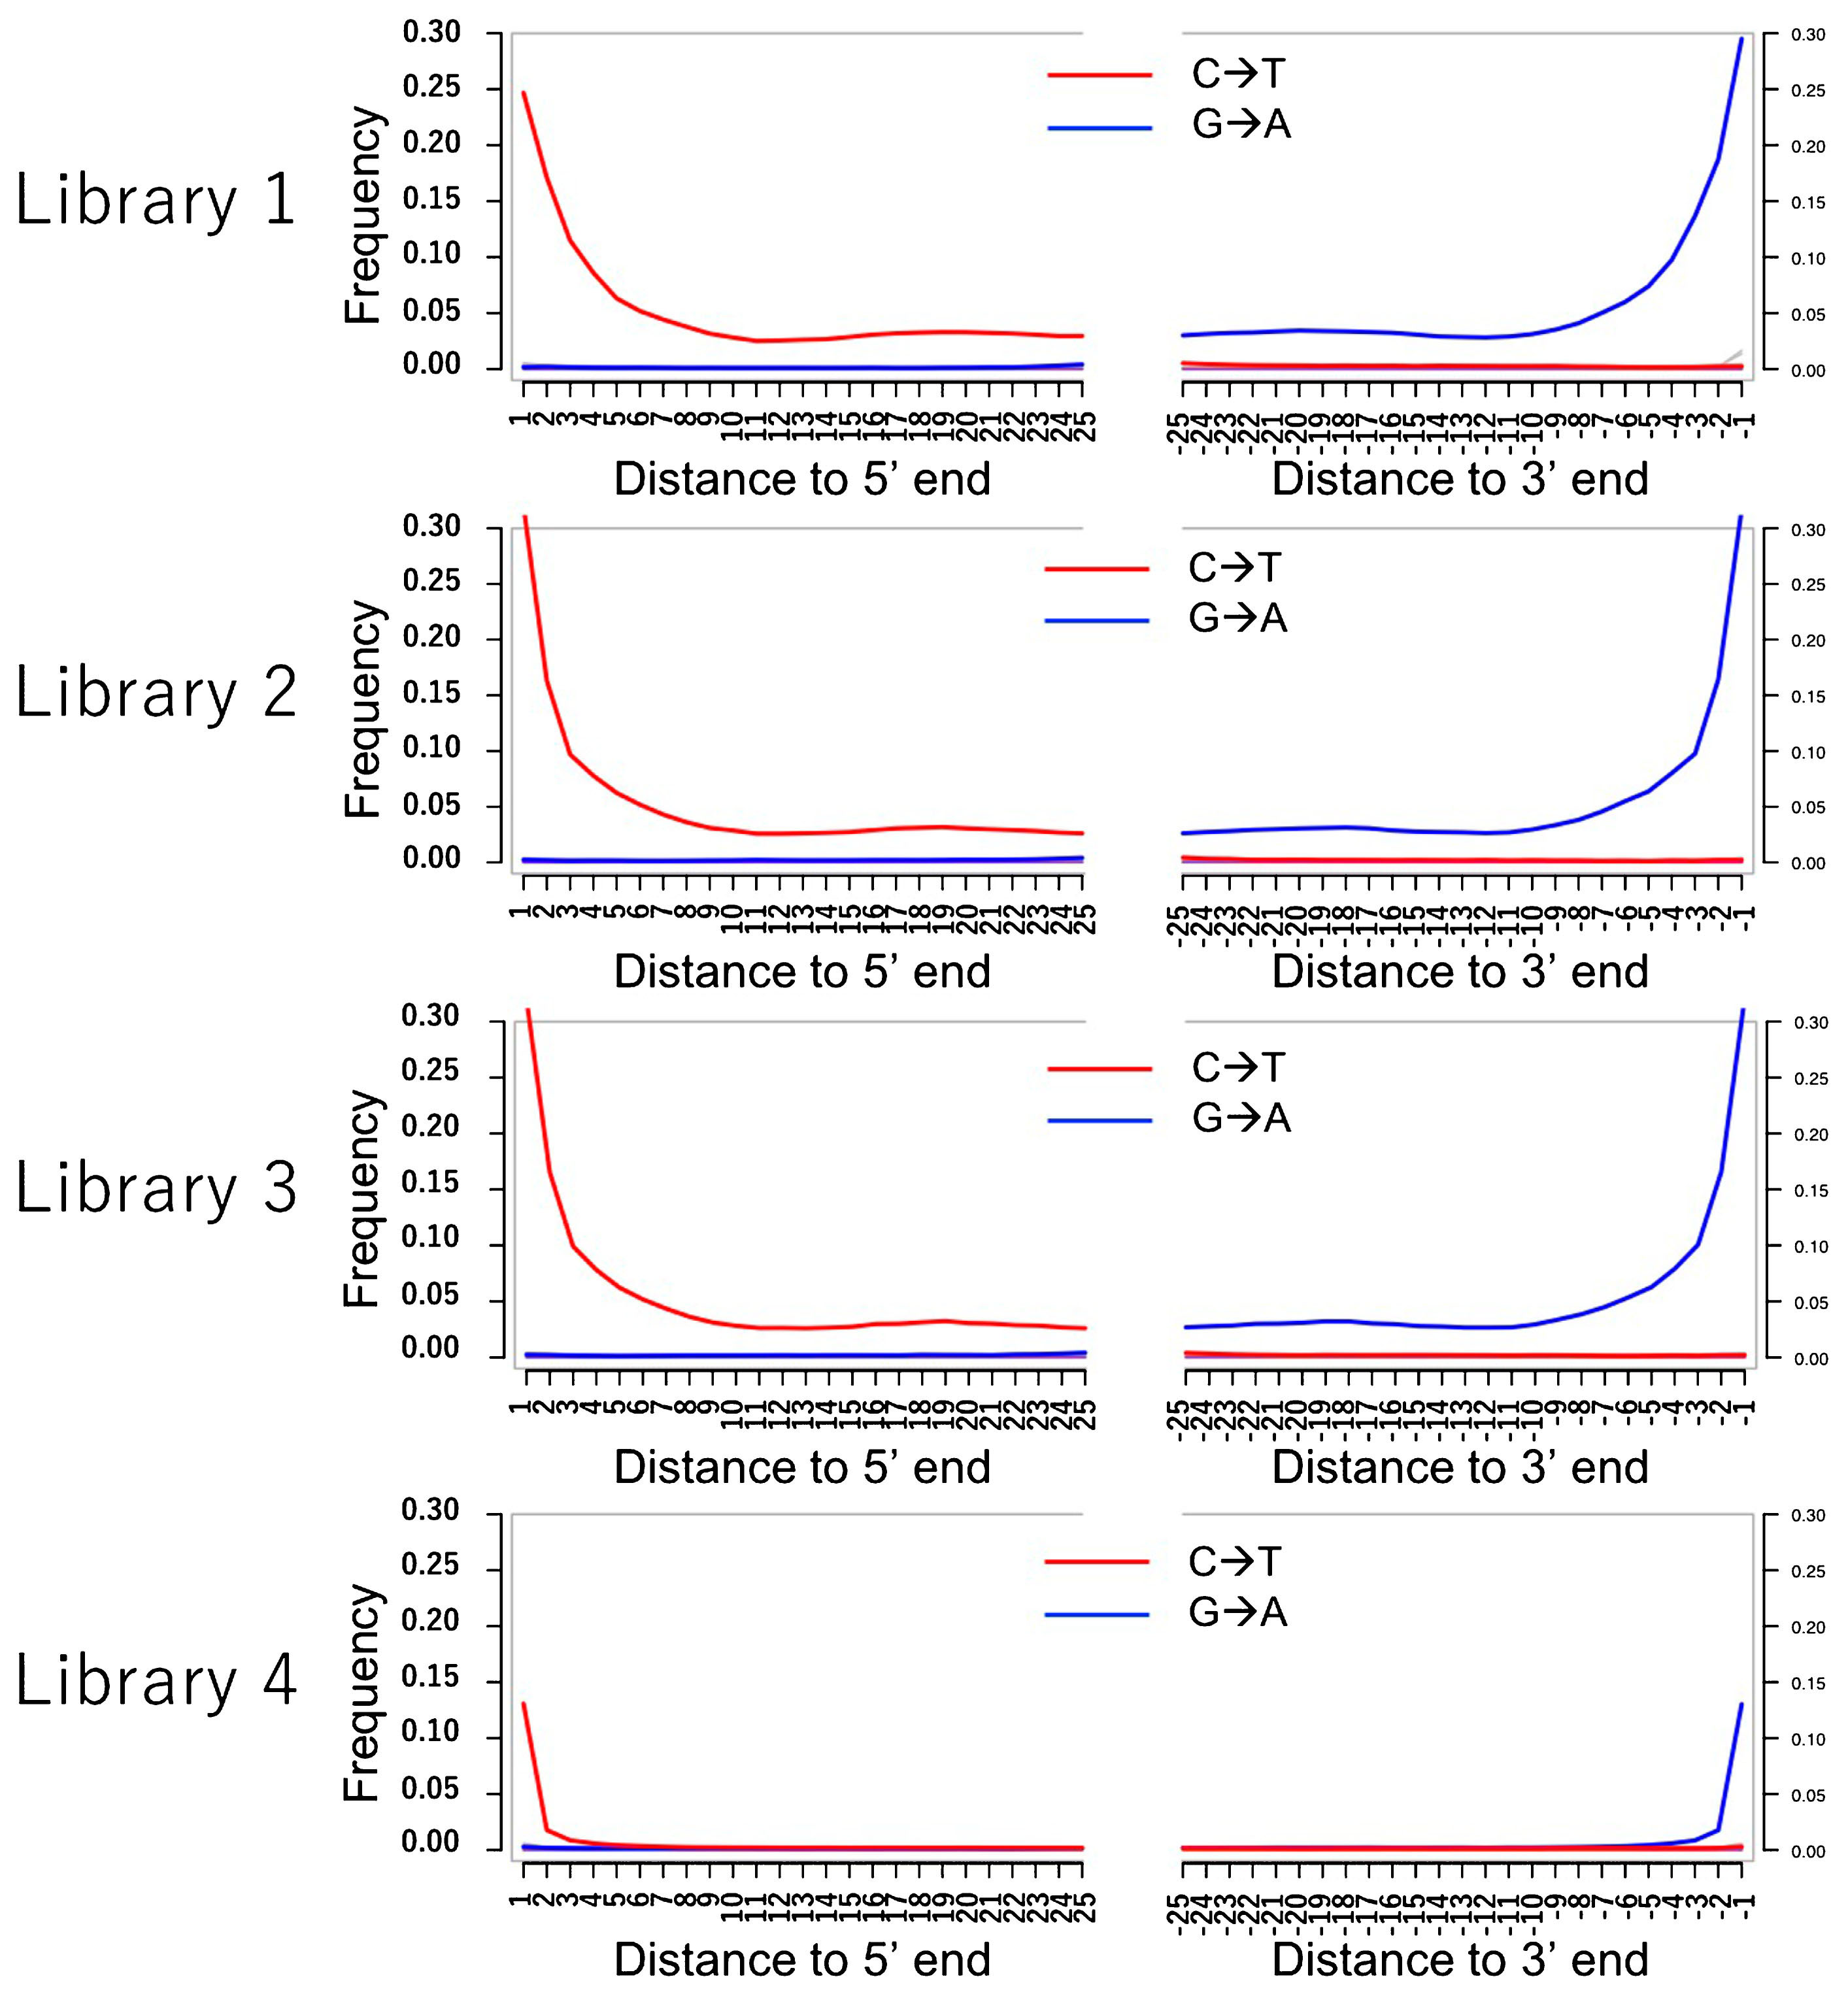
The frequency of post-mortem misincorporation from C to T in the 5′ end and G to A in the 3′ end, which are characteristic of aDNA, was investigated using mapDamage2.0 (Jonsson et al., 2013) to confirm that the filtered mapped reads were from human remains. Then, we independently investigated contamination frequency of the reads mapped to the nuclear and mitochondrial genomes on the basis of the deamination pattern using schmutzi software (Renaud et al., 2015). We used the contDeam.pl program for both datasets, and used the schmutzi.pl program (--notusepredC --uselength ~/schmutzi/alleleFreqMT/197/freqs/) for only the mitochondrial mapped data. We also manually estimated the contamination frequency using the method of Kanzawa-Kiriyama et al. (2019), but included both transition and transversion sites to maximize the number of reads for analysis. First, we prepared an mpileup file at mtDNA haplogroup-specific SNP sites for each library. Next, inconsistency among the variants was estimated for the SNP sites in which depth was higher than two and for variants with >70% consensus.
Y-chromosome haplogroup estimation
We counted the number of X- and Y-mapped sequence reads to determine sex. If the individual was male, the ratio will be close to 10:1. We investigated Y-chromosome haplogroups following the method of Shinoda et al. (2019), which was modified from the protocol of Kanzawa-Kiriyama et al. (2019). Briefly, we retrieved the human Y-chromosome nucleotide sites registered at the International Society of Genetic Genealogy website (https://isogg.org/tree/ISOGG_YDNA_SNP_Index.html) and then prepared an mpileup file of sites that overlapped with the listed nucleotide sites. Then, we listed the SNP sites with variants that determined haplogroups, and manually checked the haplogroups.
Data preparation for modern and other ancient human genomes
Four datasets from the The 1000 Genomes Project Consortium (2012), the Simons Genome Diversity Project (SGDP) (Mallick et al., 2016), and genotypes of fully public Affymetrix Human Origins present-day individuals and ancient individuals analyzed by Lazaridis et al. (2016) and Skoglund et al. (2016) (the Pacific dataset) were prepared for this study. The former and the latter two datasets, respectively, were merged to prepare whole-genome sequencing (WGS) and 600K SNP datasets, which included Funadomari No. 5 and No. 23 (F5 and F23, respectively), 3800-year-old Hokkaido Jomons (Kanzawa-Kiriyama et al., 2019); Sanganji 131464 (SanganjiB), a ~3000-year-old Fukushima Jomon (Kanzawa-Kiriyama et al., 2017); Ikawazu IK002, a 2500-year-old (which corresponds to the end of Jomon to the beginning of the Yayoi era) from Aichi, who was determined to be genetically indigenous Jomon (McColl et al., 2018); and Devil’s Gate 1 and 2, 7700-year-old Neolithic East Asians from the Amur Basin (Siska et al., 2017). To add the Higashimyo genome data, we called an allele by sampling a random read covering each SNP site with pileupCaller (https://github.com/stschiff/sequenceTools) as used by Schuenemann et al. (2017), and merged these data with the already merged datasets.
Principal-component analysis (PCA)
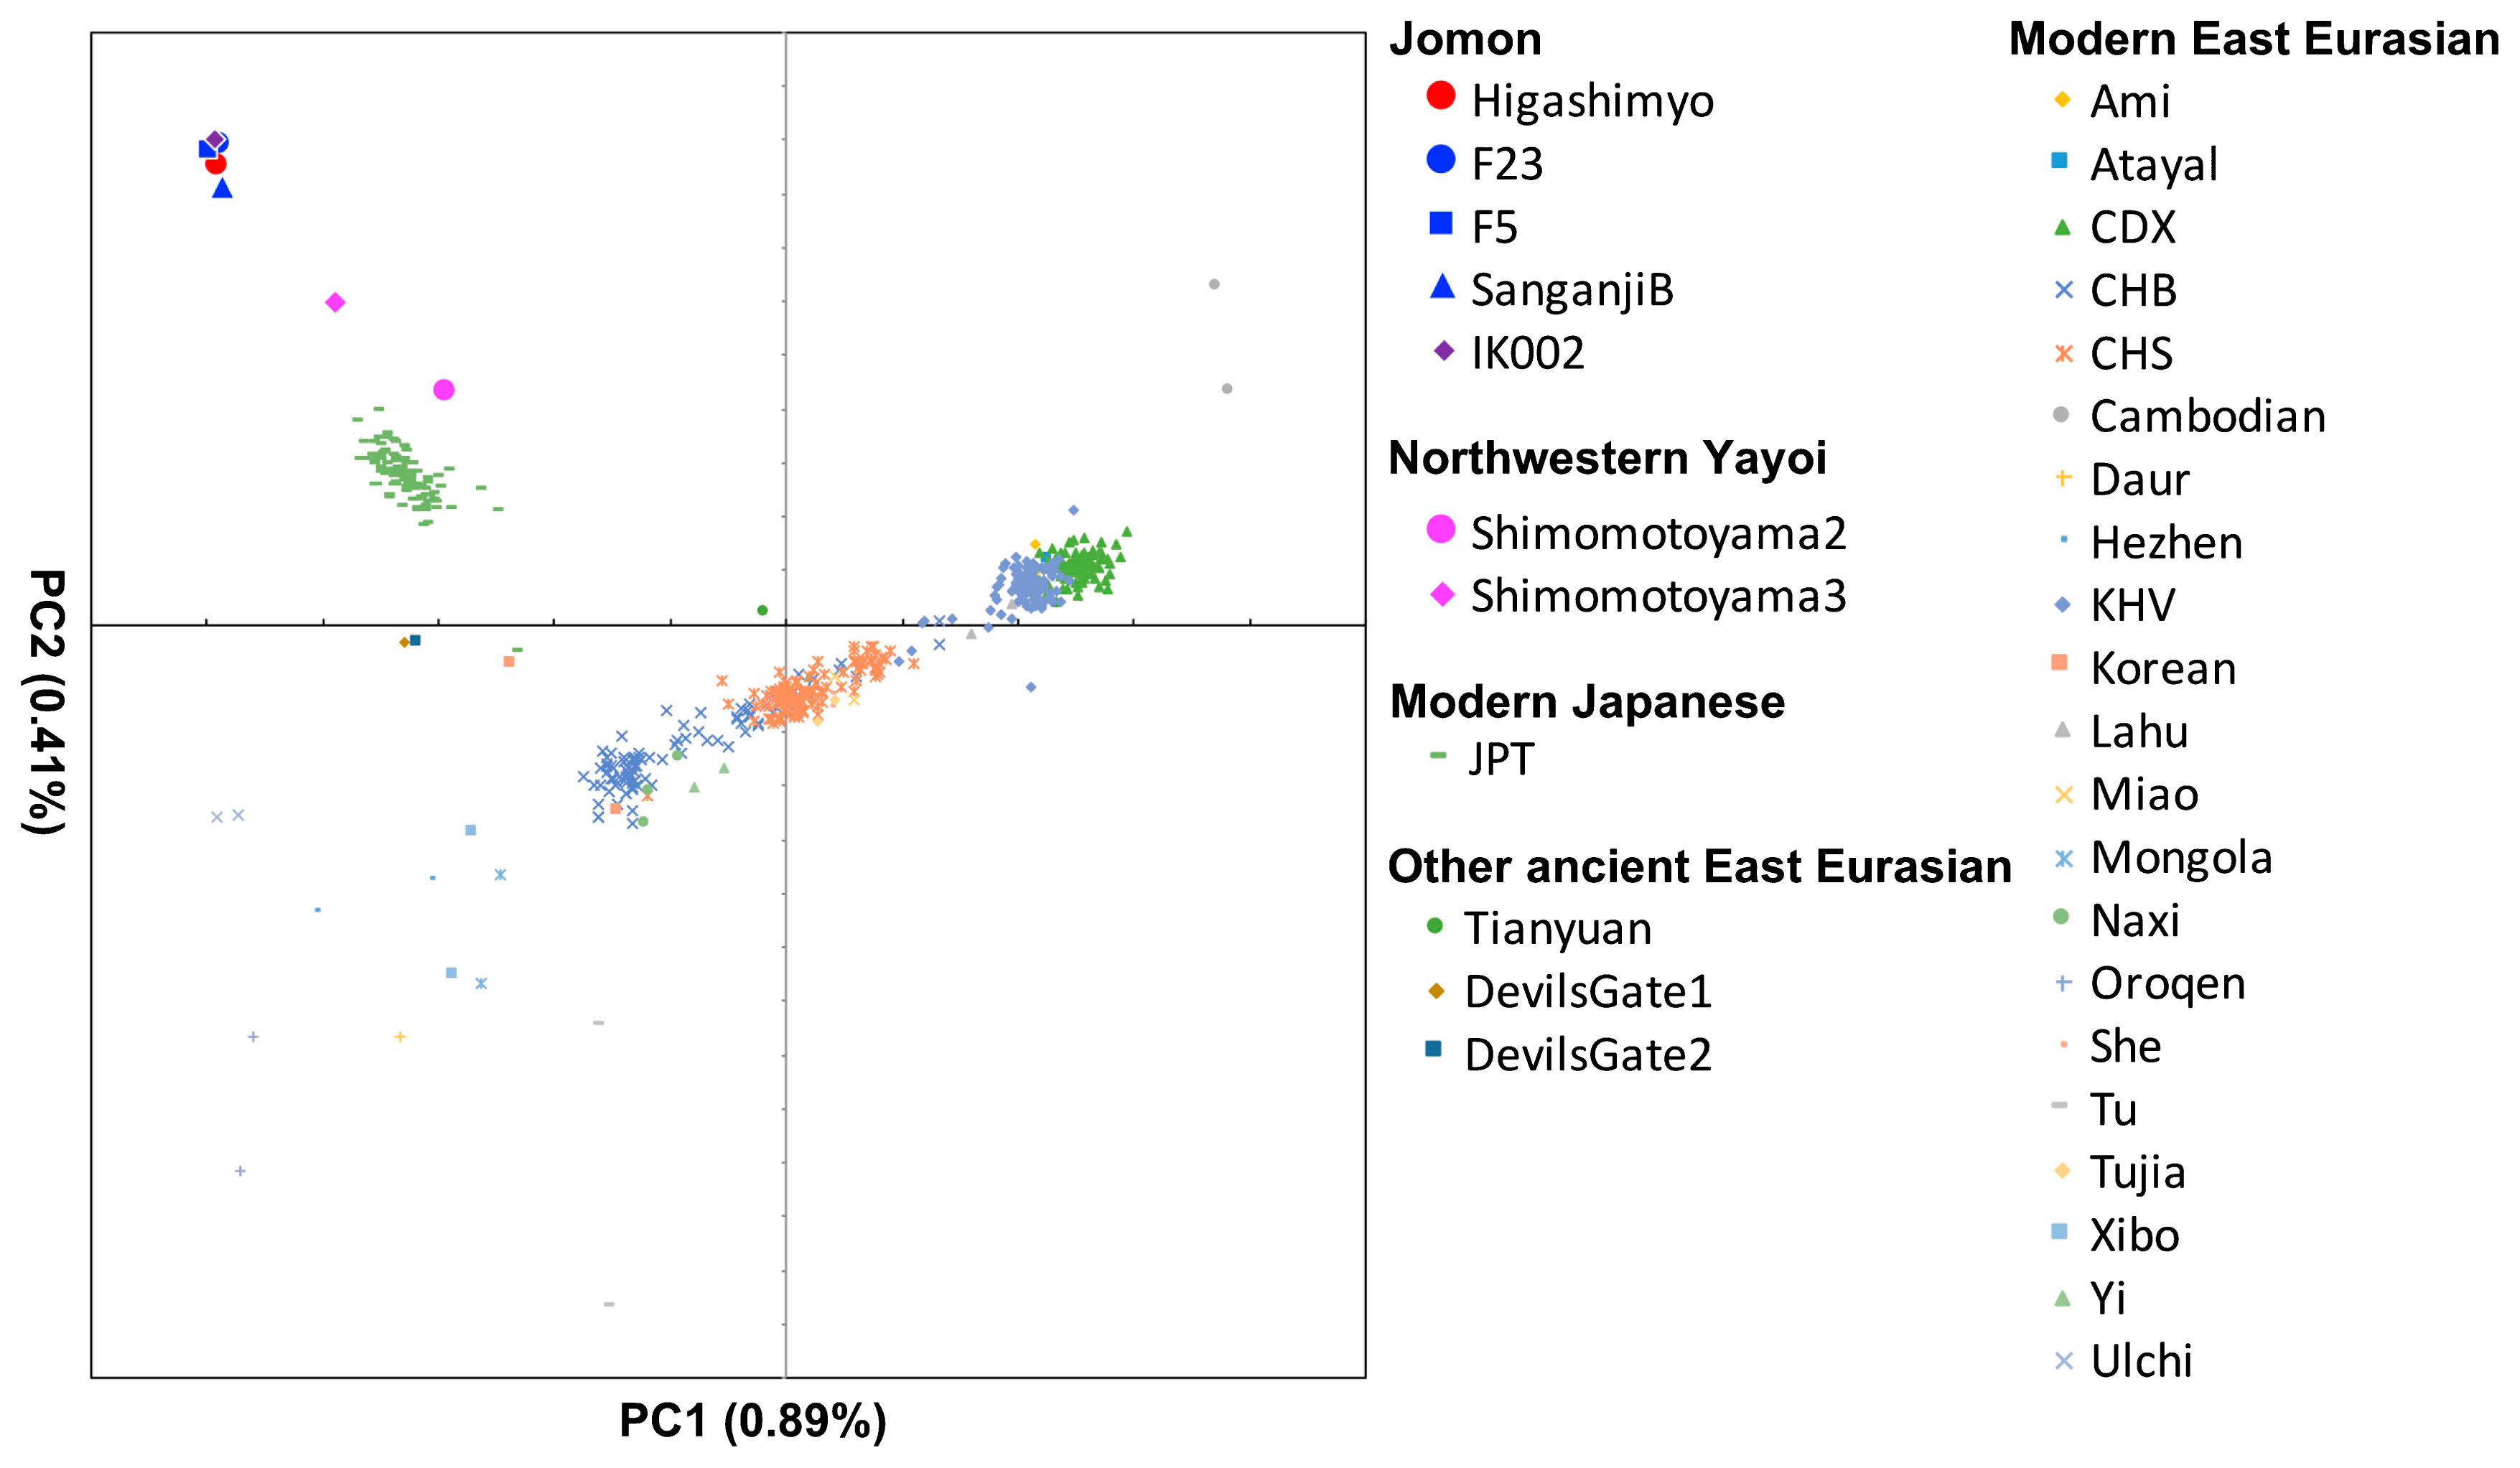
To examine the genetic relationships between individuals, we performed PCA using modern East Eurasian populations with projection of ancient individuals. We used the merged genomic dataset, and included SNPs observed in modern human populations. SNPs with minor allele frequency <0.005 or genotype call rate <0.95 were filtered out using PLINK version 1.90b4.5. We ran the smartpca program in the EIGENSOFT package (Patterson et al., 2006) with lsqproject option YES to project all ancient samples (Higashimyo, F5, F23, SanganjiB, IK002, Shimomotoyama 2 and 3, Tianyuan, and Devil’s Gate 1 and 2).
f-statistics
We performed the outgroup f3-statistic (qp3Pop), the f4-statistic (qpDstat with f4 mode: YES), and the f4 ratio test, which are part of AdmixTools version 4.1 (Patterson et al., 2012), to infer gene flow without invoking demographic models. These statistics are based on the number of shared alleles between test populations. We used |Z| > 3 for significance cut-off.
The outgroup f3-statistic, f3(Outgroup; A, X), measures the shared genetic drift between two test populations, A and X, compared with the outgroup population. Larger values indicate greater shared genetic drift between populations A and X, which suggests a closer relationship. The f4-statistic, f4(O, A; X, Y), measures allele frequency differences between two pairs of the group, (O, A) and (X, Y), and assumes that population O is an outgroup to the three other populations. If the topology (O,(A,(X, Y))) is correct, the allele frequency differences between X and Y should reflect genetic drift, which is not correlated with those between O and A. Thus, the expected value of the product of frequency differences, f4, is zero. If f4 is significantly positive, A and Y share more alleles than A and X, and if f4 is significantly negative, A and X share more alleles than A and Y. To minimize the effects of possible biases due to a small number of SNPs, only datasets with more than 50000 SNPs of genome data and 10000 SNPs of array genotyping data were used for this test. Soraggi et al. (2018) reported that high sequence error has a large impact on the D-statistic, which is statistically similar to the f4-statistic. The impact is probably because of pseudoaffinities with outgroups and other ancient samples. Orlando et al. (2013) mentioned that a less distant outgroup provides fewer opportunities of coincidence between ancient samples and outgroups. Therefore, when we detect gene flow and population structure in Jomon, we used Papuan as outgroup to minimize the effect of high sequence error in low-coverage genome data, which might cause pseudoaffinities with outgroups and other ancient samples.
To estimate the proportion of the Jomon ancestry in test populations, we used the f4 ratio test by assuming tree topology. The f4-ratio test measures the admixture proportion, α. α is calculated from the quotient of two f4-statistics, f4(A, O; X, C) and f4(A, O; B, C), generated from the five populations wherein X is the result of admixture between B and C. Population O is the outgroup of other four populations, and population A is a sister group of population B. If the proportion of admixture of lineage B into X is defined as α, and the proportion of admixture of lineage C into X is 1 – α, then f4(A, O; X, C) = αf4(A, O; B, C). Therefore, the admixture proportion α is f4(A, O; X, C)/f4(A, O; B, C). We used Higashimyo as C and modern continental East Asians as B for the genetic ancestry of test populations. We chose population B based on the f3 test result; we assumed that the population with a high f3 value and without gene flow from Jomon people was suitable as population B.
Phylogenetic analysis
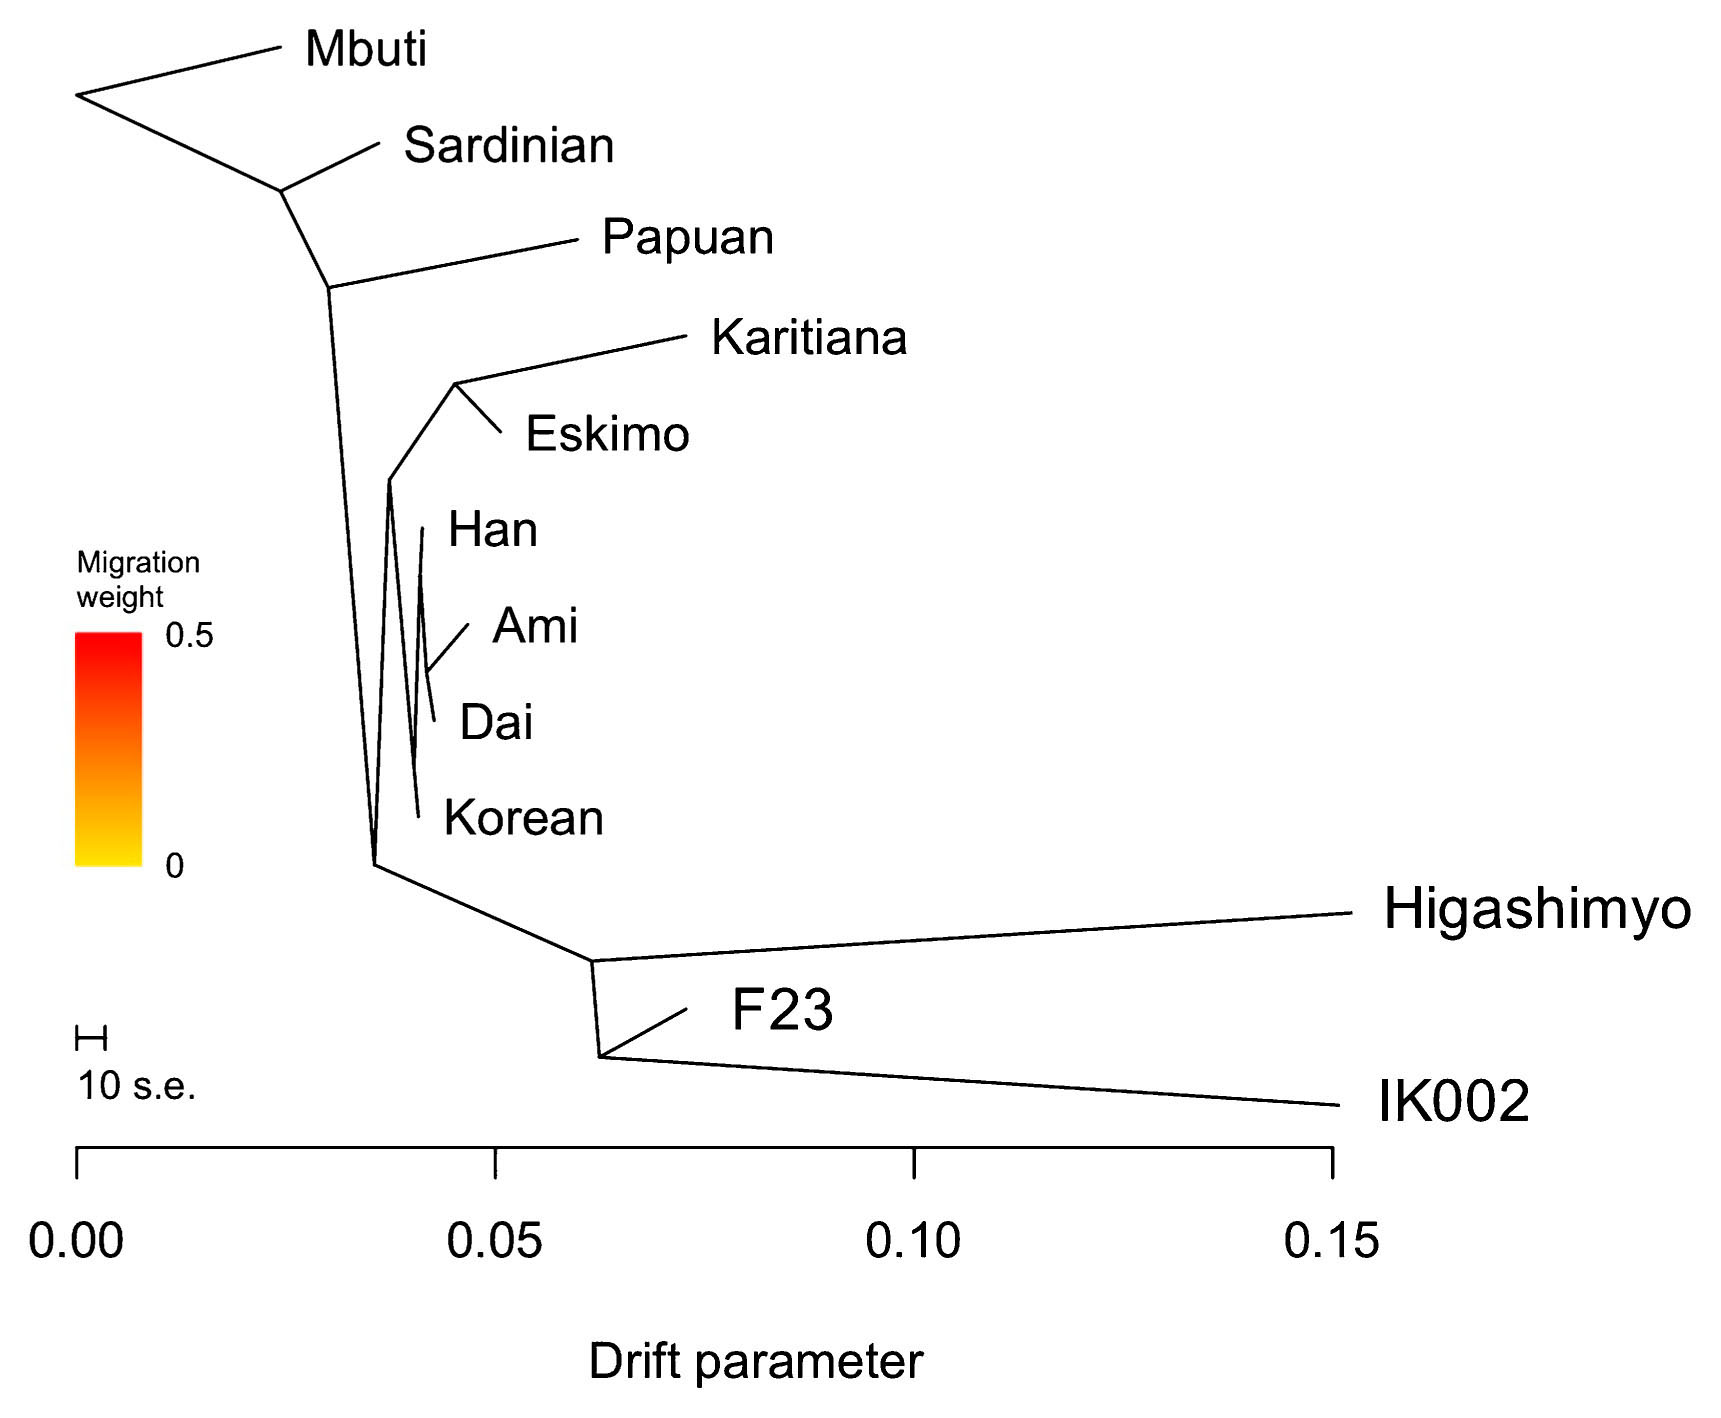
We reconstructed a maximum-likelihood (ML) tree with gene flow events using TreeMix version 1.13 (Pickrell and Pritchard, 2012). We applied Mbuti pygmies as the root using the –root flag, and constructed trees by assuming no migration and an incremental number of assumed gene flow events. Each run was performed in blocks of 500 SNPs to account for linkage disequilibrium using the –k flag. We also independently ran 100 bootstrap replicates using the –bootstrap flag to count the number of times the phylogenetic relationships were reliably detected. One SGDP Korean individual, S_Korean_1, was removed from the phylogenetic and other analyses because the individual was genetically unrepresentative of modern Koreans.
Results
DNA sequence data quality and authenticity
We obtained 468425 uniquely mapped mtDNA reads from three DNA libraries, Higashimyo-1, -2, and -3. The small peak insert lengths and highly deaminated DNA molecules were characteristic of highly degraded DNA, and are consistent with aDNA features (Supplementary Table 1). Contamination frequencies were estimated to 0.0% with schmutzi and 4.53% following the method of Kanzawa-Kiriyama et al. (2019). The results indicated that the DNA was authentic and had low contamination.
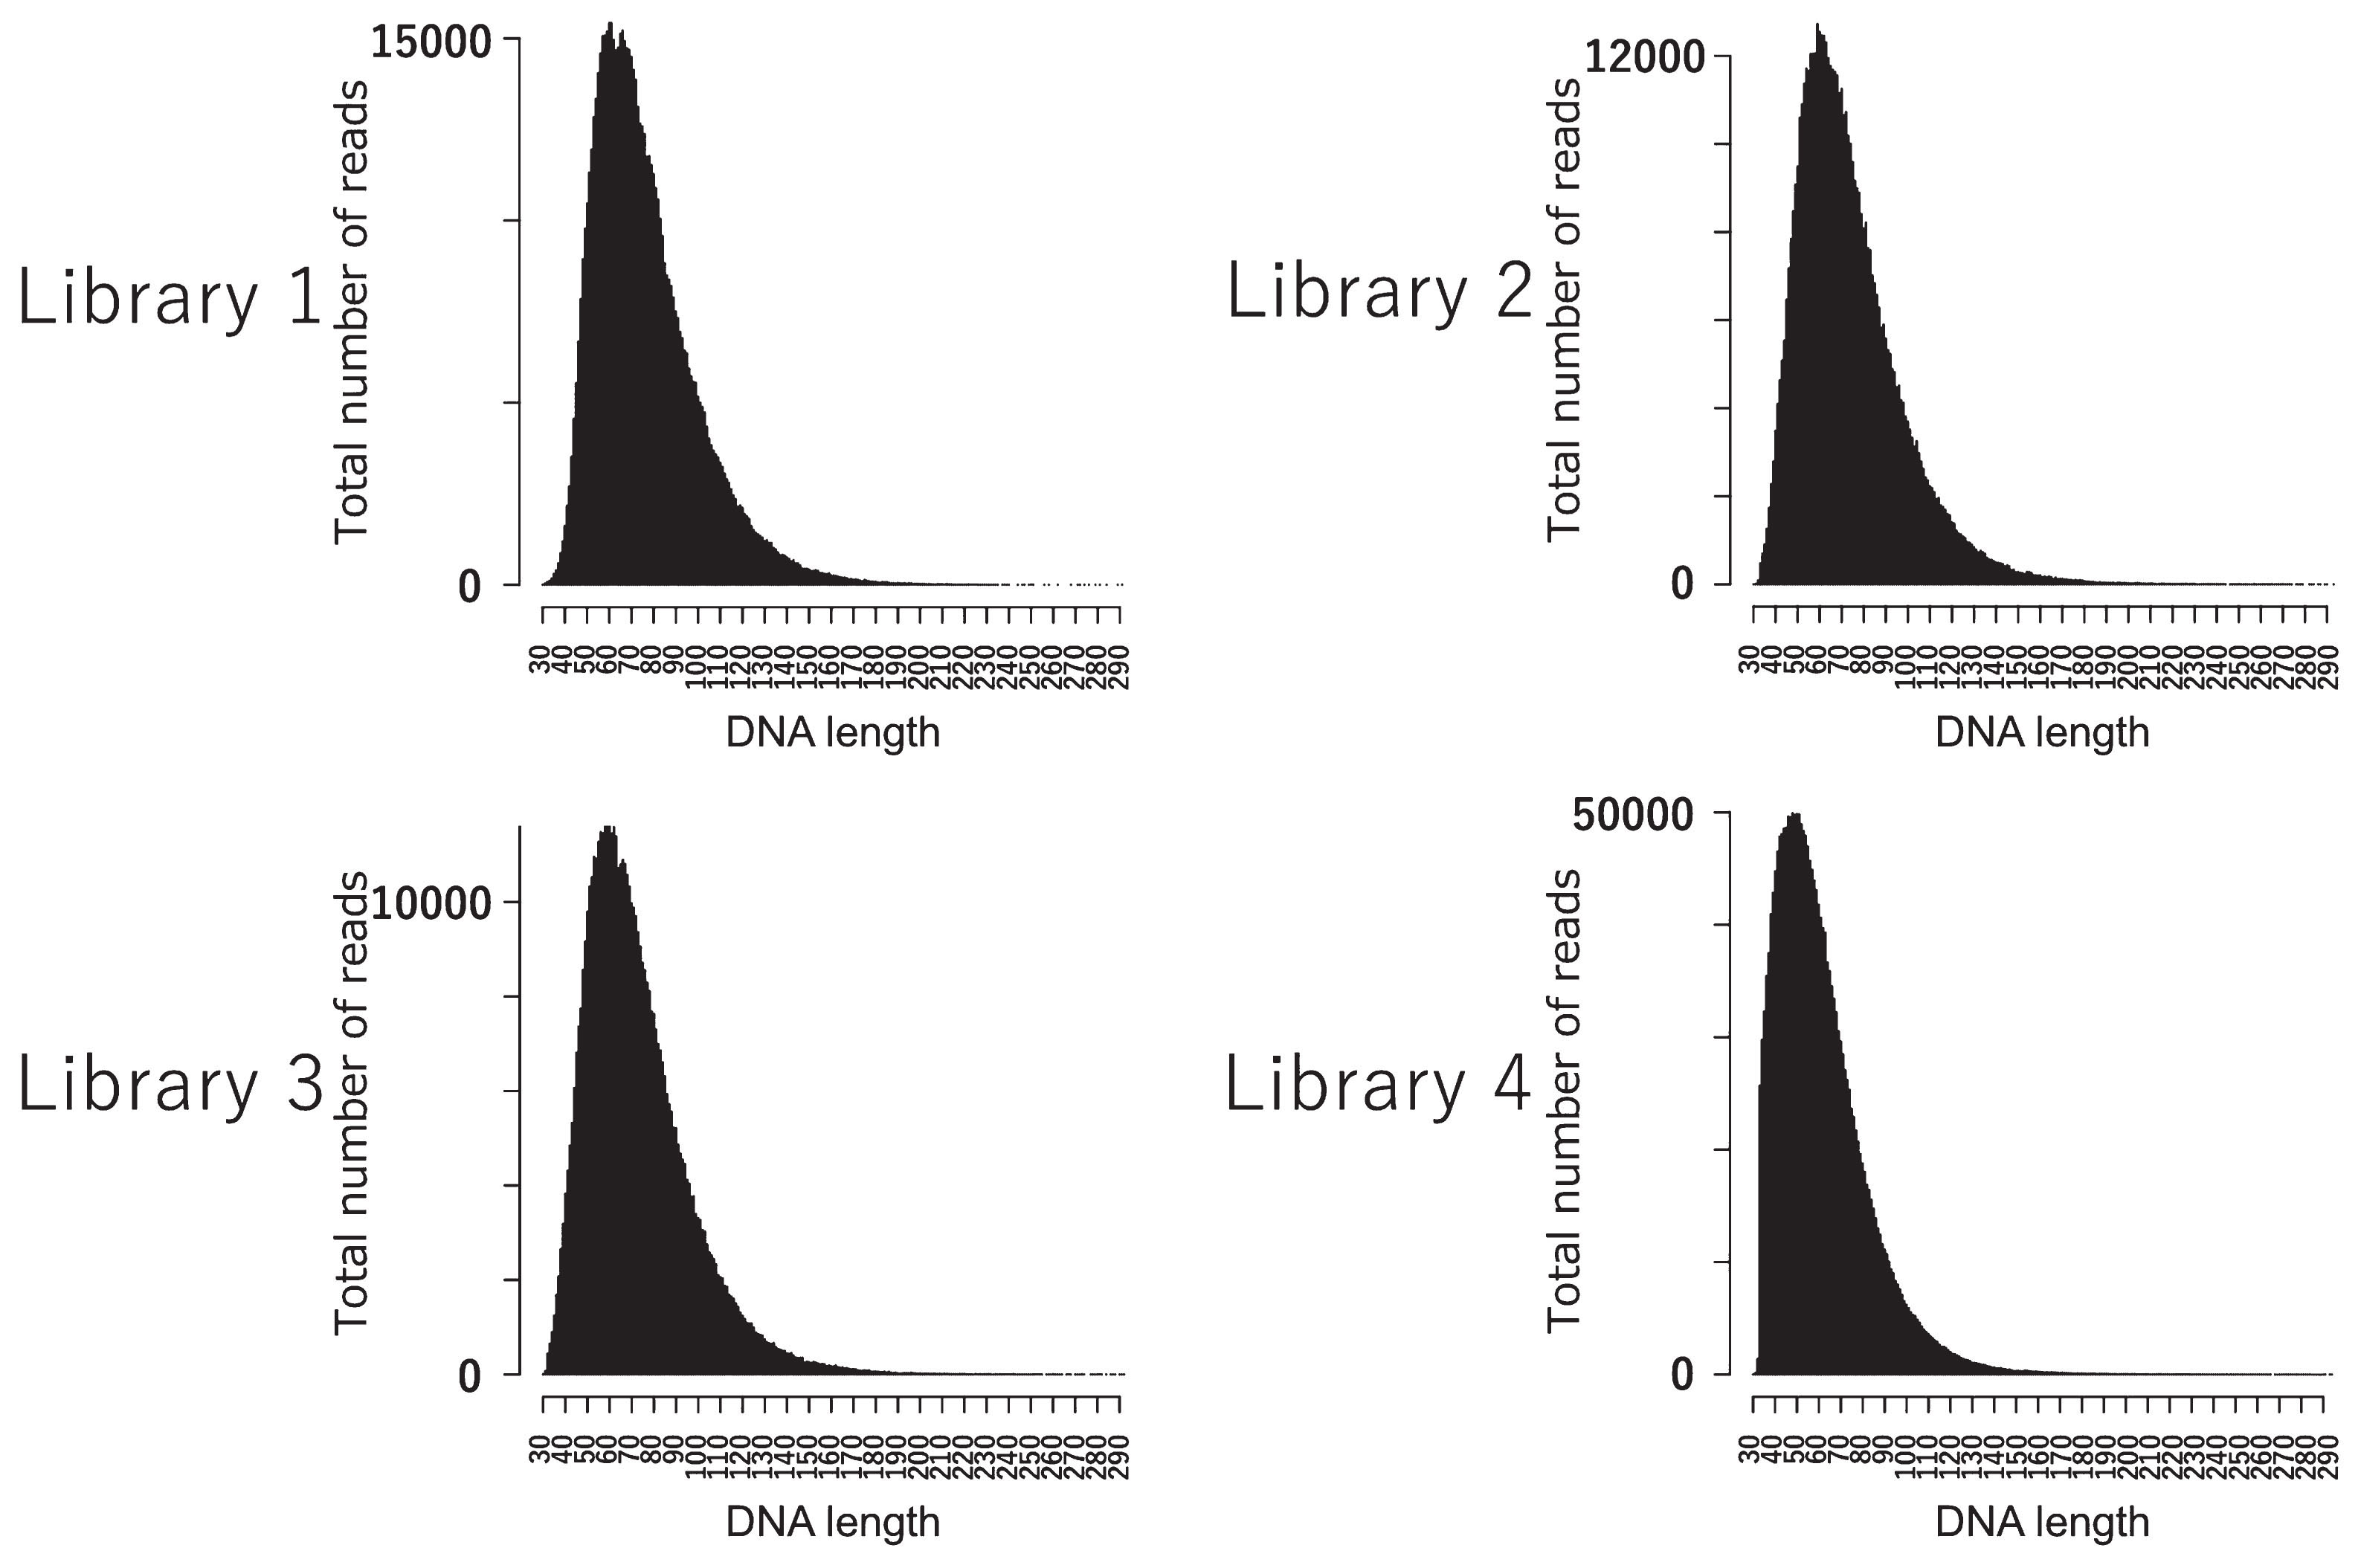
Genome sequencing yielded a total of 474 million paired-end reads (Supplementary Table 2). Approximately 4.3% of merged paired-end reads were mapped to the reference genome with q30, which was four times higher than that of the non-enriched DNA library (1.0%). The peak insert lengths were 45–59 bp, and highly deaminated DNA molecules were present in all four DNA libraries (Figure 2, Figure 3). This supports that the mapped data included authentic human DNA. The total error rate of the Higashimyo data was 0.51%, which was similar to that of previously published Jomon data (Supplementary Figure 1). Although transition sites have high error rates (0.08–0.94%) because of postmortem damage, transversion sites had low error rates (0.047–0.007%).
We estimated the contamination frequency for each library (Supplementary Table 2). The mtDNA haplogroups of each library were compatible with the results of mitochondrial genome capture. The mismatch ratios of the haplogroups for each library were 0–0.074, which indicated low contamination frequency for mtDNA except for the Higashimyo-2 library. Contamination frequencies based on deamination pattern of the reads mapped to mitochondrial and nuclear genomes were low for all DNA libraries.
We tested for reference bias and contamination to further check the quality of the Higashimyo genome data. We used reliable Jomon genome data (F23 and IK002) for the examination. The positive value of f4(Chimp, hg19; Higashimyo, IK002) suggests weak reference bias in IK002, which was previously observed (Kanzawa-Kiriyama et al., 2019) (Supplementary Table 3). The weak bias was also observed in Higashimyo when compared with F23; f4(Chimp, hg19; Higashimyo, F23) had a negative value. This might be related to differences in mapping and filtering procedures. We also subjected the genome data to an extra degree of scrutiny for contamination (e.g. via reagents). f4 results did no show evidence of African or West Eurasian contamination (Supplementary Table 4).
Mitochondrial and nuclear genome analysis
The depth of the mitochondrial genome was about 47× (Supplementary Table 1), and the mitochondrial DNA haplogroup was M7a1a*; the individual was phylogenetically located to the basal position of the haplogroup M7a1a. This is consistent with the fact that this sample was from the initial Jomon period. For most of the Jomon people in Kyushu and Okinawa that we have analyzed, their haplogroup belonged to M7a1. The fact that the Higashimyo Jomon people also had this haplogroup shows that M7a1 was dominant in Kyushu during the Jomon period. This is in contrast to the Jomon people of eastern Japan, where N9b was dominant.
The depth of coverage of the nuclear genome was 0.086×, and breadth of the coverage was 6.9%. As inferred from the ratio of reads mapped to the Y and X chromosomes, the Higashimyo skeleton examined in this study was considered male (Supplementary Table 2). The Y-chromosome haplogroup was classified into D1b. D1b-specific alleles were observed at all six SNP sites defining this haplogroup. However, no further subdivision of the D1b haplogroup was possible because of data limitations. D1b2-specific alleles were not observed at the two SNP sites defining this subhaplogroup.
We searched modern and ancient populations that are genetically close to the Higashimyo. In the PCA plot, Higashimyo clustered with other Jomon individuals (Figure 4), which indicated that all Jomon individuals analyzed here belonged to the same genetic group. Outgroup f3-statistics also showed that the other Jomon individuals were genetically closest to the Higashimyo individuals, followed by coastal and marine area East Asians, such as Japanese, Ulchi, Korean, Taiwan Aboriginal (Ami and Atayal), and Philippine populations (Kankanaey and Ilocano) (Supplementary Table 5). The f4 results also revealed that the Higashimyo data shared significantly more alleles with Japanese, Ulchi, and Koreans than with Han Chinese (Z > 3; Supplementary Table 6, Supplementary Table 7). These signatures are similar to that of the F23 Hokkaido Jomon (Kanzawa-Kiriyama et al., 2019). Therefore, we investigated whether the common characteristics among the Jomon people are equally shared. None of the test populations analyzed showed significant f4 values (Supplementary Table 8, Supplementary Table 9), which meant that all three Jomon individuals were equally distant from the test populations.
Next, we investigated the genetic structure of the Jomon population. f4 statistics did not show significant f4 values in any combination (Supplementary Table 10), which means that there was no significant specific affinity between geographically or temporally close Jomon individuals. The ML tree also revealed that the three Jomon individuals clustered together, and belonged to an outgroup of all East Eurasians and Native Americans. Among the three Jomon individuals, the phylogenetic position of the Higashimyo Jomon was unstable between 600K SNPs and WGS data (Figure 5, Supplementary Figure 2). In the 600K SNPs data, the Higashimyo Jomon was located in the outgroup of F23 and IK002, with 59% bootstrap replicates. On the contrary, WGS data represents IK002 as outgroup of Higashimyo and F23 in 79% bootstrap replicates. The long branch length of Higashimyo and IK002 might be because pseudohaploid genotypes were retrieved from low-coverage genome data.
Finally, we estimated the proportion of Jomon DNA in modern human populations. When three gene flow events were allowed in the ML tree using 600K SNP data, gene flow from the Higashimyo Jomon to the root of Japanese and Ulchi was detected (Supplementary Figure 3); the weight of the migration edge was 0.09158. The gene flow event was not securely estimated when using WGS data (Supplementary Figure 4). The Jomon proportion was 0.097 in Japanese people in the f4-ratio test when Korean people were used as population B (Table 1), which was close to the result of TreeMix analysis. The Jomon ancestry was around 0.05 and 0.06–0.08 in the Korean and Ulchi people, respectively. The population B was chosen based on the result of f3-statistics (Supplementary Table 11, Supplementary Table 12).
Table 1
The results of
f4-ratio tests to estimate the Jomon ancestry proportion in population X
| Outgroup |
A |
B |
X |
C |
α |
1 – α |
SE |
Z |
No. of SNPs |
| Papuan |
Dai |
Korean |
Japanese |
Higashimyo |
0.903 |
0.097 |
0.028 |
32.1 |
233681 |
| Papuan |
Dai |
Han |
Japanese |
Higashimyo |
0.860 |
0.140 |
0.019 |
46.1 |
233681 |
| Papuan |
Dai |
Han |
Korean |
Higashimyo |
0.952 |
0.048 |
0.027 |
35.2 |
233681 |
| Papuan |
Han |
Oroqen |
Ulchi |
Higashimyo |
0.937 |
0.063 |
0.030 |
31.3 |
209666 |
| Papuan |
Han |
Hezhen |
Ulchi |
Higashimyo |
0.926 |
0.074 |
0.032 |
28.5 |
209666 |
| Papuan |
Han |
Daur |
Ulchi |
Higashimyo |
0.919 |
0.081 |
0.030 |
30.4 |
209666 |
Discussion
Our results indicate that the Jomon people formed clusters with each other in PCA and phylogenetic trees. This finding indicates that the people responsible for the Jomon culture may be genetically derived from a common ancestral group. This hypothesis is supported by the fact that the Y-chromosome haplogroup D1b found in the Funadomari Jomon (Kanzawa-Kiriyama et al., 2019) was also detected in the Higashimyo individual.
Judging from the Y-chromosome DNA haplogroup observed in all the Jomon specimens that have ever been analyzed (Kanzawa-Kiriyama et al., 2019 and this study), haplogroup D1b is expected to be common in the Jomon population. Interestingly, haplogroup D, which contained D1b, remains in areas separated by the seas and mountains of Asia, such as the modern-day Himalayan region and Japan. These findings suggest that this haplogroup was originally widely distributed and later isolated. The geographical environment of the Japanese archipelago, which is separated by the sea, may have prevented interaction between the influx of people during the Paleolithic period and the continental population, which resulted in the formation of the unique genetic characteristics of the Jomon people.
In the three Jomon individuals, Higashimyo, Funadomari, and Ikawazu, the results of the f4 test and the phylogenetic tree did not reflect the large regional and chronological differences in provenance. As mentioned above, Jomon people are descendants of a common ancestor, although the process of their formation is still unknown. However, their origin dates back to the Paleolithic period based on the distribution of mitochondrial DNA haplogroups of the Jomon people and the age of divergence, which was 22000–23000 YBP (Adachi et al., 2011), and their phylogenetic basal position in the nuclear genome analysis (Kanzawa-Kiriyama et al., 2019).
The f4 test and phylogenetic tree results indicated that the ancestral population was phylogenetically a three-branch polytomy. This finding may suggest that differentiation and diffusion of Jomon people and/or their ancestral groups may have been rapid, and after this differentiation and diffusion, regional interactions were limited or scarce. Moreover, there may have been no migrations that significantly changed the genetic composition during the Jomon period, and genetic differentiation was promoted by the progression of regionalization throughout the Jomon period.
On the basis of the mitochondrial haplogroup ratio of M7a and N9b in modern Japanese, which are the representative haplogroups of the Jomon people, it is possible that western Jomon people predominantly genetically contributed to modern Japanese people. However, nuclear genome analysis does not provide evidence that the western Jomon individual of Higashimyo is more closely related to modern Japanese than to other Jomon people. We found that only 6.9% of the nuclear genome was readable in the Higashimyo individual, which may have obscured the results. Alternatively, a previous study (Kanzawa-Kiriyama et al., 2019) showed that modern Japanese only had about 10% of their DNA derived from the Jomon. Therefore, we could not clarify regional differences among Jomon people in this analysis. However, we found that aDNA provided unique insights into the population history of the Jomon population.
Our results indicated minimal gene flow among genetically similar populations from the initial to late Jomon period. The history of isolation, migration, and genetic drift in the Japanese archipelago gave rise to the unique genetic characteristics of Jomon people. To provide higher resolution and additional insights into the interactions among Jomon people that shaped their unique cultures, it is necessary to accumulate high-quality genome data for numerous Jomon populations that span a wide range of regions and ages, and compare and contrast these data with the highest possible precision.