Original Articles
Sexual dimorphism in crania belonging to the 1st century AD from the tomb of Mentuemhat (TT34), Luxor, Egypt
2022 Volume 130 Issue 2 Pages 135-145

Details
2022 Volume 130 Issue 2 Pages 135-145
The objective of this study was to analyze the degree of sexual dimorphism of the crania found in room 127 (tomb TT34, Thebes) and to estimate the role of morphometric dimensions in sexual dimorphism. We studied 43 female and 41 male crania. Forty-four metric measurements were taken and 31 indices were calculated. Differences were evaluated using chi-square and Student’s t-tests. A stepwise discriminant analysis with cross-validation was applied. The Sexual Dimorphism Index (SDI) indicates that the values of all variables are higher in males except for the minimum width of the nasal bones and the facial angle. The highest SDI values are observed in the bizygomatic width and in the variables that measure the size of the maxilla (palatal area). In the indices, the biggest differences are found in the craniofacial index (P < 0.001). Using variables of the neurocranium and splanchnocranium, several highly reliable discriminant functions have been obtained. The most dimorphic variables are related to regions where the cranium connects to the muscles that keep the head upright and allow tilting and rotating movements in relation to the trunk. The bizygomatic width and the external biorbital width are the most dimorphic of the facial region, differences that are justified by a greater convexity of the zygomatic arch which could be related to a hypertrophy of the temporal muscle. The width of the zygomatic arch, its robustness, and the resulting degree of sexual dimorphism may be due to dietary and/or cultural habits related to chewing and the use of the mouth as a tool.
Tomb TT34 is located in a section of the great necropolis known as El-Assasif, which is very close to the area of Deir el-Bahari on the western bank of the Nile in the ancient city of Thebes (Luxor, Egypt; Figure 1). The tomb belonged to Mentuemhat, the Fourth Priest of Amun, ruler of Thebes and southern Egypt from Hermopolis in the north to Elephantine in the south. He served during the 25th and 26th dynasties from 670 to 648 BC (Leclant, 1961; Gomàa, 2006, 2007).
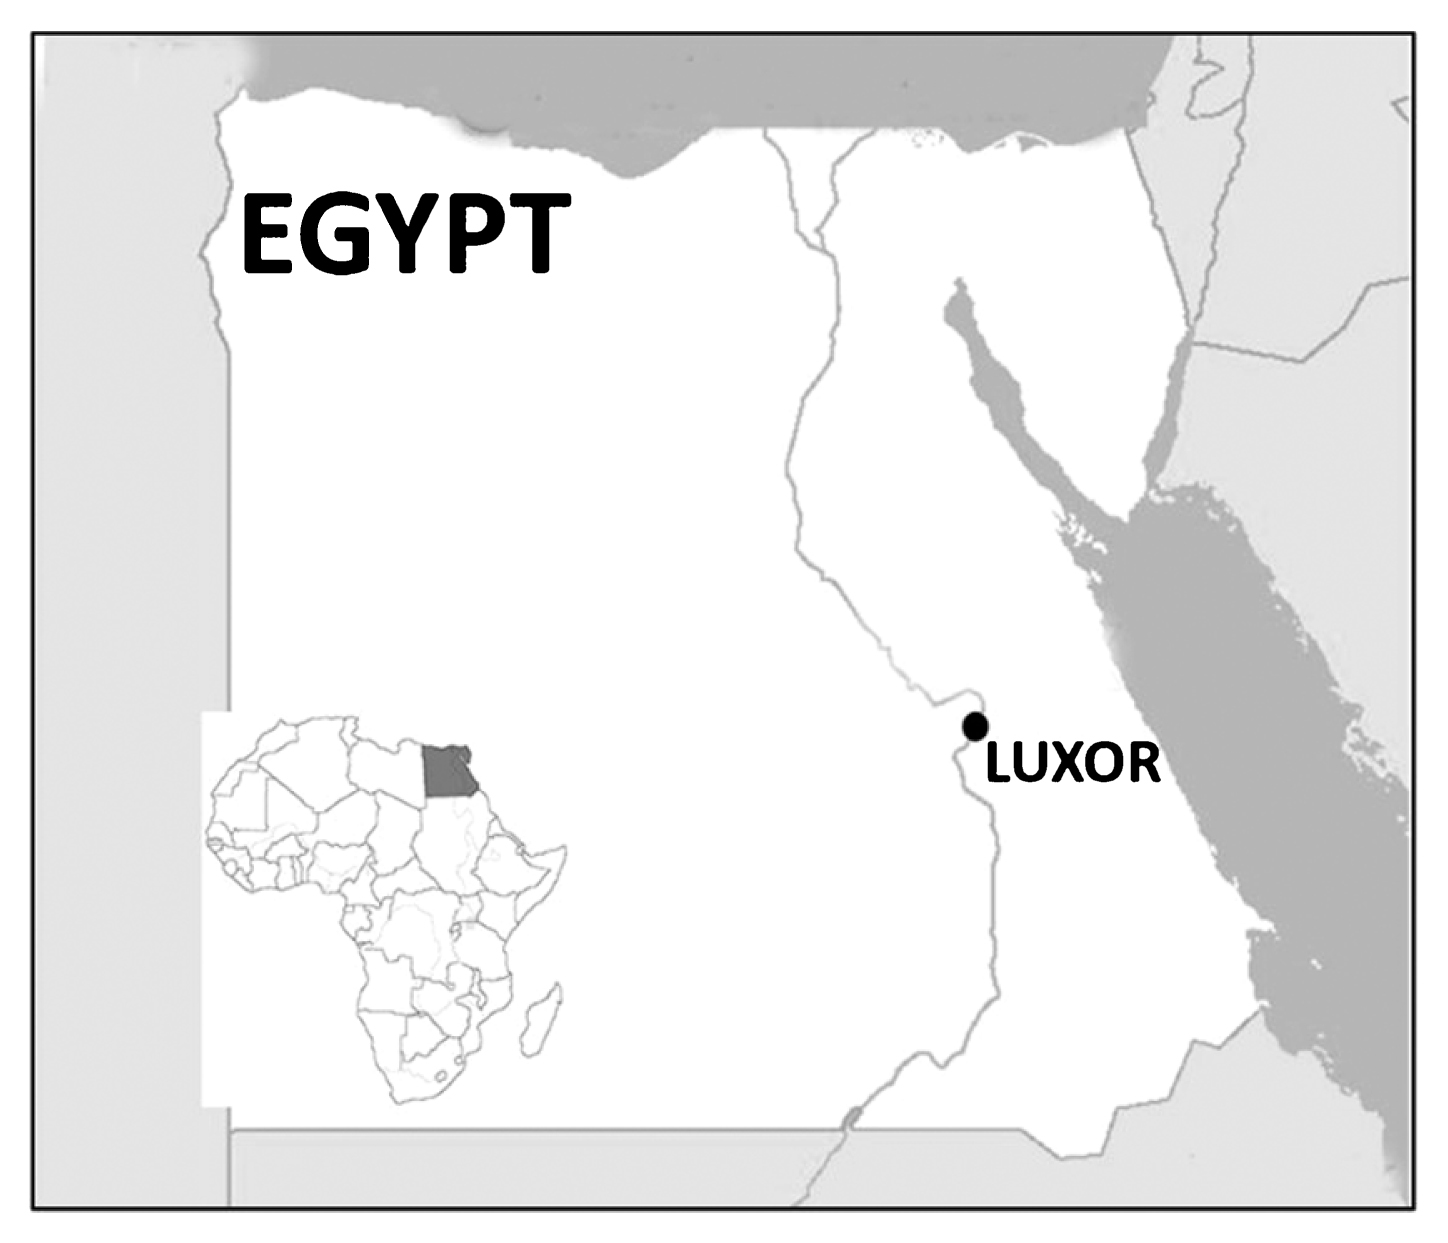
Luxor, Egypt.
Inside one of the tomb’s chambers, a set of skeletal remains dated to the 1st–2nd century AD (between c. 50 and 150 AD) was discovered beside a set of Roman-type clay containers with dates closely related to the skeletal remains (Bagnall, 2001; Bagnall and Davoli, 2011; Gates-Foster, 2012). These amphorae, or at least the fragments of them, can be seen throughout the funerary space. The most abundant amphorae are the bi-truncated cone-shaped amphorae AE3, of group IX of the Nile Clay Amphorae (K700/K702 amphorae) and are Egyptian copies. According to Empereur and Picon (1989), they were possibly made during the times of the emperors Nero and Trajan and were determined to be used between 50 and 120 AD.
After the Roman takeover, a Roman garrison was installed at Thebes but withdrew in 23 AD. Soon after, a revolt broke out and was suppressed by the Prefect in 29 AD (Bowman, 1986; Strudwick and Strudwick, 1999). During this period, Thebes was used as a strategic center for the rulers of the Dodekaschoinos region of Lower Nubia. The Romans tried to conquer the region but were forced to come to an agreement with the Meroitic people. The Kushites still used the Philae Temple in Aswan as an important area of worship (Bagnall, 1995; Welsby, 1996) and as a necessary location for access to religious places.
For many centuries, the Nubians coexisted in Thebes to such an extent that they reached high political and religious ranks and positions in ancient Egypt (Bowman, 1986). Thebes was still a very active city during the Roman era and Roman officials played important roles in tax collection and settlement of disputes (Bagnall, 1995). Furthermore, it is very probable that in this Roman period Nubian pilgrims could have visited the temples of Karnak and Luxor in Thebes during the 1st and 2nd centuries AD (Bowman, 1986). Therefore, there was an important presence of Romans in the city and a large population of ethnic Nubians.
Reconstructing characteristics of the lives of the different groups that inhabited the region depends largely on determining the sex of the remains which have been discovered. In order to address the biological variability of this ancient Egyptian population, the aim of this investigation was to perform a typological analysis on a group of crania found in room 127, tomb TT34 in the El-Assasif necropolis to compare the degree of sexual dimorphism, and to determine the value of cranial morphometric dimensions in determining sexual dimorphism through the calculation of highly reliable discriminant functions which could be used in other samples of similar ancestry and chronology.
We do not know the social status of the individuals in the sample, although no object of value has been found in connection with the remains within this tomb. However, grave robbers were very active in this burial area, so any possible objects of value that might have accompanied the remains probably disappeared with their activity.
We consider this study of great interest as it was carried out in situ on an extensive collection of crania in a good state of preservation. Anthropological studies of sexual dimorphism in this historical period and in the most important city of Egypt are very scarce. We provide data that can be used by other researchers in future projects and we focus on a human group of great historical and anthropological interest.
In room 127 of the tomb of Mentuemhat (TT34), long bones, scapulae, crania, and some mandibles were found stacked and assembled in organized sets of bones. There is no written evidence to prove who and when these assemblages were made, but it is considered to have taken place not far from the date of the discovery of the tomb because the room was left tidy, although the bones were covered by a significant layer of dust.
The craniometric study focused on 84 crania of adult individuals that were in good condition. Measurements were taken which had not been altered by postmortem examinations, therapeutic surgeries, or disease. In total, there were 44 metric variables including 26 of the neurocranium and 18 of the splanchnocranium (Table 1). All variables were taken in accordance with the instructions of Martin (1928), Martin and Saller (1957), Bräuer (1992), Buikstra and Ubelaker (1994), and Bass (1995). To take the measurements, we used an outside diameter caliper, an electronic digital caliper, and a tape measure.
| Neurocranium | Abreviation | Numbe | Neurocranium | Abreviation | Number |
|---|---|---|---|---|---|
| Maximum cranial length (g-op) | GOL-1b | 1 | Nasion–bregma chord (frontal chord) (na-br) | FRC-29b | 29 |
| Glabella–inion length (g-I) | GIL-2 | 2 | Bregma–lambda chord (parietal chord) (br-la) | PAC-30b | 30 |
| Glabella–lambda length (g-lb) | GLL-3 | 3 | Lambda–opisthion chord (occipital chord) (la-o) | OCC-31b | 31 |
| Cranial base length (ba-na) | BNL-5b | 5 | |||
| Foramen magnum length (ba-o) | FOL-7b | 7 | Splanchnocranium | ||
| Maximum cranial breadth (eu-eu) | XCB-8b | 8 | Basi-alveolar length (ba-pr) | BPL-40b | 40 |
| Minimum frontal breadth (ft-ft) | WFB-9b | 9 | Outer bi-orbital breadth (fmt-fmt) | UFB-43 | 43 |
| Maximum frontal breadth (co-co) | XFB-10b | 10 | Bi-orbital breadth (ec-ec) | EKB-44b | 44 |
| Biauricular breadth (au-au) | AUB-11b | 11 | Bizygomatic breadth (zy-zy) | ZYB-45b | 45 |
| Biporion breadth (po-po) | BPB | Bimaxillary breadth (zm-zm) | ZMB-46b | 46 | |
| Biasterionic breadth (as-as) | ASB-12b | 12 | Upper facial length (n-pr) | NPH-48b | 48 |
| Bimastoid breadth (ma-ma) | BMB-13 | 13 | Interorbital breadth (da-da) | DKB-50 | 50 |
| Foramen magnum breadth (ba-o) | FOB-16b | 16 | Orbital breadth, left (mf-ek) | OBB-51b | 51 |
| Basi-bregmatic height (ba-br) | BBH-17b | 17 | Orbital height, left (⊥ mf-ek) | OBH-52b | 52 |
| Mastoid height | MDH-19ab | 19a | Nasal breadth (al-al) | NLB-54b | 54 |
| Mastoid width | MDB | Nasal height (na-ns) | NLH-55b | 55 | |
| Porion–bregma height (br-po) | PBH-20c | 20 | Nasal bone length (na-rh) | NBH-56 | 56 |
| Horizontal perimeter | HPE-23 | 23 | Least nasal breadth | WNB-57b | 57 |
| Transverse arc (po-b-po) | TRA-24 | 24 | Maxilloalveolar length | MAL-60b | 60 |
| Total sagital arc (n-o) | TSA-25 | 25 | Palate breadth, external | MAB-61b | 61 |
| Sagittal frontal arc (frontal arc) (na-br) | FRA-26b | 26 | Palate length, internal | PAL-62 | 62 |
| Saggital parietal arc (parietal arc) (br-la) | PAA-27b | 27 | Palate breadth, internal | PAB-63 | 63 |
| Sagital occipital arc (occipital arc) (la-o) | OCA-28b | 28 | Weisbach’s facial angle | WFA |
Thirty-one craniometric indices were obtained from these variables (Table 2). The indices provide a practical, simple, and reliable way to determine the morphology of the cranium in general and the morphology of specific areas in both the neurocranium and the splanchnocranium.
| Index | Formula |
|---|---|
| Cranial Index (CRI) | 8/1 |
| Frontoparietal Transversal Index (FPT) | 9/8 |
| Frontotransversal Index (FTI) | 9/10 |
| Transversal Index (TIN) | 17/8 |
| Vertical Index (VIN) | 17/1 |
| Porion Transversal Index (PTI) | 20/8 |
| Porion Vertical Index (PVI) | 20/1 |
| Frontal–Sagittal Index (FSI) | 29/26 |
| Parietal–Sagittal Index (PSI) | 30/27 |
| Occipital–Sagittal Index (OSI) | 31/28 |
| Frontosagittal Arc Index (FSA) | 26/25 |
| Parietal–Sagittal Arc Index (PSA) | 27/26 |
| Occipital–Sagittal Arc Index (OSA) | 28/25 |
| Foramen Magnum Index (FMI) | 16/7 |
| Perimeter Heigth Index (PHI) | 17/23 |
| Jugofrontal Index (JFI) | 9/45 |
| Superior Malar Index (SMI) | 48/46 |
| Facial Superior Index (FSI) | 48/45 |
| Nasal Index (NAI) | 54/55 |
| Orbital Index (ORI) | 52/51 |
| Nasofacial Vertical Index (NFV) | 55/48 |
| Palate Index (PAI) | 63/62 |
| Jugomalar Index (JMI) | 46/45 |
| Orbitofacial Transverse Index (OFT) | 51/45 |
| Orbitofacial Vertical Index (OFV) | 52/48 |
| Interorbital Index (IOI) | 50/44 |
| Maxilloalveolar Index (MAI) | 61/60 |
| Palatofacial Transversal Index (PFT) | 61/45 |
| Palatofacial Longitudinal Index (PFL) | 60/40 |
| Gnathic Index (GNI) | 40/5 |
| Craniofacial Transverse Index (CFT) | 45/8 |
As we have indicated above, the sample came from an ossuary in which all elements were mixed, with no possibility for individuation. Therefore, the only way to sex each cranium was using its own morphological characteristics. We chose the widely used non-metric method of Ferembach, Schwidetzky, and Stloukal (1979) to estimate the sex of these crania because it is based on the shape of certain areas of the neurocranium and splanchnocranium which have a high sexual dimorphism. Moreover, these regions are different from the areas targeted by the metric variables that were used to establish the DMS of the sample. Age at death was determined from the degree of dental wear (Brothwell, 1989) and synostosis of the cranial sutures (Masset, 1982; Meindl and Lovejoy, 1985; Meindl et al., 1985).
The degree of sexual dimorphism was estimated from the Sexual Dimorphism Index (SDI) using the formula (male mean/female mean) × 100. This index shows the difference between the sexes for each variable (Borgognoni-Tarli and Reppeto, 1986). SDI values close to 100 indicate low sexual dimorphism, which increases as the deviation from the value of 100 increases (Vodanovic et al., 2006).
Data were analyzed using SPSS version 24.0 (SPSS Inc., Chicago, IL). Data distributions were checked and means and standard deviations were estimated for the morphometric variables. Sex differences in the distributions of the different categories were evaluated using the chi-square test. Metric variables showed a normal distribution so differences between mean values were estimated using Student’s t-test. A stepwise discriminant analysis was carried out, with replacement of the missing values in the original database. The cross-validation method was applied to establish the reliability and predictability of the functions obtained. We worked at a 5% confidence level.
The crania were sexed based on their morphology (Ferembach et al., 1979) with 43 (51.2%) found to be female and 41 (48.8%) male. Of the sample, 45.2% were determined to be mature adults (between 40 and 59 years old), 37% were between 25 and 39 years old (young adults), 9 individuals (10.7%) were over 60 years of age (old adults), and only 7.1% were estimated to be adults under 25 years old.
Morphology of the craniumAnalysis of the cranial measurements taken showed that, as a rule, female crania are classified as very short or short (53.8%) while male crania are long or medium-long (70.7%) with a significant difference between the two distributions (χ2 = 9618; P = 0.040). In both sexes the maximum width is mainly medium (female, 41.9%; male, 40.0%) and narrow (female, 32.6%; male, 34.1%), while at the asterion the most frequent categories are medium width (female, 32.6%; male, 34.1%) and narrow (female, 30.2; male, 31.7%). The width at the level of the external auditory meatus is wide for 56% of female crania and for 61% of male crania.
In terms of shape, 42% of female crania and 51.2% of male crania are classified as dolichocranial or elongated. No male cranium is classified as rounded; however, 14% of the female crania are included in this category (χ2 = 10.237; P = 0.037). All female crania and 57.3% of the male crania are classified as cryptozygous (smaller facial width than the maximum width at the parietals). Also, 83.7% of the female crania and 87.8% of the male crania were classified as eurymetope (wide in the anterior zone with respect to the maximum width at the parietals). Regarding the contour, an ovoid contour was observed in male individuals (70.7%) and between ovoid (40%) and rhomboid (32.1%) in the case of females.
When viewed from the side (norma lateralis), the profile is curvilinear with a pronounced (37%) or very prominent (27.5%) glabella in males and less prominent (91.4%) glabella in females (categories by Olivier and Demoulin, 1984). The occipital shows more evident development of the inion in the male cranium (46% ‘very developed’) compared to the female (67.2% ‘not developed’). The relationship between height and length is mostly in the orthocrane category (average height) in both sexes (female, 44.2%; male, 46.3%). The forehead is mainly orthometope (‘convex’) in both males (73.2%) and females (79.1%). The mastoid processes are large both in height (female, 53.5%; male, 51.2%) and width in males and females. From a frontal point of view, the forehead is, for more than half of the sample, moderately divergent in both sexes (female, 53.5%; male, 51.2%). The minimum width of the forehead is medium, and the maximum is narrow in both sexes. The bizygomatic width is narrow in 28.0% of female crania and 31.7% of male crania.
Facial shape is represented by the upper facial index. In the current study, female faces are mostly mesene or medium (33.6%) while male faces are classified as medium (24.4%) and wide (36.6%) with few male faces classified as narrow (χ2 = 8.76; P = 0.033). The orbits are mesoconch (35%) and hypsiconch (25.6%) in females and mesoconch in 53.7% of male crania (χ2 = 10.13; P = 0.017). The nose is of medium width (32.6%) and narrow (18.6%) in the female cranium and medium (24.4%) and wide (24.4%) in the male cranium. With regard to height, the nose is short (female, 40.6%; male, 43.9%) and of a chamaerrhine shape or rather wide (female, 44.2%; male, 36.6%) in both sexes.
The base of the cranium is of medium length in most males (61%) and short in females (41.8%). The maxillary bone is wide (brachycranic) in both males (34.8%) and females (39%). The relationship between the width and length of the foramen magnum was average for 42% of females and wide in 48.8% of males, while a narrow palate (leptostaphyline) was more frequent in both sexes (female, 44.2%; male, 39%).
Sexual dimorphism of the sampleCharacterization of the sample from the analysis of the SDI (Table 3) indicates that, in the case of the variables of the neurocranium, all values are higher than 100. The highest are those calculated for the variables associated with the mastoid process, the foramen magnum, the porion–porion width, the glabella–inion length, the occipital sagittal arch, the maximum length of the cranium, and the length of the cranium base.
| Variable | Male series | Female series | P | SDIa | ||||
|---|---|---|---|---|---|---|---|---|
| N | x | σ | N | x | σ | |||
| GOL-1 | 40 | 185.67 | 5.76 | 39 | 177.41 | 7.22 | <0.001 | 104.66 |
| GIL-2 | 40 | 175.83 | 5.97 | 39 | 167.10 | 7.88 | <0.001 | 105.22 |
| GLL-3 | 40 | 180.30 | 5.68 | 39 | 172.59 | 6.44 | <0.001 | 104.47 |
| BNL-5 | 40 | 101.53 | 3.65 | 38 | 97.55 | 7.37 | 0.003 | 104.08 |
| FOL-7 | 41 | 35.33 | 2.66 | 40 | 33.96 | 1.62 | 0.007 | 104.03 |
| XCB-8 | 41 | 135.54 | 4.57 | 42 | 132.91 | 4.28 | 0.008 | 101.98 |
| WFB-9 | 40 | 96.13 | 4.23 | 42 | 92.64 | 3.38 | <0.001 | 103.76 |
| XFB-10 | 41 | 113.78 | 5.57 | 41 | 111.59 | 5.21 | 0.69 | 101.96 |
| AUB-11 | 40 | 119.77 | 5.74 | 40 | 113.80 | 4.24 | <0.001 | 105.25 |
| BPB | 40 | 115.29 | 4.45 | 42 | 108.63 | 4.35 | <0.001 | 106.13 |
| ASB-12 | 41 | 107.28 | 5.44 | 41 | 104.63 | 4.94 | 0.024 | 102.53 |
| BMB-13 | 38 | 104.17 | 5.57 | 40 | 98.48 | 4.29 | <0.001 | 105.77 |
| FOB-16 | 40 | 30.87 | 2.17 | 41 | 28.44 | 1.45 | <0.001 | 108.54 |
| BBH-17 | 40 | 133.40 | 4.90 | 39 | 128.33 | 3.24 | <0.001 | 103.95 |
| BPH-20 | 40 | 127.10 | 4.41 | 40 | 122.93 | 3.95 | <0.001 | 103.34 |
| MDH-19a | 40 | 31.70 | 4.72 | 40 | 27.12 | 2.50 | <0.001 | 116.85 |
| MDB | 40 | 48.69 | 3.17 | 41 | 45.77 | 3.01 | <0.001 | 106.38 |
| HPE-23 | 40 | 520.28 | 13.15 | 37 | 501.00 | 15.12 | <0.001 | 103.84 |
| TRA-24 | 40 | 306.88 | 8.64 | 39 | 299.85 | 9.19 | 0.001 | 102.34 |
| TSA-25 | 38 | 375.47 | 14.06 | 41 | 362.69 | 14.23 | 0.002 | 103.52 |
| FRA-26 | 40 | 126.25 | 5.55 | 39 | 122.39 | 6.80 | 0.007 | 103.15 |
| PAA-27 | 41 | 129.46 | 7.55 | 41 | 125.68 | 7.27 | 0.024 | 103.00 |
| OCA-28 | 40 | 119.44 | 9.99 | 38 | 113.77 | 8.41 | 0.01 | 104.98 |
| FRC-29 | 40 | 112.07 | 4.14 | 37 | 107.77 | 4.57 | <0.001 | 103.98 |
| PAC-30 | 41 | 116.42 | 6.07 | 41 | 112.99 | 7.58 | 0.027 | 103.03 |
| OCC-31 | 41 | 97.47 | 5.07 | 36 | 95.08 | 6.62 | 0.040 | 102.51 |
| AUB-35 | 40 | 119.78 | 5.74 | 40 | 113.81 | 4.25 | <0.001 | 105.24 |
| BPL-40 | 34 | 96.96 | 5.10 | 30 | 91.43 | 6.12 | <0.001 | 106.04 |
| UFB-43 | 40 | 104.34 | 3.67 | 39 | 98.56 | 3.16 | <0.001 | 105.86 |
| EKB-44 | 31 | 97.90 | 2.72 | 26 | 93.36 | 2.89 | <0.001 | 104.86 |
| ZYB-45 | 26 | 131.62 | 3.76 | 27 | 120.52 | 4.61 | <0.001 | 109.21 |
| ZMB-46 | 32 | 97.23 | 5.55 | 27 | 91.17 | 3.86 | <0.001 | 106.64 |
| NPH-48 | 32 | 65.42 | 3.73 | 28 | 63.15 | 4.06 | 0.028 | 103.59 |
| DKB-50 | 33 | 20.61 | 1.57 | 32 | 20.07 | 2.16 | 0.252 | 102.69 |
| OBB-51 | 33 | 40.90 | 1.92 | 30 | 39.89 | 5.54 | 0.332 | 102.53 |
| OBH-52 | 33 | 33.44 | 2.13 | 32 | 33.06 | 1.81 | 0.434 | 101.15 |
| NLB-54 | 33 | 26.27 | 2.13 | 31 | 24.58 | 1.58 | 0.001 | 106.88 |
| NLH-55 | 33 | 49.77 | 4.23 | 31 | 46.98 | 2.89 | 0.003 | 105.94 |
| NBH-56 | 28 | 22.88 | 2.70 | 26 | 21.83 | 2.76 | 0.158 | 104.80 |
| WNB-57 | 34 | 10.47 | 2.12 | 31 | 10.69 | 2.54 | 0.695 | 97.94 |
| MAL-60 | 32 | 54.42 | 3.94 | 31 | 50.95 | 3.32 | <0.001 | 106.81 |
| MAB-61 | 32 | 62.41 | 4.27 | 30 | 57.30 | 5.63 | <0.001 | 108.92 |
| PAL-62 | 31 | 48.39 | 6.15 | 31 | 44.54 | 4.10 | 0.005 | 108.64 |
| PAB-63 | 30 | 38.03 | 2.78 | 31 | 35.00 | 2.14 | <0.001 | 108.65 |
| WFA | 31 | 76.14 | 7.59 | 27 | 76.66 | 5.17 | 0.819 | 99.32 |
With respect to the metric variables of the splanchnocranium, the dimensions of the male cranium are also greater except for the minimum width of the nasal bones and the facial angle (a measurement of the degree of prognathism) which are both close to 100. The highest values are observed in the bizygomatic width and in all variables that measure the size of the maxilla in its palatal area; the width of the external and internal palate, the length of the internal and external palate, the bimaxillary width and consequently, the length of the face. The nasal aperture area also shows high SDI, both in width and length, indicating that the nose was wider and longer in males than in females.
When analyzing how the SDI values obtained for the indices behave (Table 4), the indices with values further from 100 (showing the greatest differences in the cranium shape) are mainly those which involve the bizygomatic width. This indicates that male and female crania are different in size and shape. Female faces are taller and narrower than male because male faces are wider. The ratio of minimum frontal width/bizygomatic width is higher in females because in males the bizygomatic width is much greater. This also means that the bizygomatic width/maximum cranium width ratio is higher in males. Another index that showed high sexual dimorphism is the foramen magnum index (FMI-16/7); the foramen is wider in males.
| Index | Male series | Female series | P | SDIa | ||||
|---|---|---|---|---|---|---|---|---|
| N | x | σ | N | x | σ | |||
| CRI–8/1 | 40 | 73.07 | 3.03 | 38 | 74.97 | 4.29 | 0.026 | 97.46 |
| FPT–9/8 | 40 | 70.95 | 3.37 | 41 | 69.94 | 2.84 | 0.146 | 101.44 |
| FTI–9/10 | 40 | 84.57 | 3.72 | 41 | 83.16 | 3.32 | 0.075 | 101.69 |
| TIN–17/8 | 40 | 98.47 | 4.28 | 39 | 96.63 | 3.91 | 0.048 | 101.90 |
| VIN–17/1 | 40 | 71.89 | 3.03 | 37 | 72.41 | 3.50 | 0.493 | 99.28 |
| PTI–20/8 | 38 | 83.77 | 4.48 | 38 | 83.33 | 3.58 | 0.634 | 100.52 |
| PVI–20/1 | 38 | 61.16 | 2.58 | 36 | 62.15 | 2.89 | 0.125 | 98.40 |
| FSI–29/26 | 40 | 88.81 | 2.04 | 37 | 88.39 | 4.18 | 0.577 | 100.47 |
| PSI–30/27 | 41 | 89.97 | 1.98 | 40 | 88.65 | 4.32 | 0.473 | 101.49 |
| OSI–31/28 | 41 | 81.89 | 4.66 | 35 | 82.67 | 2.75 | 0.389 | 99.06 |
| FSA–26/25 | 38 | 34.04 | 2.55 | 39 | 35.02 | 4.43 | 0.240 | 97.20 |
| PSA–27/26 | 38 | 34.73 | 2.87 | 41 | 36.74 | 2.40 | 0.045 | 94.53 |
| OSA–28/25 | 37 | 31.95 | 2.15 | 38 | 31.29 | 4.67 | 0.682 | 102.10 |
| FMI–16/7 | 40 | 87.65 | 7.51 | 40 | 83.84 | 4.85 | 0.009 | 104.54 |
| PHI–17/23 | 40 | 25.65 | 0.99 | 36 | 25.63 | 0.94 | 0.933 | 100.08 |
| JFI–9/45 | 26 | 73.47 | 3.67 | 27 | 76.66 | 4.00 | 0.004 | 95.84 |
| SMI–48/46 | 31 | 67.17 | 5.21 | 25 | 69.23 | 4.79 | 0.134 | 97.02 |
| FSI–48/45 | 26 | 49.57 | 3.41 | 24 | 52.59 | 3.62 | 0.004 | 94.25 |
| NAI–54/55 | 33 | 53.17 | 6.09 | 31 | 52.41 | 3.14 | 0.545 | 101.45 |
| ORI–52/51 | 33 | 81.86 | 5.16 | 30 | 84.90 | 5.36 | 0.001 | 96.42 |
| NFV–55/48 | 32 | 76.29 | 7.17 | 28 | 74.89 | 3.98 | 0.361 | 101.87 |
| PAI–63/62 | 30 | 79.59 | 9.33 | 31 | 79.24 | 8.95 | 0.880 | 100.44 |
| JMI–46/45 | 26 | 73.86 | 4.01 | 23 | 75.77 | 3.49 | 0.085 | 97.48 |
| OFT–51/45 | 29 | 31.59 | 1.98 | 22 | 31.86 | 1.56 | 0.265 | 99.15 |
| OFV–52/48 | 32 | 50.39 | 4.27 | 28 | 53.03 | 5.10 | 0.034 | 95.02 |
| IOI–50/44 | 31 | 21.09 | 1.60 | 26 | 21.50 | 1.85 | 0.379 | 98.09 |
| MAI–61/60 | 32 | 115.33 | 11.08 | 30 | 112.31 | 11.19 | 0.328 | 102.69 |
| PFT–61/45 | 26 | 47.16 | 2.98 | 25 | 47.19 | 4.26 | 0.595 | 99.94 |
| PFL–60/40 | 32 | 56.24 | 4.08 | 30 | 55.86 | 2.25 | 0.564 | 100.68 |
| GNI–40/5 | 34 | 94.17 | 7.37 | 30 | 93.85 | 7.39 | 0.875 | 100.34 |
| CFT–45/8 | 26 | 96.27 | 2.99 | 27 | 90.82 | 3.14 | <0.001 | 106.00 |
The use of the SDI only shows the difference of a value in one sex with respect to the other but does not indicate if the differences are significant enough to consider the variable as dimorphic because it does not include the internal variability of the data (Marini et al., 1999). For this reason, a Student’s t-test was applied. The results indicate statistical differences (P < 0.05) in almost all of the variables of the neurocranium; only the maximum width of the forehead (XFB10) is similar between the crania classified as female and male. On the other hand, the dimensions related to the orbits (DKB50, OBB51, OBH52), as well as the length of the nasal bones (NBH56), the minimum width of the nose (WNB57), and the angle of the face (WFA) that measures prognathism, do not show dimorphic power in the analyzed crania. Few indices reveal significant differences between sexes (CRI8/1, TIN17/8, PSA27/26, FMI16/7, JFI9/45, FSI48/45, NAI52/51, OFV52/48) (P < 0.05), and the greatest differences are found in the craniofacial index (CFT45/8) with higher values in the male cranium (P < 0.001).
These results show that there are no important differences in shape in terms of prognathism, the relationship between the height and width of the cranium, between the height and length of the cranium, the shape of the forehead, and the shape of the palate and nose (although there are differences in the size of the latter). There is greater dimorphism in the relationship between the length and width of the cranium, the protrusion of the frontal and parietal bones, the height of the face, and, above all, in the proportion of the face with respect to the width of the cheekbones, which is much wider in males than in females where it is more elongated. In addition, the shape of the foramen magnum is more elongated in females and more rounded in males.
The dimensions that show statistically significant differences according to sex were included in the discriminant analysis except for the indices as they duplicate the information of the variables. Table 5 shows the results of the applied discriminant analysis. The first function (F1) was obtained from the dimensions of the entire cranium, functions F2 and F3 were created from the variables of the neurocranium, and functions F4 and F5 were created from the measurements of the splanchnocranium. In all cases, a high F value was obtained (P < 0.001) and all models were significant (P < 0.001), which supports the view that the selected variables adequately discriminate between sexes. The cross-validation method showed that the models generated generally offer acceptable levels of classification (Rogers, 1999) for both sexes. However, it is important to note that for functions F1, F2, and F3, the highest percentages are obtained for the female sex, while the functions created for the splanchnocranium classify the male sex better, once again mainly due to the variable bizygomatic width. These differences in appropriate classification percentages based on the region of the cranium being addressed could indicate that the variables chosen in each function are the most representative for one sex. For example, the variables included in F1, F2, and F3 are more representative for the female sex and as such, they classify females better, leaving more males in overlapping or uncertain distributions.
| Variable | F1 | F2 | F3 | F4 | F5 |
|---|---|---|---|---|---|
| BPB | −0.022 | ||||
| FRC29 | 0.106 | ||||
| FOB16 | 0.25 | 0.231 | |||
| BBH17 | 0.09 | 0.085 | |||
| MDH19a | 0.109 | 0.127 | |||
| HPE23 | 0.04 | ||||
| GIL2 | 0.078 | ||||
| UFB43 | 0.218 | 0.201 | |||
| ZYB45 | 0.192 | 0.236 | 0.178 | ||
| MAL60 | 0.188 | ||||
| CTE | −55.887 | −42.828 | −35.265 | −39.719 | −42.988 |
| Classification percentage | 88.2 | 97.1 | 94.3 | 72.1 | 88.5 |
| Female | 83.7 | 97.1 | 90.5 | 69.8 | 81.4 |
| Classification percentage | 85.4 | 84.2 | 81.6 | 97.6 | 92.3 |
| Male | 82.9 | 81.6 | 80.3 | 90.5 | 85.4 |
| Classification percentage | 84.5 | 90.4 | 88.0 | 84.8 | 90.4 |
| Total | 83.3 | 89.0 | 84.5 | 80.1 | 88.3 |
BPB, biporion breadth; FRC29, nasion–bregma chord; FOB16, foramen magnum breadth; BBH17, basi-bregmatic height; MDH19a, mastoid height; HPE23, horizontal perimeter; GIL2, glabella–inion length; UFB43, outer bi-orbital breadth; ZYB45, bizygomatic breadth; MAL60, maxilloalveolar length.
In the case of F1 (Table 5), the variables that summarized the variability between sexes were the external biorbital width (UFB43), bizygomatic width (ZYB45), porion–porion distance (BPB), and the nasion–bregma chord (FRC29). F2 has been created using the width of the foramen magnum (FOB16), the height of the mastoid process (MDH19a), the basion–bregma length (BBH17), and the horizontal perimeter (HE23). Since this last variable is often impossible to measure, a second function (F3) was created for the neuro-cranium. In this case, the variables FOB16, MDH19a, and BBH17 were maintained, and the glabella–inion length was added. The functions created for the splanchnocranium only include two variables. In the case of F4, the most discriminating variable is bizygomatic width (ZYB45) followed by the length of the internal palate (MAL60), while in F5, external biorbital width (UFB43) follows bizygomatic width.
The pelvis and cranium are recognized and accepted to be the most dimorphic parts of the skeleton (Krogman, 1962; Ferembach et al., 1980; Bruzek, 2002; Scheuer, 2002; Rosing et al., 2007). Each have different degrees of accuracy in estimating sex depending on the state of preservation, the specific method used, and the experience of the researcher, reaching up to 98% reliability in some instances (Bruzek, 2002). The degree of sexual dimorphism of the cranium is specific to each population (Vioarsdottir et al., 2002) and depends on the influence of genetic and socioeconomic factors, eating habits, habitual physical activity, and the cultural customs of the group being studied (Cox and Mays, 2000; Kemkes and Gobel, 2006; Klepinger, 2006; Suazo Galdames et al., 2008; Saini et al., 2011).
Although the idea of a certain degree of cranial plasticity in response to environmental stimuli has been fully accepted over many decades (Boas, 1940; Smith et al., 1986; Cameron et al., 1990; Joy et al., 2009), this adaptability is considered more labile than achieved stature and other body dimensions (Steyn and Iscan, 1997; Jantz and Meadows, 2000). Sexual dimorphism of the crania becomes increasingly evident as the skeleton grows during adolescence and becomes marked starting at the age of 14 (Saini et al., 2011). In females, growth concludes at about 15 years of age, while in males it extends into early adulthood (Enlow, 1968; Bulygina et al., 2006). On the other hand, females are known to be more eco-stable than males, favoring the existence of greater differences between the sexes. These differences allow for a better classification of one sex or the other according to the variables included in the discriminant function applied (Suazo Galdames et al., 2008).
Regarding the metric variables explored for the neurocranium, the SDI values indicated that male crania have higher values than female ones. The highest figures were found in the variables associated with the mastoid process, the foramen magnum, and the occipital region, with the width of the foramen and the height of the mastoid processes appearing to be the variables of greatest discriminatory power between the sexes. The differences found in the occipital region could be due to the presence of bone projections at the inion, which is characteristic of the male cranium (Ferembach et al., 1980) and makes the occipital topography more irregular. These regions of the neurocranium have been extensively studied by various authors with the mastoid process being considered one of the most dimorphic parts of the skull (Krogman, 1962; Ferembach et al., 1980; Cuhna and Van Vark, 1991; De Paiva and Segre, 2003). Indeed, the size of the mastoid has been classified as the most reliable characteristic (92% minimum reliability) with the least intraobserver error in classification of dimorphic variables on crania of known sex and age (Williams and Rogers, 2006).
The region of the foramen is of great interest as a dimorphic zone. Its anatomic position, the robustness of the area which is modulated by the traction force of large muscles and the weight of the brain, and its endochondral origin guarantee great resistance to mechanical loads and taphonomic factors, which, in turn, results in high durability (Campos Varela, 2017; Gargi et al., 2018).
Research into childhood and adolescent skeletal development has shown that the foramen magnum reaches its adult length at approximately 5 years of age while the width continues to increase until age 10, beyond which point there are no significant changes (Toneva et al., 2018). Therefore, the length of the foramen magnum is one of the cranial characters with the greatest dimorphism marked by genetic elements and with the least environmental influence. Several researchers studying various populations have shown that the variables of the foramen magnum have a high discriminatory power between male and female crania (Ferrario et al., 1993; Suazo Galdames et al., 2009; Abdel-Karim et al., 2015; Toneva et al., 2018; Abo El-Atta et al., 2020). In this case, the differences are mainly found in width rather than in length, indicating a significant difference in development between the 5th and 10th years of life, less so than in the first 5 years of life.
Development of the facial bones is not generally uniform, implying an interrelationship between all parts from which it is formed (Kemkes and Gobel, 2006). During growth, the upper part of the face (orbital zone) is the first region to reach its final size, making this area less dimorphic. In this sample, the SDI of orbital width and height are very low. On the other hand, the nasal and maxillary zones continue to grow over a longer period, resulting in greater sexual dimorphism (Ferrario et al., 1993). In the set of crania in this study, the palatal region of the maxilla turned out to be a very dimorphic area of the facial skeleton with the values of all variables greater in males. Although some authors consider the size and shape of the palate to be among the criteria with the least precision and reliability in sex determination (Rogers, 2005; Williams and Rogers, 2006), it was determined to be a region with high SDI values in this sample; the length of the external palate, along with the bizygomatic and external biorbital widths, were the most dimorphic variables of the facial skeleton. The size of the nose is also much larger in males, with high SDI in both height and width.
In the present study, the areas that complete their growth later are the most dimorphic, while those that reach their final size before and during childhood show less difference between sexes, both in the splanchnocranium and in the neurocranium. In concordance with authors such as Schultz (1962), regions of earlier growth present less sexual dimorphism than those that finish their growth later.
In the current set of crania, the degree of dimorphism in the bizygomatic amplitude is notably higher than that which has been established in studies of other populations: Granada, Spain (SXIX): 105.79; Coimbra, Portugal (S XIX): 104.86; Cuellar, Spain (S. XIV): 105.87 (Amores Ampuero, 2013; Herrerín and Carmenate, 2020). This variable has been recognized as one of the most dimorphic parameters of the facial skeleton regardless of the population in question (Rogers, 2005; Rosique et al., 2005; Williams and Rogers, 2006; Zavando Matamala et al., 2009). The longer growth period in the male skull results in the larger size of the zygomatic bone, which causes a lateral displacement of the zygomatic arches, compared to females (Hoyme and Iscan 1989; Williams and Rogers 2006). This in turn gives rise to a wider face in males, which is associated with greater robustness.
The analysis by regions (neurocranium/splanchnocranium) indicates a greater degree of sexual dimorphism in the neurocranial region than in the facial region. The discriminant functions created for this area maintain similar percentages of correct classification compared with the percentages extracted from functions of both areas together. In addition, the bizygomatic width and external bi-orbital variables are maintained as very dimorphic in the function created for the splanchnocranium. However, new variables for the neurocranial region, which have a greater dimorphic power than those selected for the function of the cranium, have been identified. In a similar analysis, Amores Ampuero (2013) reported the same result and attributed it to changes in the information provided by the variables when they are studied together rather than evaluated separately. This may be an expression of the variability in different responses of each of these regions to environmental factors (Pérez and Monteiro, 2009).
Among the cultural practices that may have modulated the degree of sexual dimorphism in this sample is the act of mastication. Diet has been described as an environmental element that modulates craniofacial development by conditioning mechanical force in the masticatory cycles (Paschetta et al., 2016). Other specific habits, such as the use of teeth as work tools or as a ‘third hand,’ have been documented since the beginning of human evolution (Lalueza Fox, 1992; Bermúdez de Castro and Arsuaga, 1983; Hlusko, 2003). This behavior has even been observed in present-day Inuit populations (Turner and Cadien, 1969) and Australian aborigines (Barrett, 1977) who show a differential use of the masticatory apparatus between the sexes. However, there is no specific evidence at hand suggesting such masticatory differences in this sample.
Systematic activities, such as carrying weight on the head, may cause alterations in the region of the occipital condyles. This may be the explanation for the high rate of osteoarthritis observed in the occipital condyles in the current study (93% of the male crania and 86% of the female crania showed signs of this pathology). The similarity between the sexes suggests that the habit of carrying weight on the head must have been very similar in males and females. Signs of arthritis or chronic mechanical irritation have been associated with postures that involve pressure on the occipital condyle area such as carrying loads on the head or systematic head movements (Robles, 1997; Rihuete, 2003; Boleaga-Durán et al., 2006; Baxarias and Herrerín, 2008; Yoldi Muñoz et al., 2009; De Miguel et al., 2019).
Likewise, these activities could be the conditioning factors for the greater development of the inion and mastoid processes in male crania and to a lesser, although still important, degree in the female crania. These are areas of muscle insertion which maintain the head upright and permit lateral movements of the neck.
The sexual dimorphism found in this study indicates that the male cranium is larger than the female cranium in all variables except the minimum width of the nasal bones. In the neurocranium, the most dimorphic variables were found to be related to the mastoid process, the foramen magnum, and the occipital arch. The mastoid processes and occipital region are the areas where the cranium connects to the muscles, which keep the head upright and allow tilt and rotation movements in relation to the trunk. The sexual dimorphism and high rate of osteoarthrosis observed in the occipital condyles could indicate significant daily use of the head for carrying heavy loads. This was likely a common task for both sexes, although slightly higher rates of pathology in males suggest their work would have been more demanding. This high frequency of osteoarthritis in the occipital condyles is quite unusual because the atlanto-occipital joint is very stable. However, it has been detected in Egyptian samples of a similar chronology (Onstine et al., 2021), although mostly in females. In our sample, it was frequently found in both sexes, which would indicate different demands placed upon the samples of both studies.
Important indices of sexual dimorphism were found in the dimensions of the palate, bizygomatic width, and the external biorbital width, the last two of which were the most dimorphic variables of the facial region. The high SDI of the face width is justified by a greater convexity of the zygomatic arch. This may be related to a hypertrophy of the temporal muscle which could have occupied a greater volume compared to its normal size. In males, a greater robustness of the zygomatic arch where the masseter muscle is inserted has been noted. In the current study, this is represented in the larger values of facial width in the males with respect to the values of the females. In addition to a genetic component, the width of the zygomatic arch, its robustness, and the resulting degree of sexual dimorphism may be due to dietary and/or cultural habits related to chewing and the use of the mouth as a tool. Anthropological and paleontological studies indicate that the shape of the structures intimately related to mastication are directly affected by the type of food (whether it is harder or softer when processed) and any cultural practices that may cause an overuse of the masticatory apparatus. The impact is especially pronounced on areas related to the insertion of the temporalis muscle, the zygomatic arch (insertion site of the masseter) and the palate (Paschetta et al, 2009).
The discriminant functions obtained in this study summarize the variability of each sex, are highly reliable for sex estimation in this sample, and could be used in samples of similar ancestry and chronology for the estimation of sex where this is otherwise unknown.
The sexual dimorphism observed in this sample can be related to the living conditions and habits of the group. From the results obtained, environmental pressures increase the metric differences between the sexes. In this case, the greatest differences in size and shape seem to be formed in the final years of growth when the differences in social roles between males and females are beginning to be more pronounced.
The authors declare that there is no conflict of interest.
Jesús Herrerín: Conceptualization and design, methodology; data collection, data analysis and interpretation, writing original draft; writing review and editing.
M. Margarita Carmenate: Conceptualization and design, methodology; data analysis and interpretation, writing original draft; writing review and editing.