Abstract
Adult individuals from the Jomon period are known to have upper- and lower-limb skeletons characterized by relatively longer distal segments (radius and tibia) than their proximal counterparts (humerus and femur, respectively), in contrast to later historical and modern Japanese individuals. However, it is currently unclear at what age the characteristics of Jomon limb segment proportions emerged and reached adult-equivalent levels. To address these issues, we compared representative intersegmental ratios of limb bone length (e.g. brachial index, crural index, and intermembral index) between Jomon and four other Japanese groups from fetal life to adolescence, and described the limb proportions and growth patterns characteristic of Jomon at different stages of growth. The specimens included humeri, radii, femora, and tibiae from 143 prehistoric Jomon, 22 protohistoric Yayoi, 79 medieval Kamakura-Muromachi, 76 early modern Edo, and 311 modern Japanese skeletons, ranging in estimated age from the fifth fetal month to 19 years. The results confirmed that fetal Jomon individuals had relatively longer distal segments than their proximal counterparts in both the upper- and lower-limb skeletons compared with modern Japanese individuals, and that the Jomon maintained their comparatively long forearm and lower leg bones from childhood through adolescence. Furthermore, for all chronological groups, including the Jomon, the respective distal/proximal ratios of the upper- and lower-limb skeletons reached adult equivalence at approximately 1.5 years of age and remained nearly constant throughout subsequent growth. These findings suggest that the elongated forearm and lower leg bones of the Jomon may be derived primarily from the morphogenetic pattern of the limb cartilage primordium during early development, and that group-specific limb proportion characteristics may be established by the first two years of life at the latest.
Introduction
For more than 150 years, scientists have studied the relationship between the body shapes of animals and their habitat/environment, primarily based on the classic ecogeographic ‘rules’ of Bergmann (1847) and Allen (1877). According to Bergmann’s rule, homeothermic animals at higher latitudes have larger and heavier bodies than the same and related species at lower latitudes. Similarly, Allen’s rule states that animals at higher latitudes have shorter body appendages (e.g. rostrum, ears, limbs, and tail) than those at lower latitudes. The most likely explanation for such latitudinal gradients is that animal bodies have adapted to balance their heat production and dissipation in response to habitat air temperature (Lewin, 2004). In particular, adaptation to higher (colder) latitudes is thought to involve lowering the ratio of body surface area to body volume, thereby reducing heat loss from the body surface and improving body heat retention (Futuyma, 1986; Ruff, 1991, 1994; Holliday, 1997).
Initially, anthropologists were reluctant to apply these rules to geographic variation in human body shape, but in the 1950s and 1960s they finally recognized the relationship to habitat air temperature (Lewin, 2004). Since then, many researchers have found that in modern and ancient populations, human body size (e.g. weight) and the degree of limb protrusion (e.g. the ratio of limb length to trunk size) are significantly correlated with temperature indicators such as mean annual temperature, latitude, and altitude (Schreider, 1975; Ruff, 1991, 1994, 2002; Holliday and Falsetti, 1995; Holliday, 1997; Katzmarzyk and Leonard, 1998; Tilkens et al., 2007; Tripathy and Gupta, 2007; Holliday and Hilton, 2010; Betti et al., 2015; García-Martínez et al., 2018; Wells et al., 2019; Pomeroy et al., 2021; Cho et al., 2022; Straight et al., 2022). In addition, since the 1980s, researchers have focused on the discovery that the relative length of the distal limb bone segment (radius and tibia) to its proximal counterpart (humerus and femur, respectively) varies significantly in response to habitat air temperature. For example, Homo neanderthalensis, a human species that lived in extremely cold Europe during the Paleolithic, had limb skeletons that were relatively shorter in the distal than in the proximal segment compared with those of African-derived Homo sapiens, such as Cro-Magnons (Trinkaus, 1981). Another well-known example is that modern hunter-gatherers in Arctic Alaska (Inuit) have short limbs overall, with particularly short distal segments, whereas modern hunter-gatherers in tropical Australia (Aborigines) have long limbs, with the distal segments being relatively longer than the proximal segments (Trinkaus, 1981; Yamaguchi, 1989). Typically, the ratio of radius length to humerus length (the brachial index) and the ratio of tibia length to femur length (the crural index) are both found to be smaller in cold-climate inhabitants and, conversely, greater in temperate and tropical natives, which is often interpreted as a physical adaptation consistent with Allen’s rule (Trinkaus, 1981; Ruff, 1994; Weinstein, 2005; Holliday and Hilton, 2010).
The Jomon, prehistoric (Neolithic) hunter-gatherers of the Japanese archipelago (c. 16000–2300 BP), were first identified in the early 20th century as having limb bone proportions different from those of modern humans (Koganei, 1917; Hasebe, 1920; Kiyono, 1929). Later, in the 1980s, Yamaguchi (1981, 1982a, 1982b, 1989) studied the morphological characteristics of Jomon bones throughout the body and found that their limb skeletons were relatively longer in the distal than in the proximal segments compared with Yayoi-period agricultural immigrants and modern Japanese. Globally, the Jomon exhibit significantly greater brachial and crural indices than most other human groups, with a brachial index nearly equal to those of modern tropical hunter-gatherers and late Paleolithic Homo sapiens, in part because of the short humerus. Yamaguchi (1989) compared the brachial and crural indices from the Honshu Island archaeological sites of Ebishima, Yoshigo, and Tsukumo (see Figure 1 for these site locations). The results showed that people in higher-latitude (more northern) Ebishima had relatively shorter distal limb bones than people in lower-latitude (more southern) Yoshigo and Tsukumo, suggesting a latitudinal gradient consistent with Allen’s rule.

Figure 1.
Geographical locations of the Jomon sites that yielded the non-adult skeletal remains used in this study: 1, Funadomari; 2, Takasago; 3, Irie; 4, Usumoshiri; 5, Motowanishi; 6, Usujiri B; 7, Ohora; 8, Miyano; 9, Nakazawahama; 10, Tagara; 11, Ebishima (Kaitori); 12, Kitasakai; 13, Numazu; 14, Satohama; 15, Sanganji; 16, Usuiso; 17, Yamazaki; 18, Kainohana; 19, Nakabyo; 20, Soya; 21, Ubayama; 22, Kusakariba; 23, Kasori; 24, Yahagi; 25, Daizenno-minami; 26, Kikumatenaga; 27, Saihiro; 28, Yamakura; 29, Chidorikubo; 30, Inariyama; 31, Yoshigo; 32, Ikawazu; 33, Hobi; 34, Hikosaki; 35, Tsukumo; 36, Taishaku-kannondo; 37, Einomaru; 38, Kanezaki (Kojo); 39, Sasai; and 40, Todoroki.
Since Yamaguchi, the limb bone proportions of the Jomon have been studied more thoroughly, with some key reports appearing in the last two decades in particular. For example, Fukase et al. (2012) compared Jomon brachial and crural indices across five different latitudinal regions and found no significant clines, as had been suggested by Yamaguchi (1989). Tahara and Kaifu (2015) showed that, contrary to popular belief, the ratio of limb bone length to trunk bone size in Jomon is more similar to that of temperate and subarctic individuals than to that of tropical individuals. Yamaguchi did not explain why the Jomon had longer distal limb bones, but some evolutionary scenarios have been proposed by other researchers. The Jomon limb bones were interpreted by Kato and Ogata (1989) as a functional adaptation to the hunter-gatherer lifestyle, which involved vigorous hunting of agile animals. Temple and colleagues suggested that the Jomon ancestors had limb skeletons that were relatively shorter in the distal than in the proximal segments in response to their cold habitat, but migrated to the warmer Japanese archipelago, resulting in a physical adaptation that involved relative lengthening of the distal segments (Temple et al., 2008, 2011; Temple and Matsumura, 2011). Anthropologists have recently noted relatively longer distal limb bones in infant and child Jomon skeletons, suggesting a strong genetic influence on the characteristics of Jomon limb segment proportions (Okazaki, 2009; Temple et al., 2011; Cowgill et al., 2012).
In our previous study (Mizushima and Hirata, 2020), we compared the intersegmental limb bone proportions of Jomon and modern Japanese individuals from fetal life to adolescence. The results showed that the Jomon had relatively longer distal segments at the fetal and infant stages and acquired adult-equivalent distal/proximal limb proportions at approximately 1.5 years of age. However, the sample size of Jomon specimens in our previous study was relatively small, and the comparative sample was limited to modern Japanese. Therefore, this paper aims to extend our previous research and provide a more comprehensive understanding of the significance of Jomon limb proportions. To achieve this, we increased the sample size of Jomon specimens and added new comparative samples. In this paper, we compare intersegmental ratios of limb bone length between Jomon and four other Japanese groups from fetal life to adolescence, and describe the limb proportions and growth patterns characteristic of Jomon at different stages of growth.
Materials and Methods
Bone samples
We used humeri, radii, femora, and tibiae from 143 prehistoric Jomon, 22 protohistoric Yayoi, 79 medieval Kamakura-Muromachi, 76 early modern Edo, and 311 modern Japanese skeletons from fetal life to adolescence. Most of the specimens were observed and measured by one of the authors (Mizushima), and the remaining data were obtained primarily from literature (Table 1). The Jomon skeletons are from 40 archaeological shellmound/cave sites distributed throughout the Japanese archipelago (Figure 1), primarily from the Middle to Final Jomon periods (c. 5500–2300 BP). One individual is from the Initial Jomon period (c. 12000–7000 BP) Taishaku-kannondo cave site, and three are from the Early Jomon period (c. 7000–5500 BP) Hikosaki shellmound site. The Yayoi sample comprises so-called ‘immigrant’ agricultural populations from Kyushu and western Honshu dated between c. 300 BCE to 300 CE. The Kamakura-Muromachi skeletons belong to the Japanese medieval period, about 1300 to 1500 CE. The Edo skeletons are from ordinary people who lived in Edo (now Tokyo) between about 1650 and 1700 CE. The ‘modern’ Japanese are from the osteological collections of anatomy departments, and were collected in the early 20th century.
Table 1.
Human limb bones from fetal life to adolescence used in this study
| Chronological group |
Collecting location |
No. of individuals |
No. of specimens |
Storage facility/literature source [no. of individuals] |
| Prefecture |
Site |
Humerus |
Radius |
Femur |
Tibia |
| Jomon (12000–2300 BP) |
Hokkaido |
Funadomari |
1 |
1 |
1 |
1 |
1 |
Okazaki (2009) |
|
Irie |
1 |
1 |
1 |
1 |
1 |
Okazaki (2009) |
|
Motowanishi |
1 |
1 |
0 |
1 |
1 |
UMUT |
|
Takasago |
4 |
3 |
1 |
4 |
4 |
Okazaki (2009) |
|
Usujiri B |
1 |
1 |
1 |
1 |
0 |
Okazaki (2009) |
|
Usumoshiri |
3 |
3 |
1 |
3 |
3 |
Okazaki (2009) |
| Iwate |
Ebishima (Kaitori) |
3 |
3 |
3 |
3 |
3 |
NMNS [2], Okazaki (2009) [1] |
|
Miyano |
2 |
2 |
2 |
2 |
2 |
NMNS |
|
Nakazawahama |
7 |
5 |
5 |
6 |
5 |
TUSM [4], UMUT [3] |
|
Ohora |
5 |
5 |
5 |
5 |
5 |
UMUT |
| Miyagi |
Kitasakai |
1 |
0 |
1 |
1 |
1 |
UMUT |
|
Numazu |
4 |
3 |
2 |
4 |
4 |
UMUT |
|
Satohama |
2 |
1 |
1 |
2 |
2 |
TUSM [1], UMUT [1] |
|
Tagara |
9 |
8 |
8 |
8 |
8 |
Dodo and Suzuki (1986) [8], Okazaki (2009) [1] |
| Fukushima |
Sanganji |
2 |
2 |
1 |
2 |
2 |
UMUT |
|
Usuiso |
1 |
1 |
1 |
1 |
1 |
Baba et al. (1987) |
| Chiba |
Daizenno-minami |
5 |
5 |
4 |
5 |
2 |
unpublished data provided by Dr. Junmei Sawada |
|
Kainohana |
2 |
2 |
1 |
1 |
1 |
Okazaki (2009) |
|
Kasori |
4 |
2 |
3 |
3 |
4 |
UMUT [2], NMNS [1], Okazaki (2009) [1] |
|
Kikumatenaga |
1 |
1 |
0 |
1 |
0 |
StMUSM |
|
Kusakariba |
2 |
2 |
1 |
2 |
2 |
NMNS |
|
Nakabyo |
2 |
0 |
2 |
2 |
2 |
Okazaki (2009) |
|
Saihiro |
2 |
2 |
2 |
2 |
2 |
StMUSM |
|
Soya |
1 |
1 |
0 |
1 |
0 |
UMUT |
|
Ubayama |
6 |
6 |
5 |
5 |
6 |
UMUT |
|
Yahagi |
1 |
1 |
1 |
1 |
1 |
UMUT |
|
Yamakura |
1 |
1 |
1 |
1 |
1 |
Okazaki (2009) |
|
Yamazaki |
1 |
1 |
0 |
1 |
0 |
UMUT |
| Tokyo |
Chidorikubo |
1 |
1 |
0 |
1 |
1 |
UMUT |
| Aichi |
Hobi |
6 |
4 |
4 |
6 |
6 |
UMUT |
|
Ikawazu |
12 |
10 |
7 |
10 |
9 |
TMM [7], NMNS [5] |
|
Inariyama |
3 |
2 |
2 |
2 |
2 |
UMUT [1], Kajigayama and Baba (2002) [1], Okazaki (2009) [1] |
|
Yoshigo |
29 |
22 |
23 |
28 |
25 |
LPAKU [26], TMM [3] |
| Okayama |
Hikosaki |
3 |
3 |
2 |
3 |
3 |
NMNS |
|
Tsukumo |
9 |
7 |
4 |
9 |
8 |
LPAKU [7], UMUT [2] |
| Hiroshima |
Taishaku-kannondo |
1 |
0 |
1 |
1 |
1 |
UMUT |
| Fukuoka |
Einomaru |
1 |
1 |
1 |
0 |
1 |
KUM |
|
Kanezaki (Kojo) |
1 |
0 |
0 |
1 |
1 |
KUM |
|
Sasai |
1 |
1 |
0 |
1 |
1 |
Okazaki (2009) |
| Kumamoto |
Todoroki |
1 |
1 |
1 |
0 |
1 |
Okazaki (2009) |
|
Total |
143 |
116 |
99 |
132 |
123 |
|
| Yayoi (300 BCE–300 CE) |
Shimane |
Koura |
6 |
6 |
4 |
6 |
5 |
KUM |
| Yamaguchi |
Doigahama |
6 |
6 |
4 |
6 |
3 |
KUM |
|
Nakanohama |
1 |
0 |
0 |
1 |
1 |
KUM |
| Fukuoka |
Dojoyama |
1 |
0 |
1 |
0 |
1 |
Okazaki (2009) |
|
Kanenokuma |
2 |
0 |
0 |
2 |
2 |
KUM |
|
Tsukasaki-higashihata |
2 |
2 |
2 |
2 |
2 |
KUM |
|
Yokokuma-kitsunezuka |
1 |
0 |
0 |
1 |
1 |
Wakebe (1985) |
|
Yoshigaura |
2 |
0 |
2 |
1 |
2 |
KUM [1], Okazaki (2009) [1] |
| Kumamoto |
Donoue |
1 |
1 |
0 |
1 |
1 |
KUM |
|
Total |
22 |
15 |
13 |
20 |
18 |
|
| Kamakura-Muromachi (1300–1500 CE) |
Kanagawa |
Chusei-shudan-bochi |
3 |
3 |
2 |
3 |
2 |
StMUSM |
|
Seiyokan |
1 |
1 |
1 |
0 |
1 |
StMUSM |
|
Yuigahama-minami |
62 |
56 |
52 |
51 |
44 |
StMUSM |
| Yamaguchi |
Yoshimohama |
13 |
11 |
11 |
10 |
10 |
Okazaki (2009) |
|
Total |
79 |
71 |
66 |
64 |
57 |
|
| Edo (1650–1700 CE) |
Tokyo |
Hitotsubashi high school |
76 |
65 |
47 |
66 |
56 |
StMUSM |
|
Total |
76 |
65 |
47 |
66 |
56 |
|
| Modern Japanese (1900–1950 CE) |
Tohoku region |
|
150 |
149 |
149 |
149 |
148 |
TUSM [148], Okazaki (2009) [2] |
| Kanto region |
|
142 |
136 |
134 |
142 |
140 |
UMUT |
| Kinai region |
|
9 |
8 |
9 |
9 |
9 |
Okazaki (2009) |
| Kyushu region |
|
10 |
9 |
9 |
10 |
10 |
KUM |
|
Total |
311 |
302 |
301 |
310 |
307 |
|
Abbreviations: UMUT, The University Museum, The University of Tokyo; NMNS, National Museum of Nature and Science; TUSM, Tohoku University School of Medicine; StMUSM, St. Marianna University School of Medicine; TMM, Tahara Municipal Museum; LPAKU, Laboratory of Physical Anthropology, Kyoto University; and KUM, The Kyushu University Museum.
The sexes of all individuals from the Jomon, Yayoi, Kamakura-Muromachi, and Edo groups are unknown, whereas the modern Japanese sample was of mixed sex, consisting of 155 males, 108 females, and 48 unknowns, according to documentary sources. The following limb bones were selected for measurement: (1) those with both proximal and distal epiphyses completely unfused; (2) those with one end completely unfused and the other partially or completely fused; and (3) those with one end partially fused and the other partially or completely fused. The right side was examined, but the left side was used if the right side was broken or missing. Specimens with obvious deformities and pathological features were excluded. The developmental ages for these specimens were estimated to range from the fifth fetal month to 19 years of age, by comparison with the limb bone lengths of modern Japanese fetuses of known gestational age (Takata, 1922) and the time of fusion of the epiphyses (Krogman, 1962).
Measurements
Limb diaphyseal length was measured along the long axis of the diaphysis using either a caliper or an osteometric board. Based on longitudinal radiographic data from modern European Americans (Maresh, 1970), the ratio of diaphyseal length to total limb bone length was estimated to be 0.93 for the humerus, 0.93 for the radius, 0.91 for the femur, and 0.88 for the tibia (data at 12 years of age). Thus, in the present study, the diaphyseal length of a specimen with both ends fused was determined by multiplying the measured length (including both epiphyses) by the above Maresh ratio. For specimens with one end fused and the other end unfused, the measured length (including one of the epiphyses) was multiplied by 0.96 for the humerus, 0.96 for the radius, 0.95 for the femur, and 0.94 for the tibia to determine the diaphyseal length, assuming equivalent length contributions from the proximal and distal epiphyses. The diaphyseal lengths of the humerus, radius, femur, and tibia are abbreviated to HL, RL, FL, and TL, respectively. The following five proportional indices were calculated for each individual: brachial index, 100 × RL ÷ HL; crural index, 100 × TL ÷ FL; humerofemoral index, 100 × HL ÷ FL; radiotibial index, 100 × RL ÷ TL; and intermembral index, 100 × (HL + RL) ÷ (FL + TL).
Data analysis and statistics
Modern humans acquire upright bipedal locomotion between the ninth postnatal month and 1.5 years of age (Yaguramaki and Kimura, 2002). In addition, a somatic growth spurt typically begins at 10 years of age in females and 12 years of age in males (Sinclair and Dangerfield, 1998). Given these significant developmental patterns and events, we divided our specimens into the following three age groups: fetal life and infancy, aged <1.5 years, referred to as FET-INF; childhood, aged 1.5–10 years, referred to as CHILD; and adolescence, aged >10 years, referred to as ADOLESC.
Limb bone length during growth exhibits a strong positive correlation with age (Anderson et al., 1964; Maresh, 1970; Gindhart, 1973; Fazekas and Kósa, 1978; Scheuer et al., 1980; Jeanty, 1983; Chitty and Altman, 2002); thus, we can assume that the variables HL, RL, FL, and TL also reflect well the age at death of each individual. In our study, to compare the Jomon and other chronological groups at equivalent growth times, a relative age proxy common to all individuals (referred to as the geometric mean ratio, GMratio) was established using HL, RL, FL, and TL. The GMratio was calculated as follows. (1) For each non-adult individual, the geometric mean corresponding to each proportional index was calculated as, for example, √(HL × RL) for the brachial index, √(FL × TL) for the crural index, and 4√(HL × RL × FL × TL) for the intermembral index. (2) For each chronological group, the mean maximum lengths of the humerus, radius, femur, and tibia of adults (mean of males and females) were determined from the literature (see Appendix). Using these measurements, the geometric mean was calculated as in step (1), e.g. √(maximum humerus length × maximum radius length) for the brachial index. (3) The non-adult geometric mean was divided by the adult geometric mean of the same type to obtain the GMratio.
The GMratio is only a surrogate indicator of growth based on limb bone length. The correspondence between GMratio and age is unknown for the present study groups, so we cannot use GMratio values to indicate specific growth points, such as 1.5 and 10 years of age. To avoid this problem, we calculated the GMratio for a population in which the correspondence between limb bone length and age had already been established, and then applied these reference values to the present study groups. GMratio values at 1.5 and 10 years of age were determined as the geometric mean of the mean diaphyseal lengths at 1.5 and 10 years of age, respectively, divided by the geometric mean of the mean maximum lengths at 17 years of age, based on European-American data (Maresh, 1970). In addition, GMratio values at birth were obtained by dividing the geometric mean of the mean diaphyseal lengths of Japanese newborns (Takata, 1922) by the geometric mean of the mean maximum lengths of Japanese adults (Miyamoto, 1925; Hirai and Tabata, 1928). These reference values are summarized in the Appendix.
Differences between groups were assessed using the separate-variance t-test (Welch’s method). The significance of the correlation was assessed using Spearman’s correlation coefficients (not performed for fewer than five individuals). In our previous study, we derived the regression line using the least-squares method (y on x). However, this method may not be appropriate when both x and y variables have intrinsic measurement errors, and outliers may strongly affect the regression line. To address this issue, we used reduced major axis regression, which accounts for measurement error in both the independent (GMratio) and dependent (proportional index) variables, to determine the slope and y-intercept of the regression line. Reduced major axis regression is considered more appropriate for the present comparative analysis because it produces a line that is identical to the long axis of the data distribution. All statistics were performed using SYSTAT 13 software for Windows (SYSTAT Software, Inc.) and were considered significant when P < 0.05.
Results
Ratio of forearm length to upper arm length
A scatter plot of the brachial index against the GMratio for individuals before birth is illustrated in Figure 2. Most of the Jomon values (31 out of 37, 84%) were well above the regression line obtained from the modern Japanese sample. This difference in distribution indicates that, even at the fetal stage, the Jomon had relatively longer forearms (radius) than upper arms (humerus) compared with modern Japanese people. There were too few Kamakura-Muromachi and Edo individuals (total n = 5) to examine the group differences with the Jomon. Unfortunately, no data were available for the Yayoi.

A scatter plot of the brachial index for the entire growth period is shown in Figure 3, and the basic statistics are summarized in Table 2. The growth patterns of all chronological groups except the Yayoi were similar, with the following four common points in particular: (1) fetuses have the greatest brachial index; (2) the ratio decreases rapidly from the FET-INF to the early CHILD periods (i.e. the humerus elongates faster than the radius); (3) the ratio reaches an adult-equivalent level around 1.5 years of age and transitions to a plateau; and (4) the adult-equivalent ratio remains nearly constant or increases slightly throughout the CHILD and ADOLESC periods (i.e. the humerus and radius elongate at the same rate, or the radius appears to elongate slightly faster). These similarities indicate that the Jomon elongated their upper-limb skeletons following almost the same pattern as later Japanese people throughout growth. Regarding point (4), the brachial index of the combined CHILD–ADOLESC Jomon was significantly greater than those of all other Japanese samples in the same growth period (P < 0.001). This significant group difference indicates that the Jomon consistently had a longer forearm from childhood to adolescence, carrying over the fetal proportion characteristic. Note that the Yayoi were few in number (n = 10), making it difficult to fully examine the growth pattern, but the scatter plot seemed to indicate acquisition of the adult-equivalent proportion at around 1.5 years of age.

Table 2.
Basic statistics of the brachial index for each age group
| Chronological group |
FET-INF |
|
CHILD |
|
ADOLESC |
FET-INF vs. CHILD |
FET-INF vs. ADOLESC |
CHILD vs. ADOLESC |
| n |
Mean |
SD |
r |
n |
Mean |
SD |
r |
n |
Mean |
SD |
r |
| Jomon |
39 |
83.2 |
2.0 |
–0.184 |
|
35 |
78.2 |
2.1 |
0.218 |
|
14 |
80.5 |
2.5 |
0.354 |
P < 0.001 |
P < 0.01 |
P < 0.01 |
| Yayoi |
3 |
79.1 |
3.4 |
NA |
|
6 |
78.3 |
2.4 |
0.543 |
|
1 |
75.6 |
- |
NA |
NS |
NA |
NA |
| Kamakura-Muromachi |
14 |
79.0 |
3.3 |
–0.525 |
|
41 |
75.7 |
2.8 |
–0.336 |
|
8 |
76.1 |
2.3 |
0.238 |
P < 0.01 |
P < 0.05 |
NS |
| Edo |
9 |
78.9 |
3.5 |
–0.683 |
|
22 |
73.1 |
2.5 |
–0.310 |
|
13 |
74.5 |
1.5 |
0.335 |
P < 0.01 |
P < 0.01 |
P < 0.05 |
| Modern Japanese |
248 |
81.3 |
2.6 |
–0.453 |
|
21 |
72.6 |
2.5 |
–0.138 |
|
27 |
74.7 |
2.1 |
0.220 |
P < 0.001 |
P < 0.001 |
P < 0.01 |
NA, not applicable; NS, not significant. Significant (P < 0.05) correlation coefficients are shown in bold type.
A scatter plot of the crural index against the GMratio for individuals before birth is provided in Figure 4. In this plot, the Jomon were generally shifted upward relative to the modern Japanese, with the majority (31 out of 47, 66%) distributed well above the regression line and the remainder concentrated just below it. This difference in distribution indicates that most Jomon fetuses had relatively more elongated lower legs, although the trend is not as pronounced as in the case of the forearm (Figure 2). The Kamakura-Muromachi and Edo individuals generally plotted high relative to the regression line, but were too few in number (total n = 7) to fully assess their similarity to the Jomon. No data were available for the Yayoi.
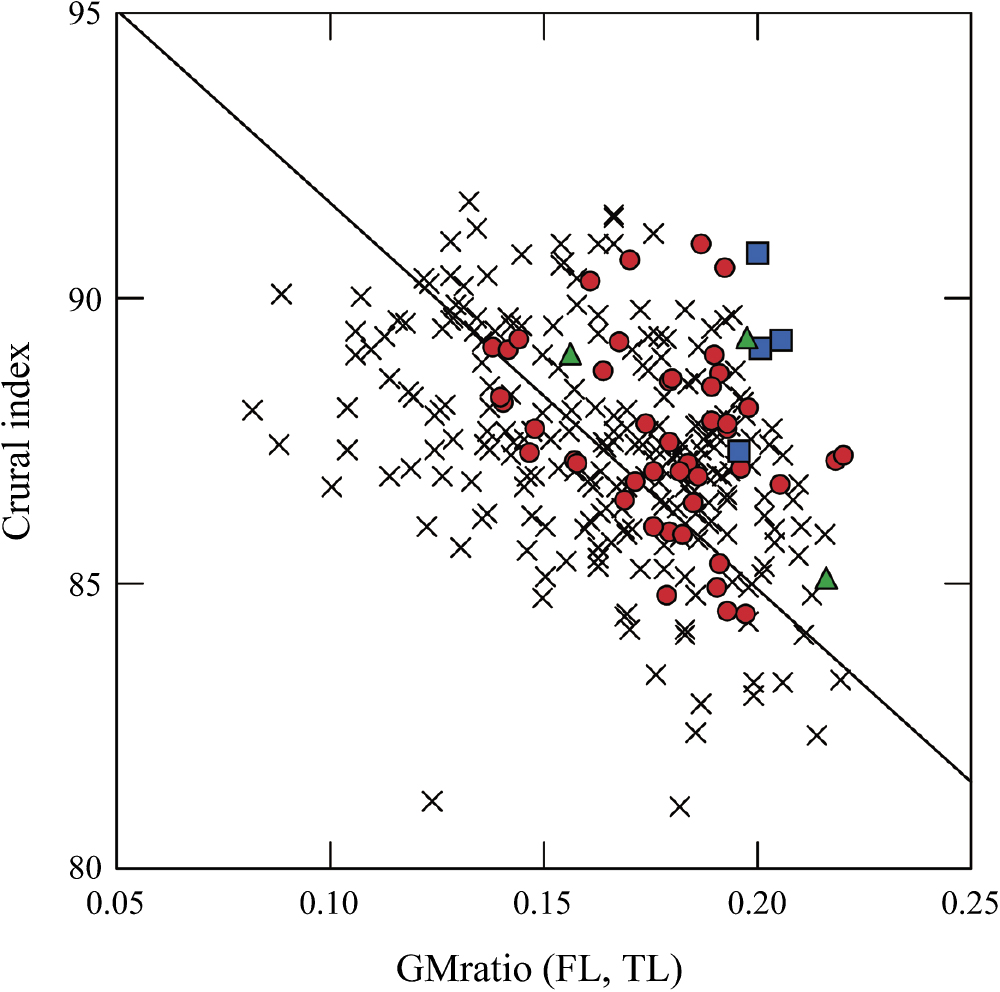
A scatter plot of the crural index for the entire growth period is shown in Figure 5, and the basic statistics are summarized in Table 3. The growth patterns of all chronological groups were generally quite similar, with the following four common points in particular: (1) fetuses have the greatest crural index; (2) the ratio decreases rapidly during the FET-INF to early CHILD periods (i.e. the femur elongates faster than the tibia); (3) the ratio reaches an adult-equivalent level at ~1.5 years of age and transitions to a plateau; and (4) the ratio remains nearly constant throughout the CHILD and ADOLESC periods (i.e. the femur and tibia elongate at the same rate). It is noteworthy that these growth patterns are almost identical to those of the brachial index, despite the different bone sites. Comparing the combined CHILD–ADOLESC Jomon with all other Japanese of the same growth period, we found significantly greater values for the Jomon (P < 0.001). This significant difference indicates that the Jomon maintained longer lower legs throughout childhood and adolescence, inherited from the fetal period.

Table 3.
Basic statistics of the crural index for each age group
| Chronological group |
FET-INF |
|
CHILD |
|
ADOLESC |
FET-INF vs. CHILD |
FET-INF vs. ADOLESC |
CHILD vs. ADOLESC |
| n |
Mean |
SD |
r |
n |
Mean |
SD |
r |
n |
Mean |
SD |
r |
| Jomon |
49 |
87.4 |
1.7 |
–0.364 |
|
52 |
81.5 |
1.8 |
–0.090 |
|
16 |
81.1 |
2.7 |
0.091 |
P < 0.001 |
P < 0.001 |
NS |
| Yayoi |
3 |
85.1 |
2.3 |
NA |
|
8 |
81.8 |
1.1 |
–0.310 |
|
5 |
79.1 |
2.8 |
0.800 |
NS |
P < 0.05 |
NS |
| Kamakura-Muromachi |
7 |
85.3 |
3.5 |
–0.643 |
|
32 |
80.4 |
2.2 |
–0.486 |
|
15 |
79.7 |
2.3 |
0.357 |
P < 0.05 |
P < 0.01 |
NS |
| Edo |
9 |
86.6 |
3.1 |
–0.733 |
|
30 |
79.6 |
2.1 |
–0.553 |
|
12 |
80.1 |
2.2 |
–0.084 |
P < 0.001 |
P < 0.001 |
NS |
| Modern Japanese |
254 |
86.9 |
2.6 |
–0.540 |
|
21 |
78.3 |
2.7 |
–0.001 |
|
32 |
79.1 |
2.1 |
–0.013 |
P < 0.001 |
P < 0.001 |
NS |
NA, not applicable; NS, not significant. Significant (P < 0.05) correlation coefficients are shown in bold type.
Scatter plots of the humerofemoral, radiotibial, and intermembral indices for individuals before birth are illustrated in Figure 6. For all indices, the Jomon were evenly distributed around the regression line of the modern Japanese data, so no distinct differences were observed between the two groups. This close similarity in distribution indicates that the Jomon fetuses had body proportions quite similar to those of modern Japanese people in terms of the ratio of upper-limb length to lower-limb length. The group differences between the Kamakura-Muromachi/Edo and the Jomon could not be determined because of the small number of individuals. No data were available for the Yayoi.

A scatter plot of the humerofemoral index for the entire growth period is provided in Figure 7 (see Appendix Figures 1 and 2 for the radiotibial and intermembral indices, respectively); the basic statistics are summarized in Table 4. For all indices, the ratio of upper-limb length to lower-limb length of the Jomon showed a growth pattern similar to that of the other four groups. The main similarities are as follows: (1) the ratio is greatest in the fetal period; (2) the ratio decreases rapidly from the FET-INF to the middle CHILD periods (i.e. lower-limb bones elongate faster than upper-limb bones); (3) the ratio reaches an adult-equivalent level at a GMratio of ~0.6 at the latest (estimated to correspond to 7 years of age) and transitions to a plateau; and (4) the adult-equivalent ratio is nearly constant throughout late childhood and adolescence (i.e. upper- and lower-limb bones elongate at the same rate). Among individuals with a GMratio greater than 0.6, the radiotibial index showed no significant difference between the Jomon and all other Japanese, whereas interestingly, both the humerofemoral and intermembral indices were found to be significantly smaller in the Jomon (Figure 8). For the humerofemoral index, given that there was no apparent group difference during the fetal period and a significant group difference from late childhood to adolescence, it is likely that the humeri of the Jomon were less elongated in infancy/early childhood.

Table 4.
Basic statistics of the humerofemoral, radiotibial, and intermembral indices for each age group
| Proportional index |
Chronological group |
FET-INF |
|
CHILD |
|
ADOLESC |
FET-INF vs. CHILD |
FET-INF vs. ADOLESC |
CHILD vs. ADOLESC |
| n |
Mean |
SD |
r |
n |
Mean |
SD |
r |
n |
Mean |
SD |
r |
| Humerofemoral index |
Jomon |
49 |
84.8 |
2.2 |
–0.456 |
|
44 |
71.7 |
3.0 |
–0.681 |
|
13 |
68.7 |
1.6 |
0.363 |
P < 0.001 |
P < 0.001 |
P < 0.001 |
| Yayoi |
5 |
81.5 |
1.5 |
0.500 |
|
8 |
73.7 |
2.0 |
–0.262 |
|
2 |
72.8 |
3.6 |
NA |
P < 0.001 |
NS |
NS |
| Kamakura-Muromachi |
10 |
82.2 |
3.7 |
–0.818 |
|
36 |
74.9 |
3.9 |
–0.812 |
|
11 |
69.7 |
4.7 |
0.127 |
P < 0.001 |
P < 0.001 |
P < 0.01 |
| Edo |
12 |
81.2 |
3.5 |
–0.615 |
|
35 |
76.1 |
3.2 |
–0.612 |
|
8 |
71.4 |
1.4 |
0.095 |
P < 0.001 |
P < 0.001 |
P < 0.001 |
| Modern Japanese |
251 |
86.8 |
3.7 |
–0.752 |
|
21 |
72.8 |
2.8 |
–0.497 |
|
29 |
72.2 |
2.0 |
0.441 |
P < 0.001 |
P < 0.001 |
NS |
| Radiotibial index |
Jomon |
35 |
81.0 |
2.5 |
–0.397 |
|
36 |
68.6 |
2.8 |
–0.782 |
|
16 |
67.8 |
3.1 |
0.206 |
P < 0.001 |
P < 0.001 |
NS |
| Yayoi |
2 |
76.7 |
2.8 |
NA |
|
6 |
71.0 |
3.8 |
–0.886 |
|
3 |
70.3 |
1.0 |
NA |
NS |
NS |
NS |
| Kamakura-Muromachi |
8 |
77.6 |
3.4 |
–0.762 |
|
30 |
70.2 |
3.7 |
–0.669 |
|
9 |
66.0 |
2.9 |
–0.033 |
P < 0.001 |
P < 0.001 |
P < 0.01 |
| Edo |
5 |
79.1 |
0.9 |
–0.500 |
|
20 |
68.6 |
3.2 |
–0.732 |
|
11 |
65.7 |
1.7 |
0.100 |
P < 0.001 |
P < 0.001 |
P < 0.01 |
| Modern Japanese |
247 |
81.3 |
3.7 |
–0.671 |
|
21 |
67.4 |
3.3 |
–0.673 |
|
30 |
68.2 |
2.5 |
0.538 |
P < 0.001 |
P < 0.001 |
NS |
| Intermembral index |
Jomon |
31 |
83.2 |
2.1 |
–0.516 |
|
29 |
69.8 |
2.5 |
–0.857 |
|
11 |
68.3 |
1.8 |
0.500 |
P < 0.001 |
P < 0.001 |
P < 0.05 |
| Yayoi |
2 |
79.5 |
2.4 |
NA |
|
5 |
73.2 |
4.1 |
–0.900 |
|
1 |
73.6 |
– |
NA |
NS |
NA |
NA |
| Kamakura-Muromachi |
8 |
80.2 |
3.5 |
–0.905 |
|
26 |
72.2 |
3.5 |
–0.760 |
|
8 |
68.8 |
2.0 |
0.190 |
P < 0.001 |
P < 0.001 |
P < 0.01 |
| Edo |
4 |
82.8 |
0.8 |
NA |
|
17 |
72.5 |
2.8 |
–0.831 |
|
7 |
68.7 |
1.4 |
0.107 |
P < 0.001 |
P < 0.001 |
P < 0.001 |
| Modern Japanese |
245 |
84.3 |
3.6 |
–0.757 |
|
20 |
70.1 |
2.6 |
–0.623 |
|
28 |
70.5 |
2.0 |
0.615 |
P < 0.001 |
P < 0.001 |
NS |
NA, not applicable; NS, not significant. Significant (P < 0.05) correlation coefficients are shown in bold type.

Discussion
Limb segment proportions in fetal life
Since the work of Yamaguchi (1981, 1982a, 1982b, 1989), anthropologists have confirmed that Jomon adults have relatively longer distal limb bones (radius and tibia) than their proximal counterparts (humerus and femur, respectively) compared with modern Japanese people (Kato and Ogata, 1989; Takigawa, 2005, 2006; Fukase et al., 2012). In the present study, both the brachial and crural indices of the Jomon tended to be greater than those of modern Japanese people at the fetal stage, consistent with the trend in adulthood. Furthermore, the greater brachial and crural indices of the Jomon were maintained from childhood to adolescence, strongly suggesting that their relatively longer forearm and lower leg bones were consistent morphological features throughout fetal life and adulthood. In our previous study, we suggested that the Jomon characteristic of relatively elongated lower legs would appear in early infancy, following the elongation of the forearms during fetal life. However, according to our current data, it is very likely that both features appeared during fetal development.
Regarding the evolution of human limb proportions, some have argued that the relative elongation of distal limb bones, especially the tibia, was an adaptation to rapid movement in hunter-gatherer behavior (Biasutti, 1951; Kato and Ogata, 1989), and that the shortening of distal limb bones was an adaptation to cold climates (Trinkaus, 1981). Our observations above could be interpreted as the result of these occupational/environmental adaptations. Regarding fetal limb proportions, the pioneering work of Schultz (1923, 1926) compared fetuses of European Americans and African Americans and showed that African American fetuses had relatively longer distal limb bones as early as the fourth fetal month, consistent with the trend in adulthood. More recent studies have suggested that genetic factors play a major role in determining the characteristics of limb proportions (Tanner et al., 1982; Holliday and Falsetti, 1995). For example, comparative animal experiments by Chiu and Hamrick (2002) have shown that the characteristic of autopodium proportion (e.g. the ratio of metapodium length to phalange length) is determined by the site of programmed cell death (apoptosis) during early development, suggesting that the limb segment proportions of each animal species are determined by a set of genes expressed during early developmental stages. In addition, based on advancements in developmental biology since the 1990s, Lovejoy and colleagues (Ohman and Lovejoy, 2001, 2003; Lovejoy et al., 2003) have proposed that the morphological characteristics of limb bones are largely determined by pattern formation based on positional information during early development and the shape of the later-formed cartilaginous growth plate. In light of these views, the elongated forearm and lower leg bones of Jomon fetuses may be derived from the morphogenetic pattern of the limb cartilage primordium during early development, such as the formation of longer cartilaginous limb primordia in the forearm and lower leg sites. Alternatively, the Jomon radius and tibia may have rapidly elongated during the first half of the fetal period, but we were unable to investigate this possibility since the specimens analyzed here are older than the fifth fetal month. Our hypothesis regarding limb cartilage primordia should be carefully examined in future studies.
Age of acquisition of adult-equivalent limb proportions
For all chronological groups, including the Jomon, both the brachial and crural indices reached adult equivalence at ~1.5 years of age and remained nearly constant, with some minor fluctuations, throughout subsequent growth. In our previous study, we found that the Jomon and modern Japanese individuals follow these growth patterns. The present study showed that Japanese individuals from other historical periods (protohistoric, medieval, and early modern) also share comparable growth patterns. At this point, the reader may wonder whether ancient and modern human populations in countries other than Japan also acquired/acquire adult-equivalent distal/proximal limb segment ratios as early as 1–2 years of age. To address this issue, we examined age-related changes in the brachial and crural indices for four additional groups from different periods, habitats, and occupations (19th-century Canadians, 20th-century European Americans, prehistoric Sudanese Nubians, and prehistoric Native Americans) based on measurements from the literature (Figure 9). For all groups, both the brachial and crural indices reached a plateau at 1–2 years of age and remained nearly constant during subsequent growth. Thus, it is likely that other human populations also acquire their adult-equivalent distal/proximal ratios at ~1.5 years of age. Although Homo sapiens may display a wide range of distal/proximal limb proportions resulting from adaptations to habitat climate and hunter-gatherer lifestyles (Biasutti, 1951; Trinkaus, 1981; Ruff, 1991, 1994), group-specific proportional characteristics appear to be established by the first two years of life at the latest.

In contrast, for the ratio of upper-limb length to lower-limb length, we found that all chronological groups from Japan continue to predominantly elongate the lower limbs relative to the upper limbs for a considerable time after birth, estimated in the present study to be up to ~7 years of age. Considering the evolutionary context, large- to medium-sized primates such as gorillas and baboons are known to have adult-equivalent upper-/lower-limb segment ratios at birth (Ruff, 2003; Ruff et al., 2013). In light of these observations, the predominance of lower-limb elongation until late childhood may be unique to humans among primates and could probably be considered a requirement for upright bipedalism (Kimura, 2002). The rapid elongation of lower limb bones observed from fetal life to late childhood is an interesting evolutionary/developmental phenomenon in humans, and further interspecies comparisons on this point are encouraged.
Why is the Jomon humerus so short?
Yamaguchi (1989) noted that adult Jomon people have a significantly shorter humerus than modern Japanese, which, combined with the elongated forearm bones, results in a forearm-dominant upper-limb skeleton. Takigawa (2006) provided detailed morphological data showing that Jomon males have short humeri and long forearm bones, whereas Jomon females have long forearm bones with humerus lengths comparable to those of modern Japanese females. Therefore, the forearm-dominant upper-limb proportion of the Jomon is commonly observed in both sexes because of the forearm bone, but is more pronounced in males as a result of the short humerus. In this regard, our significant finding is that the Jomon were less likely to elongate the humerus in infancy/early childhood, which may be related to the short humerus of adult Jomon males. However, it is difficult to definitively state what factors, such as genetics, hormones, and mechanical loading, caused site-specific growth retardation of the humerus in infancy/childhood. Due in part to the small number of infant-to-child Jomon specimens, we leave the question of specific factors as a topic for future research.
Latitudinal gradient of distal/proximal limb segment ratios
Yamaguchi (1989) compared brachial and crural indices of Jomon individuals between the Ebishima, Yoshigo, and Tsukumo archaeological sites and found that the distal segments of the upper- and lower-limb skeletons were relatively shorter in the higher-latitude (more northern) Ebishima people, suggesting a latitudinal gradient consistent with Allen’s rule. In contrast, Fukase et al. (2012) reported that the Jomon exhibited homogeneous distal/proximal limb segment ratios across the Japanese archipelago, suggesting no relationship with climatic factors such as habitat air temperature. Here, we investigate whether a latitudinal gradient in limb segment proportions consistent with Allen’s rule can be observed in the growing Jomon of the present study. Scatter plots of the brachial and crural indices against the latitude of the site location for Jomon aged 1.5 years and older are provided in Figure 10. Neither the brachial nor the crural indices showed significant correlations with latitude, supporting that the Jomon have homogeneous distal/proximal limb proportions regardless of habitat. The lack of a latitudinal gradient in limb segment proportions among the Jomon may suggest a lack of selective pressure from cold temperature to promote distal limb shortening during the Jomon period. This interpretation is consistent with the paleoclimatic evidence that a relatively warm climate has persisted throughout the Japanese archipelago since the Initial Jomon period (Fuji, 1966; Oshima, 1968; Yasuda, 1982; Kito et al., 1998). Alternatively, because limb segment proportions are strongly genetically regulated, as suggested by the present study, little morphological change may have occurred in a ‘short’ time, such as thousands of years, even if the Jomon inhabited a cold climatic environment. However, the absence of clear latitudinal gradient may be because of the paucity of the northernmost (Hokkaido) and southernmost (southern Kyushu and Okinawa islands) Jomon specimens in our sample, and this point should be examined in future studies.

Appendix
We determined the mean maximum limb bone lengths of adults from measurements of the following skeletal groups: Tsukumo people for Jomon (Kiyono and Hirai, 1928a, 1928b); Doigahama people for Yayoi (Department of Anatomy, Faculty of Medicine, Kyushu University, 1988); Yuigahama-minami people for Kamakura-Muromachi (Nagaoka et al., 2008); Hitotsubashi people for Edo (Morimoto et al., 1985); and Kinai people for modern Japanese (Miyamoto, 1925; Hirai and Tabata, 1928).
The reference values for the GMratio were as follows: GMratio for brachial index, 0.245 (age 0), 0.359 (age 1.5), and 0.723 (age 10); GMratio for crural index, 0.221 (age 0), 0.314 (age 1.5), and 0.711 (age 10); GMratio for humerofemoral index, 0.225 (age 0), 0.337 (age 1.5), and 0.722 (age 10); GMratio for radiotibial index: 0.241 (age 0), 0.335 (age 1.5), and 0.713 (age 10); and GMratio for intermembral index, 0.233 (age 0), 0.336 (age 1.5), and 0.717 (age 10).
Acknowledgments
We are grateful to the following individuals for allowing us to study the human skeletal collections in their care: Professor Gen Suwa, The University Museum, The University of Tokyo; Dr Reiko Kono, Laboratory of Anthropology, National Museum of Nature and Science; Professor Yukio Dodo, Tohoku University Graduate School of Medicine; Director Tadayuki Masuyama, Tahara Municipal Museum; Professor Masato Nakatsukasa, Graduate School of Science, Kyoto University; Professor Takahiro Nakahashi, Graduate School of Social and Cultural Studies, Kyushu University; and Professor Shozo Iwanaga, The Kyushu University Museum (their affiliations at the time of the survey). Dr Junmei Sawada (Institute of Physical Anthropology, Niigata University of Health and Welfare) kindly provided measurement data for fetal skeletons from the Daizenno-minami shellmound site in Chiba Prefecture. We also thank Lucy Muir, PhD, from Edanz (https://jp.edanz.com/ac) for editing a draft of this manuscript. This study is an extension and development of part of the first author’s PhD thesis. The author, Mizushima, sincerely thanks Dr Gen Suwa for his invaluable guidance and support over a long period of time during my PhD studies.
Conflict of Interest
The authors declare no competing interests.
Author contributions
S.M. designed the study, identified the human limb bones, collected and analyzed the data, and wrote the entire manuscript. K.H. proposed the study, interpreted some of the data, and revised the manuscript.
References
- Allen J.A. (1877) The influence of physical conditions in the genesis of species. Radical Review, 1: 108–140.
- Anderson M., Messner M.B., and Green W.T. (1964) Distribution of lengths of the normal femur and tibia from one to eighteen years of age. Journal of Bone and Joint Surgery, 46A: 1197–1202.
- Armelagos G.J., Mielke J.H., Owen K.H., and Van Gerven D.P. (1972) Bone growth and development in prehistoric populations from Sudanese Nubia. Journal of Human Evolution, 1: 89–119.
- Baba H., Onodera S., and Eto M. (1987) An infant skeleton from Usuiso shell-mounds in Jomon period. Journal of the Anthropological Society of Nippon, 95: 497–513 (in Japanese with English summary).
- Bergmann C. (1847) Über die Verhältnisse der Wärmeökonomie der Thiere zu ihrer Größe. Göttinger Studien, 3: 595–708.
- Betti L., Lycett S.J., von Cramon-Taubadel N., and Pearson O.M. (2015) Are human hands and feet affected by climate? A test of Allen’s rule. American Journal of Physical Anthropology, 158: 132–140.
- Biasutti R. (1951) Radio-humeral and tibio-femoral indexes in fossil and living man. Homo, 2: 97–99.
- Britton L. (2009) A Biocultural Analysis of Nubian Fetal Pot Burials from Askut, Sudan. Master’s thesis, University of Central Florida, Orlando, FL. https://stars.library.ucf.edu/cgi/viewcontent.cgi?article=5022&context=etd.
- Chitty L.S. and Altman D.G. (2002) Charts of fetal size: limb bones. International Journal of Obstetrics and Gynaecology, 109: 919–929.
- Chiu C. and Hamrick M.W. (2002) Evolution and development of the primate limb skeleton. Evolutionary Anthropology, 11: 94–107.
- Cho E.O., Cowgill L.W., Middleton K.M., Blomquist G.E., Savoldi F., Tsoi J., and Bornstein M.M. (2022) The influence of climate and population structure on East Asian skeletal morphology. Journal of Human Evolution, 173: 103268.
- Cowgill L.W., Eleazer C.D., Auerbach B.M., Temple D.H., and Okazaki K. (2012) Developmental variation in ecogeographic body proportions. American Journal of Physical Anthropology, 148: 557–570.
- Department of Anatomy, Faculty of Medicine, Kyushu University (1988) Nihon Minzoku-Bunka no Seisei, 2, Kyushu Daigaku Igakubu Kaibogaku Dai-ni-koza Shozo Kojinkotsu Siryo Shusei. Rokko Shuppan, Tokyo (in Japanese).
- Dodo Y. and Suzuki T. (1986) Kesennuma-shi Tagara-kaizuka shutsudo no Jomon-jidai jinkotsu. In: Miyagi-ken Kyoiku Iinkai (ed.), Tagara-kaizuka, Miyagi-ken Bunkazai Chosa Hokokusho 111. Miyagi-ken Kyoiku Iinkai, Miyagi, pp. 545–586 (in Japanese).
- Fazekas I.G. and Kósa F. (1978) Forensic Fetal Osteology. Akadémiai Kiadó, Budapest.
- Fuji N. (1966) Climatic changes of postglacial age in Japan. Quaternary Research, 5: 149–156 (in Japanese with English summary).
- Fukase H., Wakebe T., Tsurumoto T., Saiki K., Fujita M., and Ishida H. (2012) Geographic variation in body form of prehistoric Jomon males in the Japanese archipelago: ecogeographic implications. American Journal of Physical Anthropology, 149: 125–135.
- Futuyma D.J. (1986) Evolutionary Biology, 2nd edn. Sinauer Associates Inc., Sunderland, MA.
- García-Martínez D., Nalla S., Ferreira M.T., Guichón R.A., D’Angelo del Campo M.D., and Bastir M. (2018) Eco-geographic adaptations in the human ribcage throughout a 3D geometric morphometric approach. American Journal of Physical Anthropology, 166: 323–336.
- Gindhart P.S. (1973) Growth standards for the tibia and radius in children aged one month through eighteen years. American Journal of Physical Anthropology, 39: 41–48.
- Hasebe K. (1920) Kawachi Ko sekki-jidai jinkotsu chosa. Kyoto Teikoku Daigaku Bungakubu Kokogaku Kenkyu Hokoku, 4. Kyoto Teikoku Daigaku, Kyoto, pp. 35–83 (in Japanese).
- Hirai T. and Tabata T. (1928) Gendai nihon-jin jinkotsu no jinruigaku-teki kenkyu, 4, kashikotsu no kenkyu. Journal of the Anthropological Society of Nippon, 43 (Supplement 1): 1–82 (in Japanese).
- Holliday T.W. (1997) Body proportions in Late Pleistocene Europe and modern human origins. Journal of Human Evolution, 32: 423–447.
- Holliday T.W. and Falsetti A.B. (1995) Lower limb length of European early modern humans in relation to mobility and climate. Journal of Human Evolution, 29: 141–153.
- Holliday T.W. and Hilton C.E. (2010) Body proportions of circumpolar peoples as evidenced from skeletal data: Ipiutak and Tigara (Point Hope) versus Kodiak Island Inuit. American Journal of Physical Anthropology, 142: 287–302.
- Jeanty P. (1983) Fetal limb biometry. Radiology, 147: 601–602.
- Johnston F.E. (1962) Growth of the long bones of infants and young children at Indian Knoll. American Journal of Physical Anthropology, 20: 249–254.
- Kajigayama M. and Baba H. (2002) Yokohama-shi Inariyama-kaizuka shutsudo jinkotsu. In: Kanagawa Kokogaku Zaidan (ed.), Inariyama-kaizuka: Negishi Beigun (11) Norimen Seibi Koji ni Tomonau Hakkutsu Chosa. Kanagawa Kokogaku Zaidan, Kanagawa, pp. 401–408 (in Japanese).
- Kato K. and Ogata T. (1989) Main long bones of limbs of the Jomon people: proportions in their lengths. Okajimas Folia Anatomica Japonica, 66: 13–22.
- Katzmarzyk P.T. and Leonard W.R. (1998) Climatic influences on human body size and proportions: ecological adaptations and secular change. American Journal of Physical Anthropology, 106: 483–503.
- Kimura T. (2002) Saru no kokkaku to ido yoshiki: hito no nisoku hoko no kiso. In: Kimura T. (ed.), Hoko no Shinka to Roka. Therapeia, Tokyo, pp. 129–152 (in Japanese).
- Kito N., Noda T., and Minami T. (1998) Holocene fluctuation of the warm Tsushima Current and warm molluscan assemblages from Hokkaido, Japan. Quaternary Research, 37: 25–32 (in Japanese with English summary).
- Kiyono K. (1929) Tsukumo sekki-jidai-jin no shincho to shintai kakubu hirei. Zaitschrift für Praehistorie, 1: 35–42 (in Japanese).
- Kiyono K. and Hirai T. (1928a) Tsukumo kaizuka-jin jinkotsu no jinruigaku-teki kenkyu, 3, joshikotsu no kenkyu. Journal of the Anthropological Society of Nippon, 43 (Supplement 3): 177–301 (in Japanese).
- Kiyono K. and Hirai T. (1928b) Tsukumo kaizuka-jin jinkotsu no jinruigaku-teki kenkyu, 4, kashikotsu no kenkyu. Journal of the Anthropological Society of Nippon, 43 (Supplement 4): 303–390 (in Japanese).
- Koganei Y. (1917) Kawachi-no-kuni Minami-kawachi-gun Domyoji-mura oaza Ko aza Inui no sekki-jidai iseki yori hakkutsu seru jinkotsu. Journal of the Anthropological Society of Nippon, 32: 361–371 (in Japanese).
- Krogman W.M. (1962) The Human Skeleton in Forensic Medicine. Charles C. Thomas, Springfield, IL.
- Lewin R. (2004) Human Evolution: An Illustrated Introduction, 5th edn. John Wiley, Malden, MA.
- Lovejoy C.O., Russell K.F., and Harrison M.L. (1990) Long bone growth velocity in the Libben population. American Journal of Human Biology, 2: 533–541.
- Lovejoy C.O., McCollum M.A., Reno P.L., and Rosenman B.A. (2003) Developmental biology and human evolution. Annual Review of Anthropology, 32: 85–109.
- Maresh M.M. (1970) Measurements from roentgenograms. In: McCammon R.W. (ed.), Human Growth and Development. Charles C. Thomas, Springfield, IL, pp. 157–200.
- Merchant V.L. and Ubelaker D.H. (1977) Skeletal growth of the protohistoric Arikara. American Journal of Physical Anthropology, 46: 61–72.
- Miyamoto H. (1925) Gendai nihon-jin jinkotsu no jinruigaku-teki kenkyu, 2, joshikotsu no kenkyu. Journal of the Anthropological Society of Nippon, 40: 219–305 (in Japanese).
- Mizushima S. and Hirata K. (2020) A comparative analysis of fetal to adolescent limb segment proportions of prehistoric Jomon hunter-gatherers and modern Japanese. Anthropological Science (Japanese Series), 128: 21–37 (in Japanese with English summary).
- Morimoto I., Ogata T., Hiramoto Y., and Yoshida S. (1985) Jinkotsu. In: Toritsu Hitotsubashi-koukou-nai Iseki Chosadan (ed.), Edo: Toritsu Hitotsubashi-koukou Chiten Hakkutsu Chosa Houkoku. Toritsu Hitotsubashi-koukou-nai Iseki Chosadan, Tokyo, pp. 522–546 (in Japanese).
- Nagaoka T., Hirata K., Ohira R., and Matsu’ura S. (2008) Stature estimation of the medieval skeletons from the Yuigahama-minami site in Kamakura, Japan. Anthropological Science (Japanese Series), 116: 25–34 (in Japanese with English summary).
- Ohman J.C. and Lovejoy C.O. (2001) The shape of a long bone’s shaft: bending stress or growth plate form? American Journal of Physical Anthropology, 32 (Supplement): 115.
- Ohman J.C. and Lovejoy C.O. (2003) Asymmetry in the humeri of tennis players: ‘Wolff’s law’ or not? American Journal of Physical Anthropology, 36 (Supplement): 161.
- Okazaki K. (2009) Jomon Yayoi Chusei Kingendai-jin no Seicho Patan. Hana Shoin, Fukuoka (in Japanese).
- Oshima K. (1968) The post-glacial history of Usu Bay, Hokkaido. Journal of the Geological Society of Japan, 74: 1–8 (in Japanese with English summary).
- Pomeroy E., Stock J.T., and Wells J.C. (2021) Population history and ecology, in addition to climate, influence human stature and body proportions. Scientific Reports, 11: 274.
- Ruff C.B. (1991) Climate and body shape in hominid evolution. Journal of Human evolution, 21: 81–105.
- Ruff C.B. (1994) Morphological adaptation to climate in modern and fossil hominids. American Journal of Physical Anthropology, 37: 65–107.
- Ruff C.B. (2002) Variation in human body size and shape. Annual Review of Anthropology, 31: 211–232.
- Ruff C.B. (2003) Ontogenetic adaptation to bipedalism: age changes in femoral to humeral length and strength proportions in humans, with a comparison to baboons. Journal of Human Evolution, 45: 317–349.
- Ruff C.B., Burgess M.L., Bromage T.G., Mudakikwa A., and McFarlin S.C. (2013) Ontogenetic changes in limb bone structural proportions in mountain gorillas (Gorilla beringei beringei). Journal of Human Evolution, 65: 693–703.
- Saunders S., Hoppa R., and Southern R. (1993) Diaphyseal growth in a nineteenth century skeletal sample of subadults from St Thomas’ church, Belleville, Ontario. International Journal of Osteoarchaeology, 3: 265–281.
- Scheuer J.L., Musgrave J.H., and Evans S.P. (1980) The estimation of late fetal and perinatal age from limb bone length by linear and logarithmic regression. Annals of Human Biology, 7: 257–265.
- Schreider E. (1975) Morphological variations and climatic differences. Journal of Human Evolution, 4: 529–539.
- Schultz A.H. (1923) Fetal growth in man. American Journal of Physical Anthropology, 4: 389–399.
- Schultz A.H. (1926) Fetal growth of man and other primates. Quarterly Review of Biology, 1: 465–521.
- Sinclair D. and Dangerfield P. (1998) Human Growth after Birth, 6th edn. Oxford University Press, Oxford.
- Straight B., Hilton C.E., Naugle A., Olungah C.O., Ngo D., Qiao X., and Needham B.L. (2022) Drought, psychosocial stress, and ecogeographical patterning: tibial growth and body shape in Samburu (Kenyan) pastoralist children. American Journal of Biological Anthropology, 178: 574–592.
- Tahara I. and Kaifu Y. (2015) Body shape of the Jomon people in view of limb-trunk proportion. Anthropological Science (Japanese Series), 123: 111–124 (in Japanese with English summary).
- Takata G. (1922) On the value of bones as diagnostic material of fetal age. Folia Anatomica Japonica, 1: 63–68.
- Takigawa W. (2005) Metric comparison of limb bone characteristics between the Jomon and Hokkaido Ainu. Anthropological Science (Japanese Series), 113: 43–61 (in Japanese with English summary).
- Takigawa W. (2006) Inter-regional variation of metric traits of limb bones in Jomon and modern Japanese. Anthropological Science (Japanese Series), 114: 101–129 (in Japanese with English summary).
- Tanner J.M., Hayashi T., Preece M.A., and Cameron N. (1982) Increase in length of leg relative to trunk in Japanese children and adults from 1957 to 1977: comparison with British and with Japanese Americans. Annals of Human Biology, 9: 411–423.
- Temple D.H. and Matsumura H. (2011) Do body proportions among Jomon foragers from Hokkaido conform to ecogeographic expectations? Evolutionary implications of body size and shape among northerly hunter-gatherers. International Journal of Osteoarchaeology, 21: 268–282.
- Temple D.H., Auerbach B.M., Nakatsukasa M., Sciulli P.W., and Larsen C.S. (2008) Variation in limb proportions between Jomon foragers and Yayoi agriculturalists from prehistoric Japan. American Journal of Physical Anthropology, 137: 164–174.
- Temple D.H., Okazaki K., and Cowgill L.W. (2011) Ontogeny of limb proportions in Late through Final Jomon Period foragers. American Journal of Physical Anthropology, 145: 415–425.
- Tilkens M.J., Wall-Scheffler C., Weaver T.D., and Steudel-Numbers K. (2007) The effects of body proportions on thermoregulation: an experimental assessment of Allen’s rule. Journal of Human Evolution, 53: 286–291.
- Trinkaus E. (1981) Neanderthal limb proportions and cold adaptation. In: Stringer C. (ed.), Aspects of Human Evolution. Taylor & Francis, London, pp. 187–224.
- Tripathy V. and Gupta R. (2007) Growth among Tibetans at high and low altitudes in India. American Journal of Human Biology, 19: 789–800.
- Wakebe T. (1985) Fukuoka-ken Ogori-shi Yokokuma-kitsunezuka iseki shutsudo no Yayoi-jidai yoshonikotsu. In: Ogori-shi Kyoiku Iinkai (ed.), Yokokuma-kitsunezuka Iseki, 2. Ogori-shi Kyoiku Iinkai, Fukuoka, pp. 47–57 (in Japanese).
- Weinstein K.J. (2005) Body proportions in ancient Andeans from high and low altitudes. American Journal of Physical Anthropology, 128: 569–585.
- Wells J.C., Saunders M.A., Lea A.S., Cortina-Borja M., and Shirley M.K. (2019) Beyond Bergmann’s rule: global variability in human body composition is associated with annual average precipitation and annual temperature volatility. American Journal of Physical Anthropology, 170: 75–87.
- Yaguramaki N. and Kimura T. (2002) Acquirement of stability and mobility in infant gait. Gait & Posture, 16: 69–77.
- Yamaguchi B. (1981) Jomon-jidai jinkotsu. Kikan Jinruigaku, 12: 38–50 (in Japanese).
- Yamaguchi B. (1982a) A review of the osteological characteristics of the Jomon population in prehistoric Japan. Journal of the Anthropological Society of Nippon, 90 (Supplement): 77–90.
- Yamaguchi B. (1982b) Jomon jinkotsu no tokucho. In: Kato S., Kobayashi T., and Fujimoto T. (eds.), Jomon Bunka no Kenkyu, 1, Jomon-jin to sono Kankyo. Yuzankaku Shuppan, Tokyo, pp. 27–54 (in Japanese).
- Yamaguchi B. (1989) Limb segment proportions in human skeletal remains of the Jomon period. Bulletin of the National Science Museum Series D, 15: 41–48.
- Yasuda Y. (1982) Kiko hendo. In: Kato S., Kobayashi T., and Fujimoto T. (eds.), Jomon Bunka no Kenkyu, 1, Jomon-jin to sono Kankyo. Yuzankaku Shuppan, Tokyo, pp. 163–200 (in Japanese).


