Abstract
Background: Concerns regarding the impact of screen-based sedentary behavior on health have been increasing. Therefore, the present study investigated the longitudinal relationship between multiple screen time and nutrient intake in children and adolescents.
Methods: The present study was conducted utilizing 3 years longitudinal data. Study subjects were 740 Japanese children aged between 6 and 12 years at baseline and between 9 and 15 years in the follow-up. Screen-based sedentary behavior was assessed using screen time, including television (TV) viewing, personal computer (PC) use, and mobile phone (MP) use. The main outcomes were the intakes of nutrients. Mixed effect multivariate linear regression analyses were used to examine the longitudinal relationship between screen-based sedentary time and nutrient intake. Covariates included in the multivariable analysis consisted of sex, age, solitary eating, skipping breakfast, staying up late, and body weight status, as confounders, and physical inactivity, as mediator.
Results: In boys, a longer total screen time longitudinally correlated with higher intake of energy and lower intakes of protein, dietary fiber, minerals, and vitamins. In girls, longer total screen time longitudinally associated with higher intake of sucrose and lower intakes of protein, minerals, and vitamins. In boys, a longer TV viewing time was associated with higher intake of sucrose and lower intakes of protein, minerals, and vitamins. In girls, a longer TV viewing time was associated with higher intake of carbohydrates and lower intakes of protein, fat, minerals, and vitamins. In boys, relationships were observed between a longer PC use time and higher intakes of energy as well as lower intakes of protein, minerals, and vitamins. Relationship was observed between longer PC use time and lower intakes of minerals in girls. An increased MP use time was associated with higher intakes of energy, and lower intakes of protein, sucrose, dietary fiber, minerals, and vitamins in boys. A longer MP use time was associated with higher intakes of fat, and salt as well as lower intakes of carbohydrates, protein, minerals, and vitamins in girls.
Conclusions: The present results revealed that longer screen-based sedentary behaviors were longitudinally associated with nutrient intake in children and adolescents. Future study is needed to elucidate these relationships.
Introduction
Screen time refers to a prolonged viewing time of various screen types, such as televisions (TV), personal computers (PC), and mobile phones (MP). Screen time is theoretically regarded as a sedentary behavior, which is characterized by the time spent in activities with an energy expenditure of less than 1.5 metabolic equivalent of task (METs) in a seated, reclined, or recumbent posture [1].
Global screen time guidelines recommend limiting screen time to ≤2 hours per day for children [2]. However, the majority of children, approximately 40 to 80%, do not meet screen time recommendations [3].
Screen time significantly contributes to overall sedentariness [4] and reduces energy expenditure [5]. Screen-based sedentary behavior has been suggested to contribute to the development of health issues that may persist into adulthood, including excess weight [6]. A recent systematic review concluded that there is moderately strong evidence for the relationship between screen time and obesity [7].
Screen-based sedentary behavior may be associated with obesity mainly due to the effects of an unhealthy diet [8]. A recent study indicated a strong relationship between screen-based sedentary behavior and unhealthy diet [7]. Exposure to food advertisements, interference with the physiological signs of satiety, or increased levels of stress might intermediate such relationships. However, the relationship between screen-based sedentary behavior and nutrient intake has not yet been examined in detail, particularly in children. Furthermore, the majority of research on screen-based sedentary behavior and diet has mainly focused on TV viewing [7]. Although TV viewing remains a popular form of screen-based sedentary behavior for children, the use of PC and MP has become a part of everyday life with technological advances. The impact of each screen on diet might be different because each screen might include different types of advertisements, interference to the physiological signs, or levels of stress. However, data on other forms of screen time besides TV are limited, reflecting the lack of evidence on the effects of new screen time patterns on children’s nutrient intake [7]. A few studies have examined PC use and even fewer have investigated MP [7]. Therefore, the extent to which the above findings may be generalized to more modern forms of screen use remains unclear. Moreover, a limitation shared by all studies is their cross-sectional design. Longitudinal studies are important for confirming causality rather than associations.
Therefore, the present study examined the longitudinal relationships between multiple screen-based behaviors (TV viewing, PC use, and MP use) and nutrient intake in a sample of children in Japan. By clarifying the present aim of this study, it would be beneficial to elucidate which type of screen-based sedentary behavior should be focused for intervention programs. To the best of our knowledge, this relationship has not yet been examined in detail.
Methods
Data and participants
This was an observational, epidemiological, and longitudinal study. We utilized data from the Shika study. The Shika study is an ongoing population-based survey that aims to investigate the lifestyle and health status of the Japanese population. Shika town is located in a rural area of Ishikawa prefecture, Japan, with a population of 20,422 individuals (Statistics Bureau of Japan, 2016).
This longitudinal study was primarily designed to assess nutrient intake and associated behaviors in a sample of Japanese children. We collected 3-year interval data for this analysis between October and December at two time points in 2013 (baseline) and 2016 (follow-up). The periods during baseline and follow-up were same for all the children. Linked dataset was constructed in 2020. Exposure and outcome variables were measured both at baseline and in the follow-up. Data on screen-based sedentary behavior and dietary intake were collected via proxy-administered questionnaires. Data were collected from the guardians of children aged between 6 and 12 years old at baseline and 9 and 15 years in the follow-up. All students of compulsory school age who went to elementary schools in the town at baseline were eligible to participate in the study. We distributed questionnaires in collaboration with these schools. We asked the guardians to fill in the questionnaire with the assistance of their children, as much as possible, in order to accurately reflect their children’s general behavior to the greatest extent possible.
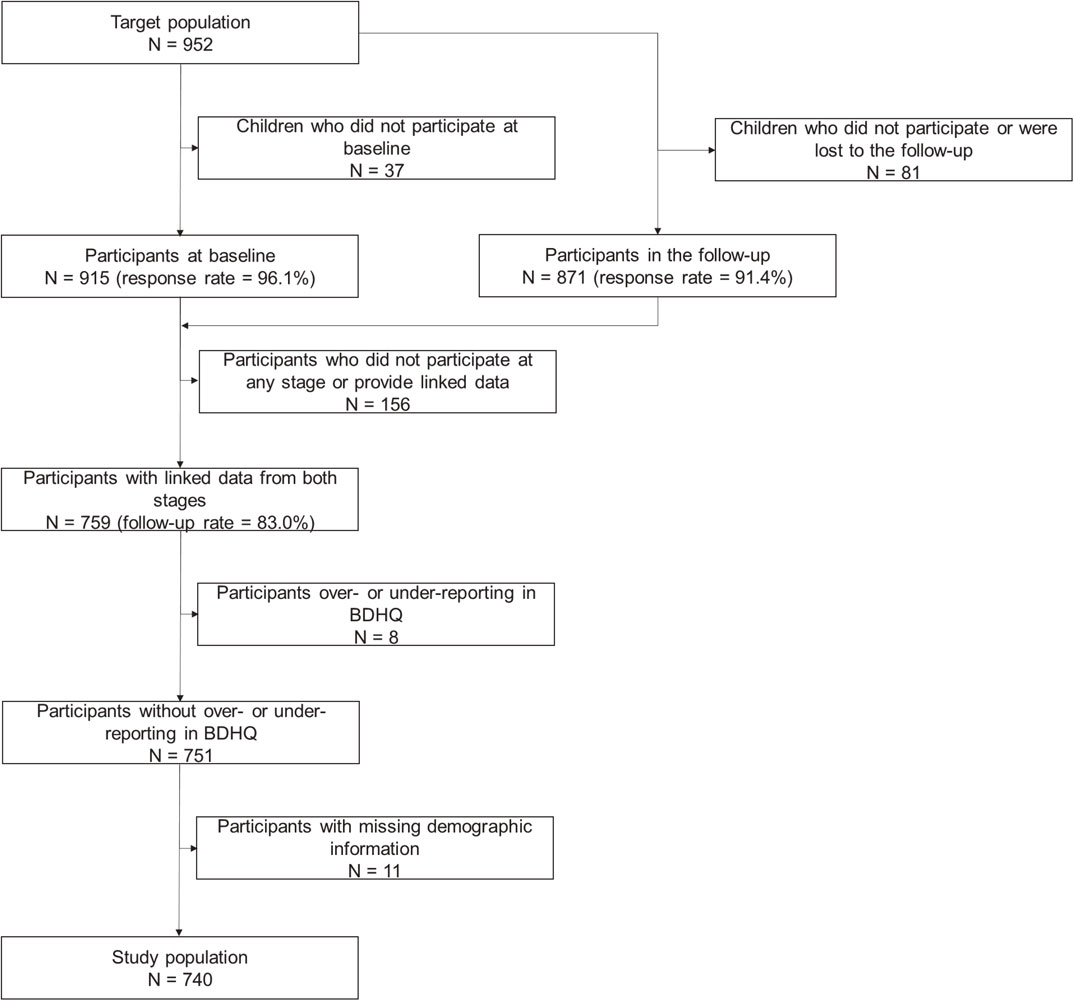
At baseline, 952 children were invited and 915 ultimately participated (response rate = 96.1%). In the follow-up, the same children were invited again and 871 children participated (response rate = 91.4%). We combined the data of 759 children who participated at both time points and provided sufficiently linked data (follow-up rate = 83.0%). Among the 759 participants with linked data, 8 were considered to be under- or over-reporters on energy intake. Therefore, they were excluded from analyses. Among the remaining 751 participants, 11 had data missing on demographic variables and were excluded. Therefore, 740 participants were ultimately analyzed as study subjects. The flow of inclusion is shown in Fig. 1.
Participation in this study was voluntary. None of the participants received any remuneration. Patients or the public were not involved in the conceptualization, design, planning, or carrying out of the study. The present study was conducted in accordance with the Declaration of Helsinki, and the protocol was approved by the Ethics Committee of Kanazawa University (No. 2568). Written informed consent was obtained from the guardians of all participants prior to data collection. A detailed description on the methodology has been provided in a previous study [10, 11].
Primary measures
Screen-based sedentary time (independent variable)
Screen-based sedentary times were assessed based on a questionnaire on TV viewing, PC use, and MP use both at baseline and in the follow-up. These items assessed the mean time spent on each screen on a typical day through specific questions for each device. This type of instrument has been used in other epidemiological studies, and has been reported to have acceptable validity and reliability for quantifying screen time [12]. Total screen time was the sum of time spent on TV, PC, and MP. According to the recent recommendations by the American Academy of Pediatrics (AAP), no more than 2 h daily of sedentary screen time is recommended for children and adolescents [2]. Screen time was categorized as moderate and higher according to the cut-off point of ≥2 hours/day for total screen time and ≥1 hour/day for each screen time.
Nutrient intake (dependent variables)
The main outcome was the intake of nutrients extracted from a validated food frequency questionnaire. We utilized the brief self-administered dietary history questionnaire (BDHQ) both at baseline and in the follow-up. BDHQ asks about dietary history during the preceding month. It is based on a comprehensive version of a validated self-administered dietary history questionnaire (i.e., DHQ) [13]. They were previously shown to have acceptable validity [14, 15]. Reported food and beverage intakes were converted into energy, macronutrient, and micronutrient values using a computer algorithm for BDHQ. Nutrient intake was reported in terms of energy density (% energy for macronutrients and per 1,000 kcal for micronutrients). Details on BDHQ are described elsewhere [16]. Participants who reported less than 600 kcal or more than 4,000 kcal energy intake per day were excluded from analyses as they were considered to be under- or over-reporters.
Baseline characteristics (covariates)
Covariates included in the multivariable analysis consisted of sex, age, solitary eating, skipping breakfast, staying up late, and body weight status, as confounders. Physical inactivity was also included as a mediator [17, 18]. Body weight status was based on the Rohrer index computed from self-reported heights and weights. The Rohrer index was calculated based on the standard formula (kg/m3 × 10). Although participation in screen-based sedentary behaviors and physical inactivity might occur independently, research suggests that both types of behaviors may be associated with dietary behavior [19]. The questionnaire was used to assess the level of physical inactivity, which was evaluated by asking the time spent doing physical activity on an average day.
Statistical analysis
The distribution of the data was assumed to be normal from central limit theorem [20], because the sample size was more than 100. Descriptive statistics were used to describe the baseline characteristics, screen-based sedentary behavior, and nutrient intake of the study subjects. Mean (M) and standard deviation (SD) values were summarized for quantitative variables, and frequencies (N) and percentages (%) for qualitative variables. Paired t-tests were used to examine the significance of differences in screen time and nutrient intake between baseline and the follow-up. Mixed-effects multivariate linear regression analyses, adjusting for sex, age, solitary eating, skipping breakfast, staying up late, body weight status, and physical inactivity, were used to provide parameter estimates (β) and 95% confidence intervals (CI) for the longitudinal relationship between each screen time and nutrient intake across baseline to the follow-up. Forced entry method was applied to use all the potential variables, which might affect both screen-based sedentary behavior and diet, for adjustment. Statistical Package for Social Science version 27 was used for these analyses. Statistical tests were two-sided at a significance level of 5%.
Results
Characteristics of study subjects
The characteristics of the studied subjects are shown in Table 1. A total of 740 participants provided data for the variables of interest and were included in analyses. Boys accounted for 48·5% (N = 359) of subjects and girls 51.5% (N = 381). The mean age of subjects was 9·19 (SD = 1.78) years. The percentages of subjects with a longer total screen, TV viewing, PC use, and MP use were 26·4, 84·2, 5·6, and 3·0% at baseline and 61·7, 85·1, 19·5, and 24·7% in the follow-up, respectively, showing a significant difference in total screen, PC use, and MP use. The mean intake of energy was significantly higher in the follow-up than at baseline. The intakes of protein, sucrose, dietary fiber, potassium, iron, copper, manganese, retinol equivalent, beta-carotene equivalent, vitamin B1, vitamin B2, niacin, vitamin B6, vitamin B12, vitamin C, vitamin D, alpha-tocopherol, vitamin K, folic acid, and pantothenic acid were significantly higher at baseline than in the follow-up.
Table 1 Characteristics (N = 740)
| |
Baseline |
Follow-up |
p-value |
| Mean/number |
SD/% |
Mean/number |
SD/% |
| Sex |
359 |
48.5% |
- |
- |
- |
| Age |
9.19 |
1.78 |
- |
- |
- |
| Solitary eating |
53 |
7.16% |
- |
- |
- |
| Physical inactivity |
173 |
23.4% |
- |
- |
- |
| Skipping breakfast |
50 |
6.8% |
- |
- |
- |
| Staying up late |
196 |
26.5% |
- |
- |
- |
| The Rohrer index |
129.60 |
19.04 |
- |
- |
- |
| Longer total screen time |
195 |
26.4% |
457 |
61.7% |
<0.001 |
| Longer TV viewing time |
623 |
84.2% |
630 |
85.1% |
0.675 |
| Longer PC using time |
41 |
5.6% |
145 |
19.5% |
<0.001 |
| Longer MP using time |
22 |
3.0% |
183 |
24.7% |
<0.001 |
| Energy (kcal) |
1674.20 |
531.12 |
1790.09 |
673.07 |
<0.001 |
| Protein (%E) |
14.03 |
2.00 |
13.79 |
2.07 |
0.005 |
| Fat (%E) |
28.42 |
4.72 |
28.52 |
4.67 |
0.669 |
| Carbohydrates (%E) |
56.13 |
5.81 |
56.14 |
5.71 |
0.975 |
| Sucrose (%E) |
2.40 |
1.41 |
2.19 |
1.25 |
<0.001 |
| Total dietary fiber (g/1000 kcal) |
5.80 |
1.18 |
5.59 |
1.24 |
<0.001 |
| Salt equivalent (g/1000 kcal) |
6.13 |
1.51 |
6.22 |
1.43 |
0.063 |
| Potassium (mg/1000 kcal) |
1218.37 |
248.72 |
1139.80 |
243.74 |
<0.001 |
| Calcium (mg/1000 kcal) |
349.61 |
82.39 |
347.42 |
96.69 |
0.575 |
| Magnesium (mg/1000 kcal) |
122.35 |
18.31 |
121.36 |
19.20 |
0.182 |
| Phosphorus (mg/1000 kcal) |
563.32 |
85.26 |
558.80 |
95.23 |
0.239 |
| Iron (mg/1000 kcal) |
3.75 |
0.65 |
3.64 |
0.71 |
<0.001 |
| Zinc (mg/1000 kcal) |
4.43 |
0.46 |
4.42 |
0.50 |
0.553 |
| Copper (mg/1000 kcal) |
0.61 |
0.08 |
0.60 |
0.08 |
0.004 |
| Manganese (mg/1000 kcal) |
1.65 |
0.40 |
1.57 |
0.41 |
<0.001 |
| Retinol equivalent (µg/1000 kcal) |
297.54 |
136.08 |
266.23 |
149.04 |
<0.001 |
| Beta carotene equivalent (µg/1000 kcal) |
1593.91 |
747.73 |
1357.32 |
777.05 |
<0.001 |
| Vitamin B1 (mg/1000 kcal) |
0.40 |
0.07 |
0.39 |
0.07 |
<0.001 |
| Vitamin B2 (mg/1000 kcal) |
0.70 |
0.15 |
0.67 |
0.16 |
<0.001 |
| Niacin (mg/1000 kcal) |
6.53 |
1.57 |
6.32 |
1.55 |
0.002 |
| Vitamin B6 (mg/1000 kcal) |
0.56 |
0.12 |
0.53 |
0.12 |
<0.001 |
| Vitamin B12 (µg/1000 kcal) |
3.54 |
1.60 |
3.22 |
1.52 |
<0.001 |
| Vitamin C (mg/1000 kcal) |
53.98 |
21.40 |
47.66 |
19.90 |
<0.001 |
| Vitamin D (µg/1000 kcal) |
4.85 |
2.49 |
4.38 |
2.55 |
<0.001 |
| α-tocopherol (mg/1000 kcal) |
3.56 |
0.73 |
3.46 |
0.73 |
0.002 |
| Vitamin K (µg/1000 kcal) |
111.72 |
47.12 |
106.62 |
51.29 |
0.016 |
| Folic acid (µg/1000 kcal) |
149.87 |
40.43 |
139.56 |
40.77 |
<0.001 |
| Pantothenic acid (mg/1000 kcal) |
3.35 |
0.55 |
3.23 |
0.56 |
<0.001 |
The longitudinal relationships between total screen time and nutrient intake are shown in Tables 2 and 3.
Table 2 Longitudinal relationship between total screen time and nutrient intake in boys (N = 359)
| Parameter |
Estimated
value |
Standard
error |
95% confidence interval |
Standerdized estimated value |
p-value |
| Lower |
Upper |
| Energy (kcal) |
86.607 |
38.520 |
10.965 |
162.249 |
0.072 |
0.025 |
| Protein (%E) |
−0.447 |
0.136 |
−0.714 |
−0.181 |
−0.118 |
0.001 |
| Fat (%E) |
−0.042 |
0.345 |
−0.720 |
0.636 |
−0.005 |
0.903 |
| Carbohydrates (%E) |
0.446 |
0.417 |
−0.373 |
1.265 |
0.041 |
0.285 |
| Sucrose (%E) |
−0.123 |
0.089 |
−0.298 |
0.052 |
−0.050 |
0.169 |
| Total dietary fiber (g/1000 kcal) |
−0.194 |
0.083 |
−0.357 |
−0.031 |
−0.081 |
0.019 |
| Salt equivalent (g/1000 kcal) |
−0.052 |
0.083 |
−0.214 |
0.111 |
−0.019 |
0.532 |
| Potassium (mg/1000 kcal) |
−62.655 |
16.975 |
−95.989 |
−29.321 |
−0.129 |
<0.001 |
| Calcium (mg/1000 kcal) |
−19.398 |
6.445 |
−32.056 |
−6.741 |
−0.108 |
0.003 |
| Magnesium (mg/1000 kcal) |
−2.922 |
1.222 |
−5.323 |
−0.521 |
−0.082 |
0.017 |
| Phosphorus (mg/1000 kcal) |
−21.893 |
6.149 |
−33.969 |
−9.817 |
−0.126 |
<0.001 |
| Iron (mg/1000 kcal) |
−0.079 |
0.047 |
−0.171 |
0.014 |
−0.060 |
0.095 |
| Zinc (mg/1000 kcal) |
−0.088 |
0.031 |
−0.150 |
−0.026 |
−0.097 |
0.005 |
| Copper (mg/1000 kcal) |
−0.009 |
0.005 |
−0.018 |
0.000 |
−0.062 |
0.056 |
| Manganese (mg/1000 kcal) |
−0.046 |
0.030 |
−0.104 |
0.012 |
−0.058 |
0.117 |
| Retinol equivalent (µg/1000 kcal) |
−10.258 |
11.803 |
−33.433 |
12.917 |
−0.032 |
0.385 |
| Beta carotene equivalent (µg/1000 kcal) |
−120.166 |
52.691 |
−223.651 |
−16.681 |
−0.077 |
0.023 |
| Vitamin B1 (mg/1000 kcal) |
−0.015 |
0.005 |
−0.024 |
−0.006 |
−0.111 |
0.002 |
| Vitamin B2 (mg/1000 kcal) |
−0.040 |
0.010 |
−0.061 |
−0.020 |
−0.132 |
<0.001 |
| Niacin (mg/1000 kcal) |
−0.190 |
0.105 |
−0.396 |
0.015 |
−0.064 |
0.069 |
| Vitamin B6 (mg/1000 kcal) |
−0.026 |
0.008 |
−0.041 |
−0.011 |
−0.115 |
0.001 |
| Vitamin B12 (µg/1000 kcal) |
−0.223 |
0.105 |
−0.430 |
−0.016 |
−0.078 |
0.035 |
| Vitamin C (mg/1000 kcal) |
−3.963 |
1.410 |
−6.731 |
−1.194 |
−0.097 |
0.005 |
| Vitamin D (µg/1000 kcal) |
−0.476 |
0.173 |
−0.815 |
−0.137 |
−0.101 |
0.006 |
| α-tocopherol (mg/1000 kcal) |
−0.022 |
0.054 |
−0.128 |
0.084 |
−0.015 |
0.682 |
| Vitamin K (µg/1000 kcal) |
−3.507 |
3.340 |
−10.066 |
3.053 |
−0.037 |
0.294 |
| Folic acid (µg/1000 kcal) |
−6.728 |
2.740 |
−12.109 |
−1.348 |
−0.083 |
0.014 |
| Pantothenic acid (mg/1000 kcal) |
−0.145 |
0.036 |
−0.216 |
−0.075 |
−0.132 |
<0.001 |
Mixed-effects multivariable linear regression analyses, adjusting for sex, age, solitary eating, skipping breakfast, staying up late, body weight status, and physical inactivity.
Table 3 Longitudinal relationship between total screen time and nutrient intake in girls (N = 381)
| Parameter |
Estimated
value |
Standard
error |
95% confidence interval |
Standerdized estimated value |
p-value |
| Lower |
Upper |
| Energy (kcal) |
−64.257 |
33.561 |
−130.151 |
1.636 |
−0.065 |
0.056 |
| Protein (%E) |
−0.382 |
0.148 |
−0.672 |
−0.092 |
−0.091 |
0.010 |
| Fat (%E) |
0.008 |
0.346 |
−0.671 |
0.687 |
0.001 |
0.982 |
| Carbohydrates (%E) |
0.394 |
0.423 |
−0.437 |
1.224 |
0.035 |
0.352 |
| Sucrose (%E) |
0.211 |
0.103 |
0.009 |
0.414 |
0.075 |
0.041 |
| Total dietary fiber (g/1000 kcal) |
−0.104 |
0.087 |
−0.275 |
0.067 |
−0.043 |
0.232 |
| Salt equivalent (g/1000 kcal) |
0.004 |
0.091 |
−0.176 |
0.184 |
0.001 |
0.965 |
| Potassium (mg/1000 kcal) |
−46.377 |
17.493 |
−80.723 |
−12.031 |
−0.091 |
0.008 |
| Calcium (mg/1000 kcal) |
−2.922 |
1.222 |
−5.323 |
−0.521 |
−0.103 |
0.017 |
| Magnesium (mg/1000 kcal) |
−3.747 |
1.311 |
−6.321 |
−1.174 |
−0.098 |
0.004 |
| Phosphorus (mg/1000 kcal) |
−18.741 |
6.575 |
−31.652 |
−5.830 |
−0.101 |
0.005 |
| Iron (mg/1000 kcal) |
−0.091 |
0.049 |
−0.187 |
0.005 |
−0.066 |
0.063 |
| Zinc (mg/1000 kcal) |
−0.091 |
0.034 |
−0.157 |
−0.024 |
−0.092 |
0.008 |
| Copper (mg/1000 kcal) |
−0.017 |
0.005 |
−0.028 |
−0.006 |
−0.105 |
0.002 |
| Manganese (mg/1000 kcal) |
0.004 |
0.029 |
−0.053 |
0.062 |
0.005 |
0.884 |
| Retinol equivalent (µg/1000 kcal) |
−22.051 |
9.253 |
−40.216 |
−3.885 |
−0.085 |
0.017 |
| Beta carotene equivalent (µg/1000 kcal) |
−62.213 |
53.097 |
−166.467 |
42.040 |
−0.040 |
0.242 |
| Vitamin B1 (mg/1000 kcal) |
−0.006 |
0.005 |
−0.016 |
0.003 |
−0.042 |
0.210 |
| Vitamin B2 (mg/1000 kcal) |
−0.028 |
0.011 |
−0.049 |
−0.007 |
−0.089 |
0.010 |
| Niacin (mg/1000 kcal) |
−0.036 |
0.112 |
−0.256 |
0.183 |
−0.011 |
0.746 |
| Vitamin B6 (mg/1000 kcal) |
−0.013 |
0.008 |
−0.029 |
0.003 |
−0.052 |
0.122 |
| Vitamin B12 (µg/1000 kcal) |
−0.170 |
0.118 |
−0.402 |
0.062 |
−0.051 |
0.151 |
| Vitamin C (mg/1000 kcal) |
−0.320 |
1.467 |
−3.200 |
2.560 |
−0.008 |
0.827 |
| Vitamin D (µg/1000 kcal) |
−0.274 |
0.191 |
−0.649 |
0.101 |
−0.051 |
0.151 |
| α-tocopherol (mg/1000 kcal) |
0.000 |
0.053 |
−0.105 |
0.105 |
0.000 |
0.998 |
| Vitamin K (µg/1000 kcal) |
−7.357 |
3.486 |
−14.202 |
−0.513 |
−0.076 |
0.035 |
| Folic acid (µg/1000 kcal) |
−4.695 |
2.732 |
−10.060 |
0.669 |
−0.058 |
0.086 |
| Pantothenic acid (mg/1000 kcal) |
−0.113 |
0.037 |
−0.186 |
−0.041 |
−0.101 |
0.002 |
Mixed-effects multivariable linear regression analyses, adjusting for sex, age, solitary eating, skipping breakfast, staying up late, body weight status, and physical inactivity.
After accounting for sex, age, solitary eating, skipping breakfast, staying up late, body weight status, and physical inactivity, a longer total screen time longitudinally correlated with higher intake of energy (p = 0.025) and lower intakes of protein (p = 0.001), dietary fiber (p = 0.019), potassium (p < 0.001), calcium (p = 0.003), magnesium (p = 0.017), phosphorus (p < 0.001), zinc (p = 0.005), beta carotene equivalent (p = 0.023), vitamin B1 (p = 0.002), vitamin B2 (p < 0.001), vitamin B6 (p = 0.001), vitamin B12 (p = 0.035), vitamin C (p = 0.005), vitamin D (p = 0.006), folic acid (p = 0.014), and pantothenic acid (p < 0.001) in boys. In girls, a longer total screen time longitudinally correlated with higher intake of sucrose (p = 0.041) and lower intakes of protein (p = 0.010), potassium (p = 0.008), calcium (p = 0.017), magnesium (p = 0.004), phosphorus (p = 0.005), zinc (p = 0.008), copper (p = 0.002), retinol equivalent (p = 0.017), vitamin B2 (p = 0.010), vitamin K (p = 0.035), and pantothenic acid.
Longitudinal relationship between TV time and nutrient intake
The longitudinal relationships between TV time and nutrient intake are shown in Tables 4 and 5.
Table 4 Longitudinal relationship between total screen time and nutrient intake in boys (N = 359)
| Parameter |
Estimated
value |
Standard
error |
95% confidence interval |
Standerdized estimated value |
p-value |
| Lower |
Upper |
| Energy (kcal) |
−40.795 |
54.327 |
−147.459 |
65.869 |
−0.025 |
0.453 |
| Protein (%E) |
−0.476 |
0.191 |
−0.851 |
−0.100 |
−0.091 |
0.013 |
| Fat (%E) |
0.362 |
0.473 |
−0.567 |
1.292 |
0.029 |
0.445 |
| Carbohydrates (%E) |
0.295 |
0.573 |
−0.829 |
1.420 |
0.020 |
0.606 |
| Sucrose (%E) |
0.316 |
0.126 |
0.067 |
0.564 |
0.093 |
0.013 |
| Total dietary fiber (g/1000 kcal) |
−0.155 |
0.120 |
−0.390 |
0.080 |
−0.047 |
0.196 |
| Salt equivalent (g/1000 kcal) |
0.013 |
0.119 |
−0.220 |
0.246 |
0.004 |
0.911 |
| Potassium (mg/1000 kcal) |
−30.516 |
24.160 |
−77.952 |
16.920 |
−0.046 |
0.207 |
| Calcium (mg/1000 kcal) |
−18.434 |
9.166 |
−36.430 |
−0.438 |
−0.075 |
0.045 |
| Magnesium (mg/1000 kcal) |
−3.861 |
1.761 |
−7.318 |
−0.404 |
−0.079 |
0.029 |
| Phosphorus (mg/1000 kcal) |
−28.203 |
8.705 |
−45.294 |
−11.112 |
−0.118 |
0.001 |
| Iron (mg/1000 kcal) |
−0.087 |
0.067 |
−0.218 |
0.044 |
−0.048 |
0.195 |
| Zinc (mg/1000 kcal) |
−0.127 |
0.045 |
−0.215 |
−0.038 |
−0.101 |
0.005 |
| Copper (mg/1000 kcal) |
−0.015 |
0.007 |
−0.028 |
−0.001 |
−0.074 |
0.032 |
| Manganese (mg/1000 kcal) |
−0.052 |
0.041 |
−0.133 |
0.029 |
−0.047 |
0.208 |
| Retinol equivalent (µg/1000 kcal) |
−25.935 |
16.241 |
−57.823 |
5.952 |
−0.059 |
0.111 |
| Beta carotene equivalent (µg/1000 kcal) |
−120.977 |
76.059 |
−270.312 |
28.359 |
−0.056 |
0.112 |
| Vitamin B1 (mg/1000 kcal) |
−0.004 |
0.007 |
−0.017 |
0.009 |
−0.023 |
0.531 |
| Vitamin B2 (mg/1000 kcal) |
−0.024 |
0.015 |
−0.053 |
0.005 |
−0.057 |
0.107 |
| Niacin (mg/1000 kcal) |
−0.215 |
0.150 |
−0.509 |
0.079 |
−0.052 |
0.151 |
| Vitamin B6 (mg/1000 kcal) |
−0.017 |
0.011 |
−0.039 |
0.004 |
−0.056 |
0.118 |
| Vitamin B12 (µg/1000 kcal) |
−0.407 |
0.146 |
−0.694 |
−0.119 |
−0.103 |
0.006 |
| Vitamin C (mg/1000 kcal) |
−0.860 |
2.014 |
−4.814 |
3.094 |
−0.015 |
0.669 |
| Vitamin D (µg/1000 kcal) |
−0.695 |
0.240 |
−1.166 |
−0.224 |
−0.107 |
0.004 |
| α-tocopherol (mg/1000 kcal) |
−0.036 |
0.075 |
−0.184 |
0.112 |
−0.018 |
0.635 |
| Vitamin K (µg/1000 kcal) |
−8.068 |
4.785 |
−17.463 |
1.326 |
−0.061 |
0.092 |
| Folic acid (µg/1000 kcal) |
−7.541 |
3.936 |
−15.269 |
0.186 |
−0.067 |
0.056 |
| Pantothenic acid (mg/1000 kcal) |
−0.082 |
0.052 |
−0.183 |
0.020 |
−0.053 |
0.116 |
Mixed-effects multivariable linear regression analyses, adjusting for sex, age, solitary eating, skipping breakfast, staying up late, body weight status, and physical inactivity.
Table 5 Longitudinal relationship between total screen time and nutrient intake in girls (N = 381)
| Parameter |
Estimated
value |
Standard
error |
95% confidence interval |
Standerdized estimated value |
p-value |
| Lower |
Upper |
| Energy (kcal) |
−70.769 |
46.251 |
−161.566 |
20.029 |
−0.052 |
0.126 |
| Protein (%E) |
−0.775 |
0.204 |
−1.175 |
−0.375 |
−0.133 |
<0.001 |
| Fat (%E) |
−1.096 |
0.467 |
−2.012 |
−0.180 |
−0.086 |
0.019 |
| Carbohydrates (%E) |
1.958 |
0.572 |
0.836 |
3.081 |
0.125 |
0.001 |
| Sucrose (%E) |
0.245 |
0.141 |
−0.032 |
0.522 |
0.063 |
0.083 |
| Total dietary fiber (g/1000 kcal) |
−0.196 |
0.120 |
−0.432 |
0.039 |
−0.060 |
0.102 |
| Salt equivalent (g/1000 kcal) |
−0.255 |
0.127 |
−0.505 |
−0.005 |
−0.064 |
0.045 |
| Potassium (mg/1000 kcal) |
−49.556 |
24.228 |
−97.119 |
−1.992 |
−0.071 |
0.041 |
| Calcium (mg/1000 kcal) |
−16.704 |
8.993 |
−34.358 |
0.950 |
−0.068 |
0.064 |
| Magnesium (mg/1000 kcal) |
−6.106 |
1.832 |
−9.703 |
−2.509 |
−0.116 |
0.001 |
| Phosphorus (mg/1000 kcal) |
−29.581 |
9.097 |
−47.439 |
−11.723 |
−0.116 |
0.001 |
| Iron (mg/1000 kcal) |
−0.194 |
0.068 |
−0.327 |
−0.060 |
−0.102 |
0.004 |
| Zinc (mg/1000 kcal) |
−0.149 |
0.047 |
−0.242 |
−0.056 |
−0.110 |
0.002 |
| Copper (mg/1000 kcal) |
−0.013 |
0.008 |
−0.028 |
0.001 |
−0.060 |
0.077 |
| Manganese (mg/1000 kcal) |
−0.002 |
0.041 |
−0.082 |
0.078 |
−0.002 |
0.963 |
| Retinol equivalent (µg/1000 kcal) |
3.548 |
12.663 |
−21.312 |
28.407 |
0.010 |
0.779 |
| Beta carotene equivalent (µg/1000 kcal) |
34.445 |
73.646 |
−110.135 |
179.025 |
0.016 |
0.640 |
| Vitamin B1 (mg/1000 kcal) |
−0.017 |
0.007 |
−0.030 |
−0.003 |
−0.083 |
0.014 |
| Vitamin B2 (mg/1000 kcal) |
−0.030 |
0.015 |
−0.059 |
0.000 |
−0.069 |
0.047 |
| Niacin (mg/1000 kcal) |
−0.570 |
0.154 |
−0.872 |
−0.268 |
−0.128 |
0.000 |
| Vitamin B6 (mg/1000 kcal) |
−0.036 |
0.012 |
−0.058 |
−0.013 |
−0.104 |
0.002 |
| Vitamin B12 (µg/1000 kcal) |
−0.295 |
0.164 |
−0.616 |
0.026 |
−0.065 |
0.071 |
| Vitamin C (mg/1000 kcal) |
−1.530 |
2.014 |
−5.484 |
2.423 |
−0.026 |
0.448 |
| Vitamin D (µg/1000 kcal) |
−0.663 |
0.262 |
−1.178 |
−0.148 |
−0.090 |
0.012 |
| α-tocopherol (mg/1000 kcal) |
−0.175 |
0.073 |
−0.318 |
−0.032 |
−0.086 |
0.017 |
| Vitamin K (µg/1000 kcal) |
−9.473 |
4.788 |
−18.873 |
−0.073 |
−0.071 |
0.048 |
| Folic acid (µg/1000 kcal) |
−6.076 |
3.806 |
−13.549 |
1.396 |
−0.055 |
0.111 |
| Pantothenic acid (mg/1000 kcal) |
−0.137 |
0.051 |
−0.238 |
−0.037 |
−0.089 |
0.008 |
Mixed-effects multivariable linear regression analyses, adjusting for sex, age, solitary eating, skipping breakfast, staying up late, body weight status, and physical inactivity.
In boys, a longer TV viewing time was associated with higher intake of sucrose (p = 0.013) and lower intakes of protein (p = 0.013), calcium (p = 0.045), magnesium (p = 0.029), phosphorus (p = 0.001), zinc (p = 0.005), copper (p = 0.032), vitamin B12 (p = 0.006), and vitamin D (p = 0.004). In girls, higher intake of carbohydrates (p = 0.001) and lower intakes of protein (p < 0.001), fat (p = 0.019), salt equivalent (p = 0.045), potassium (p = 0.041), magnesium (p = 0.001), phosphorus (p = 0.001), iron (p = 0.004), zinc (p = 0.002), vitamin B1 (p = 0.014), vitamin B2 (p = 0.047), niacin (p < 0.001), vitamin B6 (p = 0.002), vitamin D (p = 0.012), alpha-tocopherol (p = 0.017), vitamin K (p = 0.048), and pantothenic acid (p = 0.008).
Longitudinal relationship between PC use time and nutrient intake
The longitudinal relationships between PC use time and nutrient intake are shown in Tables 6 and 7.
Table 6 Longitudinal relationship between total screen time and nutrient intake in boys (N = 359)
| Parameter |
Estimated
value |
Standard
error |
95% confidence interval |
Standerdized estimated value |
p-value |
| Lower |
Upper |
| Energy (kcal) |
136.457 |
55.036 |
28.397 |
244.518 |
0.080 |
0.013 |
| Protein (%E) |
−0.698 |
0.193 |
−1.077 |
−0.318 |
−0.130 |
<0.001 |
| Fat (%E) |
0.163 |
0.488 |
−0.795 |
1.120 |
0.013 |
0.739 |
| Carbohydrates (%E) |
0.480 |
0.589 |
−0.677 |
1.637 |
0.031 |
0.416 |
| Sucrose (%E) |
0.050 |
0.128 |
−0.202 |
0.302 |
0.014 |
0.699 |
| Total dietary fiber (g/1000 kcal) |
−0.229 |
0.120 |
−0.465 |
0.006 |
−0.068 |
0.056 |
| Salt equivalent (g/1000 kcal) |
−0.196 |
0.119 |
−0.429 |
0.038 |
−0.051 |
0.100 |
| Potassium (mg/1000 kcal) |
−86.100 |
24.297 |
−133.806 |
−38.394 |
−0.126 |
<0.001 |
| Calcium (mg/1000 kcal) |
−24.080 |
9.240 |
−42.223 |
−5.937 |
−0.095 |
0.009 |
| Magnesium (mg/1000 kcal) |
−5.992 |
1.756 |
−9.440 |
−2.543 |
−0.119 |
0.001 |
| Phosphorus (mg/1000 kcal) |
−30.120 |
8.791 |
−47.382 |
−12.859 |
−0.123 |
0.001 |
| Iron (mg/1000 kcal) |
−0.174 |
0.067 |
−0.306 |
−0.042 |
−0.095 |
0.010 |
| Zinc (mg/1000 kcal) |
−0.156 |
0.045 |
−0.244 |
−0.067 |
−0.121 |
0.001 |
| Copper (mg/1000 kcal) |
−0.016 |
0.007 |
−0.030 |
−0.003 |
−0.078 |
0.020 |
| Manganese (mg/1000 kcal) |
−0.054 |
0.042 |
−0.137 |
0.029 |
−0.048 |
0.199 |
| Retinol equivalent (µg/1000 kcal) |
−16.115 |
16.709 |
−48.922 |
16.692 |
−0.036 |
0.335 |
| Beta carotene equivalent (µg/1000 kcal) |
−133.744 |
76.247 |
−283.466 |
15.979 |
−0.061 |
0.080 |
| Vitamin B1 (mg/1000 kcal) |
−0.020 |
0.007 |
−0.034 |
−0.007 |
−0.106 |
0.003 |
| Vitamin B2 (mg/1000 kcal) |
−0.044 |
0.015 |
−0.073 |
−0.015 |
−0.102 |
0.003 |
| Niacin (mg/1000 kcal) |
−0.403 |
0.150 |
−0.697 |
−0.109 |
−0.096 |
0.007 |
| Vitamin B6 (mg/1000 kcal) |
−0.037 |
0.011 |
−0.059 |
−0.016 |
−0.117 |
0.001 |
| Vitamin B12 (µg/1000 kcal) |
−0.352 |
0.150 |
−0.646 |
−0.058 |
−0.087 |
0.019 |
| Vitamin C (mg/1000 kcal) |
−6.474 |
2.020 |
−10.440 |
−2.509 |
−0.112 |
0.001 |
| Vitamin D (µg/1000 kcal) |
−0.551 |
0.246 |
−1.034 |
−0.069 |
−0.083 |
0.025 |
| α-tocopherol (mg/1000 kcal) |
−0.083 |
0.077 |
−0.234 |
0.068 |
−0.041 |
0.280 |
| Vitamin K (µg/1000 kcal) |
−5.115 |
4.817 |
−14.573 |
4.344 |
−0.038 |
0.289 |
| Folic acid (µg/1000 kcal) |
−9.358 |
3.950 |
−17.115 |
−1.600 |
−0.081 |
0.018 |
| Pantothenic acid (mg/1000 kcal) |
−0.191 |
0.052 |
−0.292 |
−0.089 |
−0.122 |
<0.001 |
Mixed-effects multivariable linear regression analyses, adjusting for sex, age, solitary eating, skipping breakfast, staying up late, body weight status, and physical inactivity.
Table 7 Longitudinal relationship between total screen time and nutrient intake in boys (N = 381)
| Parameter |
Estimated
value |
Standard
error |
95% confidence interval |
Standerdized estimated value |
p-value |
| Lower |
Upper |
| Energy (kcal) |
12.707 |
52.498 |
−90.360 |
115.774 |
0.008 |
0.809 |
| Protein (%E) |
−0.391 |
0.231 |
−0.844 |
0.062 |
−0.058 |
0.091 |
| Fat (%E) |
0.501 |
0.536 |
−0.552 |
1.554 |
0.034 |
0.350 |
| Carbohydrates (%E) |
−0.183 |
0.658 |
−1.474 |
1.108 |
−0.010 |
0.781 |
| Sucrose (%E) |
0.200 |
0.161 |
−0.116 |
0.515 |
0.044 |
0.215 |
| Total dietary fiber (g/1000 kcal) |
−0.082 |
0.136 |
−0.349 |
0.184 |
−0.022 |
0.544 |
| Salt equivalent (g/1000 kcal) |
−0.093 |
0.143 |
−0.374 |
0.188 |
−0.020 |
0.516 |
| Potassium (mg/1000 kcal) |
−30.680 |
27.397 |
−84.469 |
23.109 |
−0.038 |
0.263 |
| Calcium (mg/1000 kcal) |
−19.194 |
10.201 |
−39.221 |
0.833 |
−0.067 |
0.060 |
| Magnesium (mg/1000 kcal) |
−3.420 |
2.059 |
−7.464 |
0.623 |
−0.056 |
0.097 |
| Phosphorus (mg/1000 kcal) |
−21.278 |
10.282 |
−41.465 |
−1.091 |
−0.072 |
0.039 |
| Iron (mg/1000 kcal) |
−0.062 |
0.077 |
−0.213 |
0.088 |
−0.028 |
0.416 |
| Zinc (mg/1000 kcal) |
−0.125 |
0.053 |
−0.229 |
−0.021 |
−0.080 |
0.019 |
| Copper (mg/1000 kcal) |
−0.017 |
0.008 |
−0.034 |
0.000 |
−0.066 |
0.045 |
| Manganese (mg/1000 kcal) |
−0.048 |
0.046 |
−0.138 |
0.042 |
−0.036 |
0.297 |
| Retinol equivalent (µg/1000 kcal) |
−27.329 |
14.392 |
−55.583 |
0.924 |
−0.067 |
0.058 |
| Beta carotene equivalent (µg/1000 kcal) |
−72.224 |
83.025 |
−235.230 |
90.782 |
−0.030 |
0.385 |
| Vitamin B1 (mg/1000 kcal) |
−0.002 |
0.008 |
−0.017 |
0.013 |
−0.010 |
0.773 |
| Vitamin B2 (mg/1000 kcal) |
−0.031 |
0.017 |
−0.064 |
0.002 |
−0.062 |
0.068 |
| Niacin (mg/1000 kcal) |
0.058 |
0.175 |
−0.286 |
0.401 |
0.011 |
0.741 |
| Vitamin B6 (mg/1000 kcal) |
−0.009 |
0.013 |
−0.035 |
0.017 |
−0.022 |
0.499 |
| Vitamin B12 (µg/1000 kcal) |
−0.179 |
0.185 |
−0.542 |
0.184 |
−0.034 |
0.334 |
| Vitamin C (mg/1000 kcal) |
0.638 |
2.287 |
−3.851 |
5.128 |
0.009 |
0.780 |
| Vitamin D (µg/1000 kcal) |
−0.095 |
0.298 |
−0.681 |
0.491 |
−0.011 |
0.750 |
| α-tocopherol (mg/1000 kcal) |
0.028 |
0.083 |
−0.135 |
0.192 |
0.012 |
0.736 |
| Vitamin K (µg/1000 kcal) |
−3.532 |
5.448 |
−14.228 |
7.164 |
−0.023 |
0.517 |
| Folic acid (µg/1000 kcal) |
−5.509 |
4.277 |
−13.906 |
2.888 |
−0.043 |
0.198 |
| Pantothenic acid (mg/1000 kcal) |
−0.097 |
0.058 |
−0.211 |
0.016 |
−0.054 |
0.092 |
Mixed-effects multivariable linear regression analyses, adjusting for sex, age, solitary eating, skipping breakfast, staying up late, body weight status, and physical inactivity.
In boys, relationships were observed between a longer PC use time and higher intake of energy (p = 0.013) as well as lower intakes of protein (p < 0.001), potassium (p < 0.001), calcium (p = 0.009), magnesium (p = 0.001), phosphorus (p = 0.001), iron (p = 0.010), zinc (p = 0.001), copper (p = 0.020), vitamin B1 (p = 0.003), vitamin B2 (p = 0.003), niacin (p = 0.007), vitamin B6 (p = 0.001), vitamin B12 (p = 0.019), vitamin C (p = 0.001), vitamin D (p = 0.025), folic acid (p = 0.018), and pantothenic acid (p < 0.001). In girls, relationships were observed between a longer PC use time and lower intakes of phosphorus (p = 0.039), zinc (p = 0.019), and copper (p = 0.045).
Longitudinal relationship between MP use time and nutrient intake
The longitudinal relationships between MP use time and nutrient intake are shown in Tables 8 and 9.
Table 8 Longitudinal relationship between total screen time and nutrient intake in girls (N = 359)
| Parameter |
Estimated
value |
Standard
error |
95% confidence interval |
Standerdized estimated value |
p-value |
| Lower |
Upper |
| Energy (kcal) |
265.874 |
54.493 |
158.862 |
372.886 |
0.155 |
<0.001 |
| Protein (%E) |
−0.461 |
0.196 |
−0.845 |
−0.076 |
−0.085 |
0.019 |
| Fat (%E) |
−0.038 |
0.498 |
−1.015 |
0.939 |
−0.003 |
0.939 |
| Carbohydrates (%E) |
0.317 |
0.601 |
−0.864 |
1.497 |
0.021 |
0.599 |
| Sucrose (%E) |
−0.331 |
0.128 |
−0.582 |
−0.081 |
−0.094 |
0.010 |
| Total dietary fiber (g/1000 kcal) |
−0.273 |
0.119 |
−0.507 |
−0.039 |
−0.080 |
0.022 |
| Salt equivalent (g/1000 kcal) |
0.009 |
0.119 |
−0.223 |
0.242 |
0.002 |
0.936 |
| Potassium (mg/1000 kcal) |
−92.380 |
24.388 |
−140.273 |
−44.488 |
−0.134 |
0.000 |
| Calcium (mg/1000 kcal) |
−16.992 |
9.294 |
−35.244 |
1.260 |
−0.067 |
0.068 |
| Magnesium (mg/1000 kcal) |
−2.587 |
1.759 |
−6.041 |
0.868 |
−0.051 |
0.142 |
| Phosphorus (mg/1000 kcal) |
−20.092 |
8.877 |
−37.524 |
−2.659 |
−0.081 |
0.024 |
| Iron (mg/1000 kcal) |
−0.094 |
0.067 |
−0.226 |
0.039 |
−0.051 |
0.165 |
| Zinc (mg/1000 kcal) |
−0.075 |
0.045 |
−0.164 |
0.014 |
−0.058 |
0.098 |
| Copper (mg/1000 kcal) |
−0.008 |
0.007 |
−0.021 |
0.005 |
−0.038 |
0.245 |
| Manganese (mg/1000 kcal) |
−0.065 |
0.043 |
−0.149 |
0.018 |
−0.057 |
0.126 |
| Retinol equivalent (µg/1000 kcal) |
−27.783 |
16.989 |
−61.141 |
5.574 |
−0.061 |
0.102 |
| Beta carotene equivalent (µg/1000 kcal) |
−237.555 |
75.365 |
−385.577 |
−89.533 |
−0.107 |
0.002 |
| Vitamin B1 (mg/1000 kcal) |
−0.022 |
0.007 |
−0.035 |
−0.009 |
−0.114 |
0.001 |
| Vitamin B2 (mg/1000 kcal) |
−0.041 |
0.015 |
−0.070 |
−0.011 |
−0.094 |
0.007 |
| Niacin (mg/1000 kcal) |
−0.370 |
0.150 |
−0.664 |
−0.075 |
−0.087 |
0.014 |
| Vitamin B6 (mg/1000 kcal) |
−0.043 |
0.011 |
−0.065 |
−0.022 |
−0.134 |
<0.001 |
| Vitamin B12 (µg/1000 kcal) |
−0.391 |
0.152 |
−0.689 |
−0.093 |
−0.096 |
0.010 |
| Vitamin C (mg/1000 kcal) |
−7.346 |
2.015 |
−11.303 |
−3.388 |
−0.126 |
0.000 |
| Vitamin D (µg/1000 kcal) |
−0.593 |
0.249 |
−1.081 |
−0.104 |
−0.088 |
0.018 |
| α-tocopherol (mg/1000 kcal) |
−0.097 |
0.078 |
−0.250 |
0.055 |
−0.047 |
0.209 |
| Vitamin K (µg/1000 kcal) |
3.138 |
4.798 |
−6.286 |
12.562 |
0.023 |
0.513 |
| Folic acid (µg/1000 kcal) |
−10.394 |
3.927 |
−18.107 |
−2.681 |
−0.090 |
0.008 |
| Pantothenic acid (mg/1000 kcal) |
−0.136 |
0.052 |
−0.239 |
−0.034 |
−0.086 |
0.009 |
Mixed-effects multivariable linear regression analyses, adjusting for sex, age, solitary eating, skipping breakfast, staying up late, body weight status, and physical inactivity.
Table 9 Longitudinal relationship between total screen time and nutrient intake (N = 381)
| Parameter |
Estimated
value |
Standard
error |
95% confidence interval |
Standerdized estimated value |
p-value |
| Lower |
Upper |
| Energy (kcal) |
−93.459 |
48.173 |
−188.043 |
1.125 |
−0.065 |
0.053 |
| Protein (%E) |
0.074 |
0.212 |
−0.342 |
0.490 |
0.012 |
0.727 |
| Fat (%E) |
1.692 |
0.493 |
0.724 |
2.659 |
0.127 |
0.001 |
| Carbohydrates (%E) |
−1.750 |
0.603 |
−2.935 |
−0.566 |
−0.107 |
0.004 |
| Sucrose (%E) |
0.119 |
0.148 |
−0.172 |
0.410 |
0.029 |
0.421 |
| Total dietary fiber (g/1000 kcal) |
−0.157 |
0.125 |
−0.401 |
0.088 |
−0.045 |
0.208 |
| Salt equivalent (g/1000 kcal) |
0.363 |
0.130 |
0.108 |
0.619 |
0.087 |
0.005 |
| Potassium (mg/1000 kcal) |
−55.862 |
25.026 |
−105.003 |
−6.722 |
−0.076 |
0.026 |
| Calcium (mg/1000 kcal) |
−1.612 |
9.400 |
−20.069 |
16.845 |
−0.006 |
0.864 |
| Magnesium (mg/1000 kcal) |
−1.182 |
1.880 |
−4.874 |
2.510 |
−0.021 |
0.530 |
| Phosphorus (mg/1000 kcal) |
3.178 |
9.441 |
−15.361 |
21.717 |
0.012 |
0.737 |
| Iron (mg/1000 kcal) |
0.002 |
0.070 |
−0.136 |
0.140 |
0.001 |
0.975 |
| Zinc (mg/1000 kcal) |
−0.037 |
0.049 |
−0.133 |
0.058 |
−0.026 |
0.441 |
| Copper (mg/1000 kcal) |
−0.021 |
0.008 |
−0.036 |
−0.006 |
−0.089 |
0.007 |
| Manganese (mg/1000 kcal) |
−0.048 |
0.042 |
−0.130 |
0.034 |
−0.040 |
0.252 |
| Retinol equivalent (µg/1000 kcal) |
−29.135 |
13.275 |
−55.198 |
−3.072 |
−0.078 |
0.029 |
| Beta carotene equivalent (µg/1000 kcal) |
−191.828 |
75.592 |
−340.258 |
−43.398 |
−0.087 |
0.011 |
| Vitamin B1 (mg/1000 kcal) |
−0.009 |
0.007 |
−0.022 |
0.005 |
−0.042 |
0.211 |
| Vitamin B2 (mg/1000 kcal) |
−0.008 |
0.015 |
−0.038 |
0.022 |
−0.018 |
0.603 |
| Niacin (mg/1000 kcal) |
0.184 |
0.160 |
−0.131 |
0.498 |
0.039 |
0.252 |
| Vitamin B6 (mg/1000 kcal) |
−0.012 |
0.012 |
−0.036 |
0.011 |
−0.034 |
0.314 |
| Vitamin B12 (µg/1000 kcal) |
−0.110 |
0.169 |
−0.442 |
0.223 |
−0.023 |
0.517 |
| Vitamin C (mg/1000 kcal) |
−4.183 |
2.094 |
−8.294 |
−0.072 |
−0.069 |
0.046 |
| Vitamin D (µg/1000 kcal) |
0.030 |
0.274 |
−0.508 |
0.568 |
0.004 |
0.912 |
| α-tocopherol (mg/1000 kcal) |
0.119 |
0.077 |
−0.031 |
0.270 |
0.056 |
0.120 |
| Vitamin K (µg/1000 kcal) |
0.691 |
5.014 |
−9.154 |
10.536 |
0.005 |
0.890 |
| Folic acid (µg/1000 kcal) |
−5.900 |
3.902 |
−13.562 |
1.763 |
−0.051 |
0.131 |
| Pantothenic acid (mg/1000 kcal) |
−0.077 |
0.053 |
−0.181 |
0.027 |
−0.048 |
0.145 |
Mixed-effects multivariable linear regression analyses, adjusting for sex, age, solitary eating, skipping breakfast, staying up late, body weight status, and physical inactivity.
A longer MP use time was associated with higher intakes of energy (p < 0.001) as well as lower intakes of protein (p = 0.019), sucrose (0.010), dietary fiber (p = 0.022), potassium (p = 0.001), phosphorus (p = 0.024), beta carotene equivalent (p = 0.002), vitamin B1 (p = 0.001), vitamin B2 (p = 0.007), niacin (p = 0.014), vitamin B6 (p < 0.001), vitamin B12 (p = 0.010), vitamin C (p < 0.001), vitamin D (p = 0.018), folic acid (p = 0.008), and pantothenic acid (p = 0.009) in boys. A longer MP use time was associated with higher intakes of fat (p = 0.001), and salt equivalent (p = 0.005) as well as lower intakes of carbohydrates (p = 0.004), potassium (p = 0.026), copper (p = 0.007), retinol equivalent (p = 0.029), beta carotene equivalent (p = 0.011), and vitamin C (p = 0.046) in girls.
Discussion
While many studies have investigated the relationship between screen-based sedentary behavior and diet, few have examined that between screen-based sedentary behavior, including mobile devices, and nutrient intake in children, particularly using longitudinal data. Therefore, the present study investigated the longitudinal relationship between multiple screen times and nutrient intake in children. Although there have been several studies on this topic, to the best of our knowledge, we are the first to assess the longitudinal relationship between screen time, including mobile devices, and nutrient intake.
The main results of the present study revealed that: (1) a longer total screen time longitudinally correlated with higher intakes of energy and sucrose and lower intakes of protein, dietary fiber, minerals, and vitamins; (2) a longer TV viewing time was associated with higher intakes of carbohydrate and sucrose and lower intakes of protein, minerals, and vitamins; (3) a longer PC use time was associated with higher intakes of energy and lower intakes of protein, minerals, and vitamins; (4) a longer MP use time was associated with higher intakes of energy, fat, and salt equivalent and lower intakes of protein, sucrose, dietary fiber, minerals, and vitamins. The present results suggest that all types of screen time, including MP, and nutrient intake do not occur in isolation. Some types of screen-based behaviors may be more deleterious than others, suggesting that different types of screen-based behaviors may differentially impact diet; however, the present results suggest that all types of screen-based behavior affect nutrient intake.
A previous study showed positive association between total screen time and total calorie intake in girls aged 5–11 years [21]. Our study the association in boys. A previous study [22] revealed a relationship between total screen time and a lower fiber intake. Similarly, the present study showed using longitudinal data that boys with a daily screen time of more than two hours in the three devices were less likely to consume dietary fiber than those being exposed to less than two hours. Moreover, the present results demonstrated that a longer overall screen time was longitudinally associated with higher intake of sucrose in girls and lower intakes of protein, minerals, and vitamins in both sex, which was not reported in previous studies.
Although previous studies from the U.S. and European countries found inverse or negative relationships between TV viewing times and carbohydrate intake [23], we observed a positive longitudinal relationship in girls. Specifically, the consumption of sucrose was more likely to be frequent among boys with a longer TV viewing time, which appears to be consistent with previous findings [24]. A relationship has been reported between a longer TV viewing time and lower protein intake [23]. A negative relationship was observed in both sex in the present study using longitudinal data. Although a study on preschoolers or adolescents reported no correlation between TV viewing times and iron intake [25], we noted a negative relationship in girls in the present study. TV viewing was negatively associated with calcium intake in the aforementioned review [26]. Consistent with previous findings, we found that a longer TV viewing time negatively correlated with calcium intake in boys. A study on Spanish adolescents reported no relationship between TV viewing times and magnesium or zinc intake [25], whereas we noted inverse relationships in children. The same study showed that adolescents with longer TV viewing times were less likely to consume vitamin B6 [25]. We obtained the same results in girls, thereby corroborating these findings with longitudinal data. Although the previous study [25] did not indicate relationships between TV viewing times and intakes of vitamin B1, vitamin B2, niacin, vitamin B12, vitamin D, and vitamin E, we revealed longitudinal and positive relationships for vitamin B12 in boys and vitamin B1, vitamin B2, niacin, vitamin D and vitamin E in girls. Furthermore, negative correlations were observed between TV viewing times and the intakes of phosphorus, and copper, in boys, and potassium phosphorus, vitamin K and pantothenic acid in girls.
Limited information is currently available on the relationship between PC use and nutrient intake. Only one study revealed a relationship between longer PC use times and higher energy intake [27]. Similarly, we herein found that boys using PC >1 hour/day consumed more energy than those using PC <1 hour/day. In addition, we noted that protein, potassium, calcium, magnesium, phosphorus, iron, zinc, copper, vitamin B1, vitamin B2, niacin, vitamin B6, vitamin B12, vitamin C, vitamin D, folic acid, and pantothenic acid were less likely to be consumed by boys and phosphorus, zinc, and copper in girls with longer PC use times based on longitudinal data, which was not reported in previous studies.
To the best of our knowledge, this the first study to investigate the relationship between MP use and nutrient intake, particularly using longitudinal data. We revealed that boys with a longer MP use time were more likely to have higher intakes of energy, and lower intakes of protein, sucrose, dietary fiber, potassium, phosphorus, copper, beta carotene equivalent, vitamin B1, vitamin B2, niacin, vitamin B6, vitamin B12, vitamin C, vitamin D, folic acid, and pantothenic acid. In addition, we showed that girls with a longer MP use time were more likely to have higher intakes of fat, salt equivalent and lower intakes of carbohydrates, potassium, copper, retinol equivalent, beta carotene equivalent, and vitamin C in girls.
A systematic review of the relationship between screen time and health outcomes among children and adolescents provided moderately strong evidence for screen time being strongly associated with obesity [7]. Screen-based sedentary behavior may affect the energy balance and, ultimately, the body weight status [28].
Several mechanisms have been proposed to explain the relationship between screen-based sedentary behavior and dietary intake. One of the probable mechanisms by which screen time affects dietary intake is reduced physical activity and an increased intake of obesogenic foods [17]. Physical activity has been proposed as a stress-induced eating repressor, which may eventually limit the consumption of unhealthy food [18]. However, even when physical inactivity was accounted for, relationships between screen-based sedentary behavior and the intakes of various nutrient persisted.
Another explanation is that YouTube, Facebook, or Instagram on screen devices increase exposure to food advertisements, which may promote an intake of high-calorie low-nutrient foods as a possible mediator. Previous studies on advertising and programming content reported the presence of frequent advertisements that promoted the consumption of high levels of energy, sucrose, fats, salt, and other calorie-dense nutrient-poor foods along with a lack of content for low-calorie, nutrient-dense foods, such as fruit and vegetables [8]. Previous studies demonstrated that food and beverage advertisements may increase the consumption of these items among children [29].
Furthermore, screens may also interfere with the physiological signs of satiety and hunger, resulting in unhealthy food choices with the increased consumption of high-calorie, low-nutrient foods [30]. Eating while watching TV has been associated with a longer time spent eating, suggesting that concurrent TV viewing and eating may contribute to overeating (Alblas et al., 2021). Moreover, recent systematic reviews on children and adolescents showed that eating while watching TV was associated with poorer diet quality, including the more frequent consumption of sugar-sweetened beverages and high-fat, high-sugar foods and fewer fruits and vegetables [31].
Screen time may also be associated with increased levels of stress, which may turn into stress-induced eating [32]. The consumption of sweetened food has been suggested to counteract stress by releasing dopamine, which activates pleasurable and rewarding sensations and improves psychological well-being [33].
Substance cravings, such as an excessive sugar intake, are also regarded as an addiction [34] because highly palatable foods activate the same brain regions responsible for pleasure and rewards as drugs [35].
Another possible explanation is that can be drawn about the relationships between personal characteristics, such as the clustering of unhealthy behaviors [36]. An individual who engages in one unhealthy behavior may experience another unhealthy behavior, which may be linked to negative aspects of their personal characteristics [37]. Children with unfavorable lifestyle profiles regarding screen time may be more prone to the consumption of unhealthier foods and beverages.
Socio economic status might be underlying on the association between screen-based sedentary behavior and nutrient intake. Previously, economic status was revealed to be significantly associated with parent-child sedentary behavior in adolescents [38]. Therefore, present results could be explained by differences of economic status. In this regard, education levels might influence on sedentary behavior [39]. Child should be strongly influenced by their parent’s behavior as well. Then educational status and structure of family might affect both children’s sedentary behavior and diet.
The amount or contents of advertisement, effect on physiological signs of satiety, or stress level might differ depend on screen type, which might lead to different results according to screen type. In addition, the type of activity performed in front of a screen may be of key importance for assessing the relationship between screen time and nutrient intake. A recent study on adults showed a positive relationship between PC use times and a healthier food intake, which is in contrast to the present results on children [40]. A possible explanation is that PC use in adults is mostly related to occupational tasks, which leads to mentally active screen-based behaviors [40]. PC use in children is mostly related to recreation, which leads to mentally passive screen-based behaviors. Therefore, PC usage may exert different effects between children and adults. Future studies are needed to elucidate the underlying mechanisms.
The present results are concerning because the nutrient profile combined with screen-based sedentary behavior contributes to the development of obesity, which may persist into adulthood. Although small daily amounts of screen use are not harmful and may have some benefits [7], limiting screen-based screen behavior and promoting healthy eating need to be considered in combination from a public health perspective. In our sample, 26·4% at baseline and 61·7% in the follow-up were high screen users (≥2 hours/day), indicating that screen time increases with aging. Childhood is a crucial period because lifestyle behaviors are modifiable and generally established during this time and are likely to track into adulthood. Therefore, limiting the use of screen devices to 2 hours is strongly recommended for these age groups.
The strength of the present study is that we conducted a complete survey on children in one town. We also collected questionnaires at high response and follow-up rates. These strengths allowed us to examine the longitudinal relationship between screen time and nutrient intake, excluding selection biases, particularly a non-respondent bias or volunteer bias.
The limitations of the present study were as follows. The self-report assessment of screen times, which was not formally validated, may be vulnerable to recall biases, even though self-report methods of quantifying screen time have been shown to have acceptable reliability and validity [12]. Furthermore, despite the use of a validated and detailed one-month food frequency questionnaire, we cannot exclude possible measurement errors in nutrient intake. In defense of this point, adjustments for energy intake were conducted to reduce bias. The data on economic status, which might confound between sedentary behavior and diet, were not gathered in this study. The data on extracurricular activity, commuting time, or sleeping periods which might steel time to take screen-based sedentary behavior and taking unhealthy diet, were not utilized as well. Furthermore, this study was conducted in a rural town in Japan, which needs to be considered when interpreting and making generalizations from the present study.
Conclusions
The present results revealed that children with longer screen times longitudinally consumed more energy, and less protein, dietary fiber, minerals, and vitamins. Future studies utilizing more detailed data are needed to elucidate these relationships.
Abbreviations
TV
Television
PC
Personal computer
MP
Mobile phone
METs
Metabolic equivalent of task
WHO
World Health Organization
BDHQ
Brief self-administered dietary history questionnaire
BMI
Body mass index
SD
Standard deviation
CI
Confidence interval
Declarations
Ethics approval and consent to participate
Shika study protocols were approved by the Kanazawa University Ethical Committee (No. 1464). Written informed consent was obtained from the guardians of all participants prior to data collection.
Consent for publication
Not applicable.
Availability of data and material
The datasets used and analyzed during this study are not publicly available with the aim of preserving the anonymity of information from participants, but deidentified participant data, study protocol, or informed consent form are available from the corresponding author upon reasonable request after approval of ethical committee.
Competing interests
The authors declare that they have no competing interests.
Funding
This work was supported by a Grant-in-Aid for Scientific Research by the Ministry of Education, Culture, Sport, Science and Technology, Japan, number 20K18959. The funders had no role in the design of the study and collection, analysis, and interpretation of data and in writing the manuscript.
Authors’ contributions
Conception, H.T. (Hiromasa Tsujiguchi) and H.N. conceptualized the work. H.T. (Hiromasa Tsujiguchi) and H.N. designed the work. H.T. (Hiromasa Tsujiguchi) acquired the funding. H.T. (Hiromasa Tsujiguchi) analyzed the data. H.T. (Hiromasa Tsujiguchi), Y.S., A.H., K.S., S.M., M.N., C.T., K.O.P., T.T.T.N., Y.K., Y.S., H.T. (Hirohito Tsuboi), Y.O., T.H., A.S., K.H., T.K., and H.N. interpreted the data. H.T. (Hiromasa Tsujiguchi) wrote the original draft.; and writing – review & editing, Y.S., A.H., K.S., S.M., M.N., C.T., K.O.P., T.T.T.N., Y.K., Y.S., H.T. (Hirohito Tsuboi), Y.O., T.H., A.S., K.H., T.K., and H.N. reviewed and substantively revised the manuscript. All authors read and approved the final manuscript. All authors have agreed both to be personally accountable for the author’s own contributions and to ensure that questions related to the accuracy or integrity of any part of the work.
Acknowledgments
The Shika study was commissioned by Shika town. We would like to thank the study participants who responded to the survey and all of our colleagues at the Department of Environmental and Preventive Medicine, Graduate School of Medical Sciences, Kanazawa University.
References
- 1. Compernolle S, De Cocker K, Teixeira PJ, et al. The associations between domain-specific sedentary behaviours and dietary habits in European adults: a cross-sectional analysis of the SPOTLIGHT survey. BMC Public Health. 2016;16(1):1–9. https://doi.org/10.1186/s12889-016-3708-3.
- 2. Hill D, Ameenuddin N, Chassiakos YR, et al. Media use in school-aged children and adolescents. Pediatrics. 2016;138(5):1–6. https://doi.org/10.1542/peds.2016-2592.
- 3. Argumedo G, López y Taylor JR, Gaytán-González A, et al. Mexico’s 2018 report card on physical activity for children and youth: Full report. Rev Panam Salud Publica/Pan Am J Public Heal. 2020;44:1–8. https://doi.org/10.26633/RPSP.2020.26.
- 4. Couch SC, Saelens BE. Factors Associated with Pediatric Hypertension in Mexico. J Am Diet Assoc. 2009;109(6):992–5. https://doi.org/10.1016/j.jada.2009.03.015.
- 5. Soltero EG, Jáuregui A, Hernandez E, et al. Associations between screen-based activities, physical activity, and dietary habits in Mexican schoolchildren. Int J Environ Res Public Health. 2021;18(13):1–10. https://doi.org/10.3390/ijerph18136788.
- 6. Leech RM, Mcnaughton SA, Timperio A. The clustering of diet, physical activity and sedentary behavior in children and adolescents: a review. Published online 2014:1–9.
- 7. Stiglic N, Viner RM. Effects of screentime on the health and well-being of children and adolescents: A systematic review of reviews. BMJ Open. 2019;9(1). https://doi.org/10.1136/bmjopen-2018-023191.
- 8. Gebremariam MK, Bergh IH, Andersen LF, et al. Are screen-based sedentary behaviors longitudinally associated with dietary behaviors and leisure-time physical activity in the transition into adolescence? Int J Behav Nutr Phys Act. 2013;10:1–8. https://doi.org/10.1186/1479-5868-10-9.
- 9. Statistics Breau of Japan. 2015 Population Census. 2016. https://www.e-stat.go.jp/en/stat-search/files?page=1&layout=datalist&toukei=00200521&tstat=000001080615&cycle=0&tclass1=000001089055&tclass2=000001089056&stat_infid=000031473210.
- 10. Tsujiguchi H, Hori D, Kambayashi Y, et al. Relationship between screen time and nutrient intake in Japanese children and adolescents: A cross-sectional observational study. Environ Health Prev Med. 2018;23(1):1–12. https://doi.org/10.1186/s12199-018-0725-0.
- 11. Tsujiguchi H, Hara A, Miyagi S, et al. Prospective relationship between autistic traits and nutrient intakes among Japanese children: Results of the Shika study. Autism. 2023;27(2):389–401. https://doi.org/10.1177/13623613221097487.
- 12. Bryant MJ, Lucove JC, Evenson KR, Marshall S. Measurement of television viewing in children and adolescents: A systematic review. Obes Rev. 2007;8(3):197–209. https://doi.org/10.1111/j.1467-789X.2006.00295.x.
- 13. Sasaki S, Yanagibori R, Amano K. Self-administered diet history questionnaire developed for health education: a relative validation of the test-version by comparison with 3-day diet record in women. J Epidemiol. 1998;8(4):203–15. https://doi.org/10.2188/jea.8.203.
- 14. Asakura K, Haga M, Sasaki S. Relative validity and reproducibility of a brief-type self-administered diet history questionnaire for Japanese children aged 3–6 years: application of a questionnaire established for adults in preschool children. J Epidemiol. 2015;25(5):341–50. https://doi.org/10.2188/jea.JE20140174.
- 15. Okuda M, Sasaki S, Bando N, et al. Carotenoid, tocopherol, and fatty acid biomarkers and dietary intake estimated by using a brief self-administered diet history questionnaire for older Japanese children and adolescents. J Nutr Sci Vitaminol (Tokyo). 2009;55(3):231–41. https://doi.org/10.3177/JNSV.55.231.
- 16. Kobayashi S, Honda S, Murakami K, et al. Both Comprehensive and Brief Self-Administered Diet History Questionnaires Satisfactorily Rank Nutrient Intakes in Japanese Adults. J Epidemiol. 2012;22(2):151–9. https://doi.org/10.2188/jea.JE20110075.
- 17. Shqair AQ, Pauli LA, Costa VPP, Cenci M, Goettems ML. Screen time, dietary patterns and intake of potentially cariogenic food in children: A systematic review. J Dent. 2019;86(June):17–26. https://doi.org/10.1016/j.jdent.2019.06.004.
- 18. Leow S, Jackson B, Alderson JA, Guelfi KJ, Dimmock JA. A role for exercise in attenuating unhealthy food consumption in response to stress. Nutrients. 2018;10(2):1–19. https://doi.org/10.3390/nu10020176.
- 19. Pearson N, Biddle SJH. Sedentary behavior and dietary intake in children, adolescents, and adults: A systematic review. Am J Prev Med. 2011;41(2):178–88. https://doi.org/10.1016/j.amepre.2011.05.002.
- 20. Rosner B. Fundamentals of Biostatistics. 5th ed. Pacific Grove; 2000.
- 21. Danielsen YS, Júlíusson PB, Nordhus IH, et al. The relationship between life-style and cardio-metabolic risk indicators in children: The importance of screen time. Acta Paediatr Int J Paediatr. 2011;100(2):253–9. https://doi.org/10.1111/j.1651-2227.2010.02098.x.
- 22. Zabinski MF, Norman GJ, Sallis JF, Calfas KJ, Patrick K, Zabinski MF. Patterns of Sedentary Behavior Among Adolescents. Health Psychol. 2007;26(1):113–20. https://doi.org/10.1037/0278-6133.26.1.113.
- 23. Miller SA, Taveras EM, Rifas-Shiman SL, Gillman MW. Association between television viewing and poor diet quality in young children. Int J Pediatr Obes. 2008;3(3):168–76. https://doi.org/10.1080/17477160801915935.
- 24. Pearson N, Biddle SJH, Hobbs M, Pearson N, Foster PJ, Biddle SJH. Sedentary behaviour and diet across the lifespan: an update systematic review. Br J Sports Med. 2014;49(2):178–88. https://doi.org/10.1016/j.amepre.2011.05.002.
- 25. Ortega RM, Andrés P, Requejo AM, López-Sobaler AM, Redondo MR, González-Fernández M. Influence of the time spent watching television on the dietary habits, energy intake and nutrient intake of a group of Spanish adolescents. Nutr Res. 1996;16(9):1467–70. https://doi.org/10.1016/0271-5317(96)00159-5.
- 26. Ford C, Ward D, White M. Television viewing associated with adverse dietary outcomes in children ages 2–6. Obes Rev. 2012;13(12):1139–47. https://doi.org/10.1111/j.1467-789X.2012.01028.x.
- 27. Utter J, Neumark-Sztainer D, Jeffery R, Story M. Couch potatoes or French fries: Are sedentary behaviors associated with body mass index, physical activity, and dietary behaviors among adolescents? J Am Diet Assoc. 2003;103(10):1298–305. https://doi.org/10.1016/S0002-8223(03)01079-4.
- 28. Halford JCG, Boyland EJ, Hughes G, Oliveira LP, Dovey TM. Beyond-brand effect of television (TV) food advertisements/commercials on caloric intake and food choice of 5–7-year-old children. Appetite. 2007;49(1):263–7. https://doi.org/10.1016/j.appet.2006.12.003.
- 29. Fleming-Milici F, Harris JL, Sarda V, Schwartz MB. Amount of Hispanic Youth Exposure to Food and Beverage Advertising on Spanish-and English-Language Television Original Investigation 723. JAMA Pediatr. 2013;167(8):723–30. https://doi.org/10.1001/jamapediatrics.2013.137.
- 30. Craigie AM, Lake AA, Kelly SA, Adamson AJ, Mathers JC. Tracking of obesity-related behaviours from childhood to adulthood: A systematic review. Maturitas. 2011;70(3):266–84. https://doi.org/10.1016/j.maturitas.2011.08.005.
- 31. Kanellopoulou A, Diamantis DV, Notara V, Panagiotakos DB. Extracurricular Sports Participation and Sedentary Behavior in Association with Dietary Habits and Obesity Risk in Children and Adolescents and the Role of Family Structure: a Literature Review. Curr Nutr Rep. 2021;10(1). https://doi.org/10.1007/S13668-021-00352-6.
- 32. Cartanyà-Hueso À, González-Marrón A, Lidón-Moyano C, Garcia-Palomo E, Carlos Martín-Sánchez J, Martínez-Sánchez JM. Association between Leisure Screen Time and Junk Food Intake in a Nationwide Representative Sample of Spanish Children (1–14 Years): A Cross-Sectional Study. Published online 2021. https://doi.org/10.3390/healthcare9020228.
- 33. Cawley EI, Park S, Rot MAH, et al. Dopamine and light: Dissecting effects on mood and motivational states in women with subsyndromal seasonal affective disorder. J Psychiatry Neurosci. 2013;38(6):388–97. https://doi.org/10.1503/jpn.120181.
- 34. Ahmed SH, Guillem K, Vandaele Y. Sugar addiction: Pushing the drug-sugar analogy to the limit. Curr Opin Clin Nutr Metab Care. 2013;16(4):434–9. https://doi.org/10.1097/MCO.0B013E328361C8B8.
- 35. Volkow ND, Wang GJ, Fowler JS, Tomasi D, Baler R. Food and drug reward: Overlapping circuits in human obesity and addiction. Curr Top Behav Neurosci. 2011;11:1–24. https://doi.org/10.1007/7854_2011_169/COVER.
- 36. Leme ACB, Ferrari G, Fisberg RM, et al. Co-occurrence and clustering of sedentary behaviors, diet, sugar-sweetened beverages, and alcohol intake among adolescents and adults: The latin american nutrition and health study (elans). Nutrients. 2021;13(6). https://doi.org/10.3390/nu13061809.
- 37. Dieteren CM, Brouwer WBF, Van Exel J. How do combinations of unhealthy behaviors relate to attitudinal factors and subjective health among the adult population in the Netherlands? BMC Public Health. 2020;20(1):1–14. https://doi.org/10.1186/S12889-020-8429-Y/TABLES/10.
- 38. Mesquita ED de L, Tebar WR, Correia DCQ, et al. Physical activity and sedentary behaviour of adolescents and their parents: a specific analysis by sex and socioeconomic status. Arch Public Health. 2023;81(1):1–9. https://doi.org/10.1186/s13690-023-01185-1.
- 39. Prince SA, Roberts KC, Melvin A, Butler GP, Thompson W. Gender and education differences in sedentary behaviour in Canada: An analysis of national cross-sectional surveys. BMC Public Health. 2020;20(1):1–17. https://doi.org/10.1186/s12889-020-09234-y.
- 40. Bello NT, Raynor H, Lujan-Barroso L, et al. Increased Screen Time Is Associated With Alcohol Desire and Sweetened Foods Consumption During the COVID-19 Pandemic. Front Nutr. 2021;1:630586. https://doi.org/10.3389/fnut.2021.630586.