Abstract
Background: The acute effects of temperature and air pollution on mortality are well-known environmental factors that have been receiving more recognition lately. However, the health effects resulting from the interaction of air pollution and temperature remain uncertain, particularly in cities with low levels of pollution. This study aims to examine the modification effects of particulate matter with a diameter of 2.5 µm or less (PM2.5) and ozone (O3) on the association between temperature and mortality.
Methods: We collected the daily number of all-cause, cardiovascular, and respiratory mortality from 20 major cities in Japan from 2012–2018. We obtained meteorological data from the Japan Meteorological Agency and air pollution data from the National Institute for Environmental Studies. We conducted analyses using a quasi-Poisson regression model with a distributed lag non-linear model for temperature in each city and subsequently performed a random-effects meta-analysis to derive average estimates.
Results: We found that high levels of O3 might positively modify the mortality risk of heat exposure, especially for cardiovascular diseases. Subgroups such as the elderly and females were susceptible. We did not observe consistent evidence of effect modification by PM2.5, including effect modification on cold by both pollutants.
Conclusion: PM2.5 and O3 may positively modify the short-term association between heat and mortality in the urban areas of Japan. These results highlight the need for public health policies and interventions to address the collective impacts of both temperature and air pollution.
Background
Climate change and air pollution are two main environmental challenges that affect human health. The increasing incidence and intensity of extreme temperature events, for example, heat waves and cold spells [1], contribute to excess mortality in many regions of the world [2–8]. Simultaneously, exposure to fine particulate matter (PM2.5) and ozone (O3), the principal constituents of urban air pollution, has also been linked to increased mortality and morbidity across various diseases [9–12]. However, the combined impacts of temperature and air pollution on mortality are not well understood, especially in urban areas where both factors may exhibit substantial spatial and temporal variations.
Temperature and air pollutants are often examined together in epidemiological studies, where one is controlled for the other as a confounding factor [13–15]. However, literature that focuses on the effect modification by air pollutants is relatively sparse in number and geographical scope [16–22], with fewer yet exploring the possible modification effects of PM2.5 and O3 [20, 22, 23]. Moreover, comparing these modification effects across studies proves challenging because of the variations in the country's climate, air pollution levels, as well as population characteristics.
Over the years, the yearly mean temperature in Japan has risen by 1.24 °C per century between 1898 and 2019. Days with very high temperatures (≥30 °C or ≥35 °C) have also increased significantly [24]. The annual mean temperature in Japan is projected to continue rising in the future, leading to an increase in hot days and associated health impacts, including heatstroke or cold spells, and additional mortality related to heat and cold [24, 25]. The PM2.5 concentration in Japan has been decreasing over the years; however, the trend of O3 seems to be increasing [26]. Although a previous Multi-Country Multi-City (MCC) Collaborative Research Network study has estimated the effect modification of PM2.5 and O3 on temperature, they focused only on the effect modification during high temperature [20]. Coupled with the rapidly urbanized cities, Japan provides a suitable study setting to look at the modifying effect of PM2.5 and O3 on both low and high-temperature-mortality associations. Addressing this uncertainty is crucial for shaping policy decisions aiming to improve air quality amid ongoing climate change. Therefore, we aim to investigate the potential effect modification of PM2.5 and O3 on the temperature and mortality association in urban centers of Japan. In addition, the consideration of variations in sex, age, and cause of death could further elucidate the complex interplay between air pollution on temperature [17, 27, 28].
Methods
Data collection
We collected daily mortality data from January 1st, 2012, to December 31st, 2018, encompassing 20 government ordinance-designated cities in Japan consisting of the date of death, cause of death (all causes, cardiovascular (International Classification of Diseases 10th revision (ICD-10): I00–I99), and respiratory causes (ICD-10: J00–J99)), age, and sex from Health, Labor, and Welfare. These cities are presented in Fig. 1. We also collected meteorological and air pollution data from the Japan Meteorological Agency and the National Institute for Environmental Studies (NIES), respectively. We identified monitoring stations in each city and extracted the daily mean temperatures, relative humidity, PM2.5 averages, and maximum 8-hour moving average oxidants. The term “photochemical oxidant” has previously been used in the context of air quality standards in Japan. However, in recent years, there has been a transition of methodology at the monitoring stations from measuring oxidants using the absorption photometry method to measuring ozone using the UV absorption method [29]. Therefore, this paper consistently employs the term ozone (O3) for effect modification analysis. We averaged data from multiple stations within the same city. The PM2.5 measurement period was shorter for some cities. We imputed missing air pollutant data, which accounted for less than 1%, using centered 3-day moving averages.

We conducted a two-stage analysis to estimate the temperature-mortality association and its modification by air pollution in each city, followed by a random-effects meta-analysis to pool the results across cities.
In the first stage, we utilized a quasi-Poisson regression model with a distributed lag non-linear model (DLNM) to capture the non-linear and delayed effects of temperature in each city [30]. This approach allows us to assess both the immediate effects of high temperatures and the delayed effects of low temperatures that can last for several weeks [15, 31, 32]. We used a quadratic B-spline with one knot at the 75th percentile for temperature, based on previous studies that suggested a J-shaped temperature-mortality relationship, with the minimum mortality temperature around the 70th–80th percentile [33]. We used a 21-day lag period with 3 equally spaced internal knots at the log scale for the delayed effects.
To examine the effect modification by air pollutants, we introduced an interaction term between temperature and a binary variable indicating high or low levels of air pollutants. We defined high level as above the 75th percentile of daily concentrations across all 20 cities, and low level as below or equal to this threshold. This way, we could compare the temperature-mortality association under different air pollution conditions.
We controlled seasonality and long-term trends, day of the week, and air pollutant levels. The model is as follows:
| \begin{equation*}
Y_{t} \sim \textit{Poisson}(\mu_{t})
\end{equation*}
|
| \begin{align}
\mathit{log}[E(Y_{t})] & = \alpha + \beta \textit{temp}_{t,l} + \delta \textit{pol}_{\textit{cat},t} + \varepsilon \textit{temp}_{t,l} \times \textit{pol}_{\textit{cat},t} \\
&\quad+ \textit{ns}(\textit{date}_{t},7 \times \textit{year}) + \zeta \textit{dow}_{t} + \lambda \textit{pol}_{01,t}
\end{align}
| (1) |
where E(Yt) is the expected number of mortality at day t; tempt,l is a crossbasis function of temperature on day t with a lag period l; polcat,t is an indicator variable representing a high or low level of the air pollutant (PM2.5 and O3) categorized based on the 75th percentile cut-off; datet is time with 7 degrees of freedom (dfs) per year smoothed using a natural cubic spline ns; and dowt is the day of the week; pol01,t is the 2-day moving average of air pollutant concentrations. The dfs for date and temperature were selected based on the lowest QAIC value.
In the second stage, we pooled the first-stage results in each city using a random-effects meta-analysis to obtain an average association. We present the results as relative risks (RR) and 95% confidence intervals (CIs). To assess the effects of extreme temperatures, we calculated RR at the 1st percentile of temperature (T01) relative to the 10th percentile of temperature (T10) for extreme cold, and RR at the 99th percentile of temperature (T99) relative to the 90th percentile of temperature (T90) for extreme heat.
Significance test for the presence and absence of effect modification
We examined whether there are significant differences between estimated values during high and low air pollutant concentration days. The following equation (Eq. 2) was used to calculate 95% CIs to test whether differences between estimated values for high/low concentration days are statistically significant followed by the presence or absence of effect modification [34, 35].
| \begin{equation}
Q_{1} - Q_{2} \pm 1.96\sqrt{\mathit{SE}_{1}{}^{2} + \mathit{SE}_{2}{}^{2}}
\end{equation}
| (2) |
Where Q1 and Q2 represent estimated values for the two categories (i.e., high-concentration and low-concentration days), and SE1 and SE2 are the standard deviations of each estimate. The p-values lower than the 5% alpha level are considered statistically significant.
We performed additional stratified analyses by sex and age. For age stratification, we used two categories: “early elderly” (those aged ≥65 and ≤74 years) and “late elderly” (those aged ≥75 years), given the increased susceptibility among the elderly population. We performed sensitivity analysis by using varying threshold values for defining the air pollution cut-off from the 50th to the 90th percentile [16, 17, 19]. We assessed the heterogeneity across the cities using the I2 test and Cochran Q test for heterogeneity [36]. We performed the analysis in R (version 4.0.0) using dlnm, and mvmeta packages [30, 33].
Results
Table 1 shows the frequency and proportion of mortality by different causes, genders, and age groups from 2012–2018. The total number of deaths was 1,674,002, of which 25% were from cardiovascular diseases and 15.2% were from respiratory diseases. Slightly more than half of the cases (52.6%) were male. Most of the deaths (87.8%) occurred among the elderly population aged ≥65 years old, with 16.7% aged between 65 and 74 years, and 71.1% aged ≥75 years. A city-wise breakdown of the daily number and proportion of deaths is presented in Supplementary Table S1.
Table 1 Frequency (N) and proportion from total deaths (%) during 2012–2018.
| Outcome variables |
Frequency (N) |
Proportion (%) |
| Cause of mortality |
|
|
| All-cause mortality |
1,674,002 |
100 |
| Cardiovascular mortality |
419,178 |
25.0 |
| Respiratory mortality |
254,343 |
15.2 |
| Gender |
|
|
| Male |
880,293 |
52.6 |
| Female |
793,709 |
47.4 |
| Age group |
|
|
| Early elderlya |
279,153 |
16.7 |
| Late elderlyb |
1,191,052 |
71.1 |
a Aged between 65–74 years old
b Aged more than 75 years old
Table 2 shows the descriptive summary for temperature, PM2.5, and O3. The mean temperature across the cities was 16.1 °C, with a range from −1.5 to 32.1 °C. The mean PM2.5 and O3 was 13.9 µg/m3 and 41.2 ppb respectively, while the 75th percentile of PM2.5 and O3 was 17.8 µg/m3 and 50.4 ppb, respectively. We used the latter as thresholds to define high or low levels of air pollution. Some cities in the Kanto region (i.e., Saitama, Chiba, Yokohama, Kawasaki, and Sagamihara) had very high levels of O3 (≥100 ppb) during the study period.
Table 2 Descriptive summary for temperature, PM
2.5, and ozone during the study period 2012–2018.
| City |
Temperature (°C) |
PM2.5 (µg/m3) |
O3 (ppb) |
| Mean (sd) |
Min |
P25 |
P75 |
Max |
Mean (sd) |
Min |
P25 |
P75 |
Max |
Mean (sd) |
Min |
P25 |
P75 |
Max |
| Sapporo |
9.5 (9.7) |
−9.2 |
0.5 |
18.1 |
28 |
9 (6) |
0 |
4.9 |
11.5 |
64.8 |
33.3 (10.3) |
7.1 |
26.5 |
39.1 |
82.4 |
| Sendai |
13.2 (8.5) |
−3.7 |
5.1 |
20.5 |
30.9 |
11.3 (7) |
0 |
6.3 |
14.8 |
61 |
39.1 (11.7) |
7 |
31.8 |
45.9 |
90.9 |
| Saitama |
15.7 (8.6) |
−2.3 |
7.5 |
22.9 |
32.7 |
12.4 (7.2) |
0 |
7.2 |
16.3 |
52.2 |
41.8 (17.4) |
2.7 |
29.9 |
52 |
129.3 |
| Chiba |
16.6 (7.9) |
0.3 |
9.3 |
22.9 |
32.1 |
11.9 (7.1) |
0.7 |
6.7 |
15.4 |
50 |
40.4 (14.8) |
3.7 |
30.5 |
49.8 |
104.7 |
| Yokohama |
16.6 (7.8) |
0.3 |
9.3 |
22.9 |
32.2 |
15.3 (8.2) |
0 |
9.9 |
19.3 |
59.6 |
38.9 (17.1) |
1.9 |
26.7 |
49.8 |
137 |
| Kawasaki |
16.7 (7.7) |
0.3 |
9.5 |
22.9 |
32.2 |
13.3 (5) |
0 |
8.2 |
16.7 |
53.9 |
41.7 (17.2) |
3.8 |
29.6 |
52.3 |
139.8 |
| Sagamihara |
16.7 (7.7) |
0.3 |
9.5 |
22.9 |
32.2 |
12.1 (7.7) |
0 |
6.8 |
15.9 |
59.6 |
40.5 (17.3) |
4.4 |
28.1 |
51.4 |
126.2 |
| Niigata |
14.1 (8.7) |
−2.8 |
5.9 |
21.9 |
33 |
10.5 (7.3) |
0 |
5.5 |
13.2 |
86.6 |
44 (11.6) |
12.7 |
36.7 |
49.7 |
101.2 |
| Shizuoka |
17.1 (7.5) |
1.7 |
10.2 |
23.4 |
31.2 |
11.1 (6.7) |
0.6 |
6.4 |
14 |
47.8 |
42.8 (14.2) |
8.8 |
32.8 |
52.7 |
95.6 |
| Hamamatsu |
17 (7.8) |
0 |
9.8 |
23.4 |
32.6 |
11.2 (6.9) |
0 |
6.4 |
14.3 |
49.4 |
42.2 (14.2) |
8.9 |
32.5 |
51.2 |
88.4 |
| Nagoya |
16.4 (8.6) |
−1.1 |
8.2 |
23.7 |
33.3 |
14.3 (8.3) |
0 |
8.4 |
18.5 |
69.3 |
42.1 (15.6) |
1.8 |
31.2 |
52.6 |
97.5 |
| Kyoto |
16.4 (8.8) |
−0.6 |
8.1 |
23.9 |
32.6 |
12.8 (7.2) |
0.7 |
7.7 |
16.4 |
50.7 |
41.9 (15.3) |
2.7 |
31.8 |
50.3 |
106.5 |
| Osaka |
17.1 (8.4) |
0.1 |
9.2 |
24.2 |
32.7 |
15.8 (8.7) |
0 |
9.3 |
20.6 |
64.2 |
39.6 (15.6) |
2.8 |
28.7 |
49.6 |
107.1 |
| Sakai |
16.8 (8.4) |
−0.2 |
9 |
23.9 |
32.5 |
17.6 (9.1) |
1.6 |
11 |
22.2 |
73.9 |
40.6 (15.6) |
3.1 |
29.5 |
50.4 |
100.6 |
| Kobe |
17.1 (8.3) |
−0.8 |
9.4 |
24.1 |
32.5 |
13.5 (7.4) |
0.1 |
8.1 |
17.3 |
57.5 |
41.8 (14.3) |
6.6 |
31.8 |
50.5 |
96.7 |
| Okayama |
16.3 (8.6) |
−2.2 |
8 |
23.6 |
32.3 |
15.7 (8.3) |
0.5 |
9.6 |
20.1 |
56 |
41.5 (14.9) |
3.6 |
31.6 |
50.2 |
94.6 |
| Hiroshima |
16.6 (8.5) |
−2.2 |
8.7 |
23.8 |
32 |
15.5 (8.2) |
1.9 |
9.5 |
19.9 |
66.1 |
43.2 (16.7) |
2.4 |
31.9 |
53.6 |
98.9 |
| Kitakyushu |
16.8 (8) |
−2.7 |
9.5 |
23.4 |
31.5 |
20.7 (9.9) |
3.7 |
13.5 |
26 |
78.2 |
42.2 (14) |
6.4 |
33.3 |
50.4 |
102.8 |
| Fukuoka |
17.5 (8) |
−2 |
10.3 |
23.9 |
32.8 |
16.5 (9.1) |
0.8 |
10 |
21 |
72.4 |
43.4 (14.6) |
5.7 |
33.9 |
52.3 |
105.5 |
| Kumamoto |
17.3 (8.2) |
−3 |
9.8 |
24.1 |
31.9 |
16.4 (9.2) |
0.3 |
9.5 |
21.8 |
66 |
43.6 (15.4) |
3.6 |
33.3 |
53.1 |
101.7 |
| |
| Overall |
16.1 (8.5) |
−9.2 |
8.5 |
23.1 |
33.3 |
13.9 (8.4) |
0.0 |
7.8 |
18.0 |
86.6 |
41.2 (15.2) |
1.8 |
30.9 |
50.3 |
139.8 |
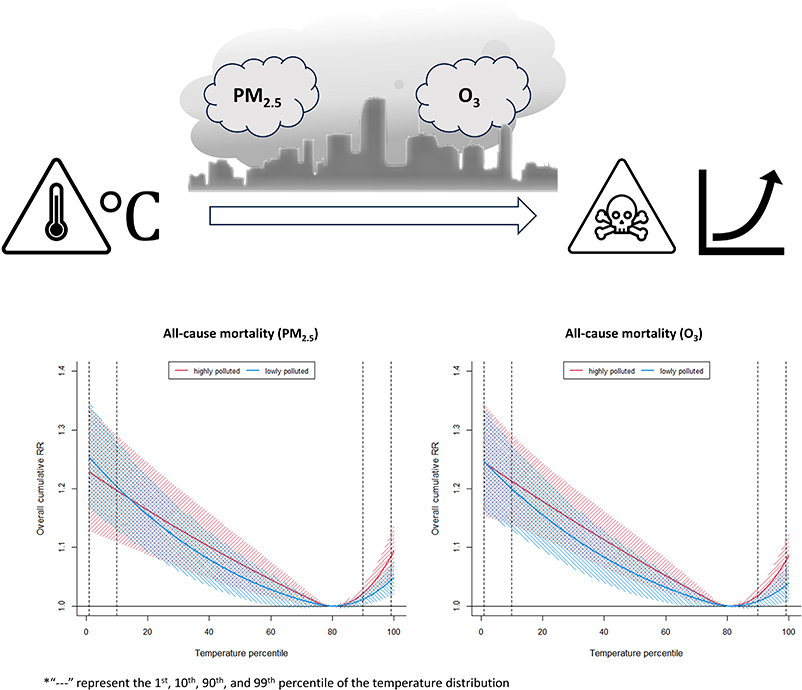
Figure 2 shows the pooled results for all-cause mortality. We found a J-shaped association for temperature mortality with the lowest mortality risk approximately at the 80th percentile of the temperature distribution and both extreme low and high temperatures increase the mortality risk. In general, we did not observe a significant modifying effect of air pollution on the association between temperature and mortality, as the temperature curves for high and low air pollutant levels mostly overlap for both PM2.5 and O3. The city-specific results of effect modification by PM2.5 and O3 are shown in Supplementary Fig. S1 & Fig. S2, respectively, while the overall temperature association without effect modification is shown in Supplementary Fig. S3.

Table 3 shows the pooled RRs and 95% CIs for extreme cold (T01 relative to T10) and heat (T99 relative to T90) by air pollutant level. Different cut-off percentiles ranging from the 50th to the 90th were used to classify low or high air pollution levels. When the 75th percentile cut-off was used, the RRs for extreme cold were 1.03 (95% CI: 1.01, 1.04) and 1.04 (95% CI: 1.03, 1.06) on days with high and low PM2.5, respectively, but the difference is not statistically significant (p > 0.1). Similarly, for O3, the RRs for extreme cold are not statistically different between high and low O3 days. When different percentiles were used for the cut-off, we were not able to observe consistent evidence of effect modification by both air pollutants on extreme cold. On the other hand, PM2.5 and O3 may modify mortality risk associated with extreme heat, particularly O3, which showed strong differences between low and high pollutant levels at different percentile cut-off values (p < 0.05) (Table 3, Supplemental Fig. S4). Nonetheless, at 75th percentile cut-off, the RRs for extreme heat are 1.06 (95% CI: 1.04, 1.09) and 1.03 (95% CI: 1.02, 1.05) on days with high and low PM2.5, respectively, with weak evidence of a difference (0.05 < p < 0.10). The RR for extreme heat appears slightly higher when O3 is high than when it is low (1.06 [95% CI: 1.03, 1.08] vs. 1.03 [95% CI: 1.01, 1.05]), despite weak evidence of a difference (0.05 < p < 0.10). As for the city-specific associations, we could only see a significant difference in the RR for extreme heat modified by PM2.5 for Sapporo city (0.75 [95% CI: 0.60, 0.95] vs. 0.97 [95% CI: 0.92, 1.02]), and Hiroshima city (1.17 [95% CI: 1.06, 1.29] vs. 1.03 [95% CI: 0.97, 1.11]). The city-specific results for effect modification on extreme cold and extreme heat can be found in Supplementary Table S2 and Table S3, respectively.
Table 3 Relative Risk (95% CI) of mortality attributable to extreme cold or extreme heat by strata of air pollutants representing low and high concentrations determined using different cut-off percentiles.
| Cut-off percentile |
Extreme cold (1st vs. 10th percentile) |
| Effect modification by PM2.5 |
Effect modification by O3 |
| Low concentration days |
High concentration days |
|
Low concentration days |
High concentration days |
|
| P75 |
1.042 (1.025, 1.058) |
1.026 (1.01, 1.043) |
|
1.038 (1.022, 1.054) |
1.026 (1.006, 1.048) |
|
| P50 |
1.043 (1.026, 1.061) |
1.032 (1.015, 1.048) |
|
1.045 (1.03, 1.062) |
1.025 (1.007, 1.043) |
|
| P60 |
1.044 (1.027, 1.061) |
1.027 (1.01, 1.045) |
|
1.044 (1.027, 1.06) |
1.016 (0.999, 1.033) |
** |
| P70 |
1.043 (1.026, 1.06) |
1.025 (1.009, 1.042) |
|
1.04 (1.024, 1.056) |
1.017 (0.998, 1.036) |
* |
| P80 |
1.04 (1.024, 1.057) |
1.028 (1.011, 1.045) |
|
1.038 (1.022, 1.054) |
1.029 (1.003, 1.055) |
|
| P90 |
1.039 (1.023, 1.055) |
1.029 (1.006, 1.051) |
|
1.039 (1.023, 1.055) |
1.019 (0.971, 1.069) |
|
| Cut-off percentile |
Extreme heat (99th vs. 90th percentile) |
| Effect modification by PM2.5 |
Effect modification by O3 |
| Low concentration days |
High concentration days |
|
Low concentration days |
High concentration days |
|
| P75 |
1.032 (1.015, 1.050) |
1.061 (1.035, 1.088) |
* |
1.027 (1.008, 1.046) |
1.057 (1.034, 1.081) |
* |
| P50 |
1.035 (1.013, 1.058) |
1.047 (1.028, 1.067) |
|
1.020 (1.000, 1.040) |
1.062 (1.043, 1.081) |
** |
| P60 |
1.029 (1.010, 1.049) |
1.059 (1.038, 1.081) |
* |
1.019 (1.000, 1.038) |
1.070 (1.050, 1.091) |
** |
| P70 |
1.028 (1.011, 1.047) |
1.067 (1.038, 1.096) |
** |
1.023 (1.004, 1.043) |
1.068 (1.046, 1.091) |
** |
| P80 |
1.035 (1.018, 1.053) |
1.056 (1.025, 1.089) |
|
1.031 (1.012, 1.051) |
1.054 (1.028, 1.080) |
|
| P90 |
1.036 (1.019, 1.054) |
1.082 (1.033, 1.132) |
* |
1.031 (1.013, 1.051) |
1.087 (1.046, 1.131) |
** |
* 0.05 < p < 0.1 for difference between strata of effect modifier
** p < 0.05 for difference between strata of effect modifier
For the effect of extreme cold, we could not see any effect modification by PM2.5 or O3 in any of the subgroups (Table 4). However, for the effect of extreme heat, we found a possible strong effect modification by O3 in the subgroup for cardiovascular mortality (p < 0.05), and a possible weak effect modification by PM2.5 and O3 among the females and elderly aged over 75 (0.05 < p < 0.1) (Table 5). Our test for heterogeneity showed that the results across the cities have low heterogeneity with an I2 value of <30% and a Cochran’s Q p-value of <0.05 (Supplemental Table S4).
Table 4 Relative Risk (95% CI) attributable to extreme cold by pollution levels and subgroup
| Extreme cold (1st vs. 10th percentile) |
| Attributes |
Effect modification by PM2.5 |
Effect modification by O3 |
| Low concentration days |
High concentration days |
Low concentration days |
High concentration days |
| Cause of mortality |
|
|
|
|
| Cardiovascular |
1.09 (1.06, 1.12) |
1.07 (1.04, 1.11) |
1.08 (1.05, 1.11) |
1.06 (1.02, 1.10) |
| Respiratory |
1.01 (0.97, 1.04) |
1.00 (0.96, 1.04) |
1.00 (0.97, 1.04) |
0.97 (0.92, 1.03) |
| Gender |
|
|
|
|
| Male |
1.05 (1.02, 1.07) |
1.03 (1.01, 1.06) |
1.04 (1.02, 1.07) |
1.03 (1.00, 1.06) |
| Female |
1.04 (1.02, 1.06) |
1.02 (0.99, 1.04) |
1.04 (1.01, 1.06) |
1.02 (0.99, 1.05) |
| Age group |
|
|
|
|
| 65 to 74 years |
1.06 (1.03, 1.09) |
1.04 (1.00, 1.08) |
1.06 (1.03, 1.09) |
1.04 (0.99, 1.10) |
| ≥75 years |
1.04 (1.02, 1.06) |
1.023 (1.00, 1.05) |
1.04 (1.02, 1.06) |
1.03 (1.00, 1.05) |
Table 5 Relative Risk (95% CI) attributable to extreme heat by pollution levels and subgroup
| Extreme heat (99th vs. 90th percentile) |
| Attributes |
Effect modification by PM2.5 |
Effect modification by O3 |
| Low concentration days |
High concentration days |
|
Low concentration days |
High concentration days |
|
| Cause of mortality |
|
|
|
|
|
|
| Cardiovascular |
1.05 (1.02, 1.09) |
1.05 (1.00, 1.11) |
|
1.04 (1.01, 1.08) |
1.11 (1.06, 1.17) |
** |
| Respiratory |
1.05 (1.00, 1.09) |
1.06 (0.98, 1.14) |
|
1.03 (0.99, 1.08) |
1.09 (1.03, 1.15) |
|
| Gender |
|
|
|
|
|
|
| Male |
1.04 (1.02, 1.06) |
1.06 (1.03, 1.10) |
|
1.04 (1.01, 1.06) |
1.05 (1.02, 1.09) |
|
| Female |
1.02 (0.99, 1.05) |
1.06 (1.03, 1.10) |
* |
1.02 (0.99, 1.05) |
1.06 (1.03, 1.10) |
* |
| Age group |
|
|
|
|
|
|
| 65 to 74 years |
1.06 (1.02, 1.10) |
1.07 (1.01, 1.13) |
|
1.05 (1.01, 1.08) |
1.07 (1.02, 1.13) |
|
| ≥75 years |
1.03 (1.01, 1.05) |
1.07 (1.04, 1.10) |
* |
1.03 (1.00, 1.05) |
1.06 (1.03, 1.09) |
* |
* 0.05 < p < 0.1 for the difference between strata of effect modifier
** p < 0.05 for the difference between strata of effect modifier
Discussion
In this study, we investigated the modifying role of PM2.5 and O3 on the short-term association between temperature and mortality in 20 urban areas of Japan. We found that the level of PM2.5 and O3 could modify mortality risks associated with extreme heat, but not extreme cold. The modifying effect of O3 on extreme heat was particularly apparent for mortality due to cardiovascular diseases, while females and the elderly populations might be more susceptible.
We found a difference in mortality risks between low and high levels of PM2.5 or O3 for extreme heat, but not for extreme cold. Previous studies also reported similar patterns in Germany, Europe, China, Australia, and Italy [16, 17, 19, 37, 38] where high temperatures were modified by PM2.5 and/or O3 where higher concentrations could increase the risk of mortality associated with high temperature. Our results agree with earlier studies that found a J-shaped pattern in how temperature and mortality risks are related in Japan and other countries, even after the effect modification of air pollution levels [16, 39–42]. The pooled results showed no significant difference of temperature effects between low and high PM2.5 concentration days. The results from the city-specific analysis suggested marginal variations in the effect modification of PM2.5 on extreme heat, and the effect modification was not statistically significant in most cities. The heterogeneity test suggested minimal variability among the 20 cities; however, further research covering more cities is necessary to understand the full extent of the disparities across Japan. City-specific information such as local industrial activity and mixture, traffic volume, and seasonal variations of the emissions of air pollutants could help shed light on the differences of effect modifications across cities. For instance, cities with higher industrial activities and traffic volume may experience different levels of air pollution. Additionally, seasonal variations in temperature and pollution levels could contribute to the differences in associations and interactions across cities.
We noticed some variation in how air pollutants modify the association between temperature and mortality, depending on the cause of death, sex, and age group. For cause-specific mortality, we found that O3 exhibited a stronger effect modification on cardiovascular mortality than PM2.5. This difference could be due to the different mechanistic reactions that temperature and air pollutants have on the circulatory and respiratory systems [17, 19, 43, 44]. We also found that females and the elderly population aged >75 groups may have a higher risk of death associated with extreme heat when exposure to extreme heat coincides with high levels of PM2.5 and O3. Possible explanations, beside the higher levels of exposure to air pollutants, include variations in susceptibility, adaptive capacity between males and females [39, 41, 43], and the higher frequency of chronic diseases, lower physiological reserve, and lower social support among the elderly [43, 45, 46].
Our results revealed that the effect modification by PM2.5 and O3 varied by the cut-off point used to define high or low levels of air pollutants. While we primarily used the 75th percentile as the cut-off point, we conducted tests with other percentiles and found recurrent patterns. The shape of the temperature-mortality curves showed little variation across cut-off points for both PM2.5 and O3 (Supplementary Fig. S3). We observed strong evidence of PM2.5 effect modification on extreme heat at the 70th percentile cut-off, while significant O3 effect modification on extreme heat was observed at the 50th, 60th, 70th, and 90th percentiles. This implies that O3 exhibits a more consistent and stronger effect modification than PM2.5 on the temperature-mortality association. The choice of the cut-off point may depend on the distribution and variability of air pollution levels in different regions and seasons [19, 23]. A higher cut-off point may capture more extreme events, while a lower cut-off point may reflect more common exposures. Future studies might consider using multiple cut-off points or continuous measures of air pollution to examine the effect modification more comprehensively.
Our study is subject to numerous limitations. One limitation is that using fixed percentile cut-offs to classify air pollution levels may not reflect the non-linear association between air pollution and health effects. Future research could adopt spline functions or threshold models to allow for more flexible shapes of the exposure-response curves. However, it is worth noting that introducing an interaction term between the temperature cross basis and the air pollutant spline could add complexity to the analysis. Second, interpreting the modifying role of air pollutants on cold temperatures poses challenges. This difficulty arises from the prolonged delayed effects of cold and the comparatively short health impact of air pollutants. Careful consideration and perhaps innovative modeling approaches are needed to untangle the intricate interplay between cold temperatures and air pollutants. Third, our research covered only a subset of cities in Japan, and we did not consider other potential effect modifiers or confounders that might account for differences across cities. Future studies should consider extending the coverage to allow further assessment of factors such as socioeconomic status, population behaviors, healthcare, the mixture and activity of local industries, traffic volume and seasonal variations, which could have varying degrees of impact on the interactions between temperature and air pollutants. A longer timeframe may also provide insights into the changes in these interactive associations over time. These considerations could enhance future studies and provide more comprehensive insights into the research question.
Conclusion
This study offers new perspectives on the short-term combined effects of temperature and major air pollutants on death rates in urban Japan. The results indicate that, while both extreme cold and heat increase the chance of death, high levels of PM2.5 or O3 may worsen the risk related to heat exposure, especially for mortality from cardiovascular diseases. The elderly and females are likely more susceptible. Further studies covering more areas, including those with low air pollution levels, are needed to confirm these results and understand the complex mechanisms behind how temperature and air pollution affect mortality.
Declarations
Ethics approval and consent to participate
This study was reviewed and obtained ethics approval from Kyoto University (Graduate School of Engineering) (Ref. No.: 201715).
Consent for publication
Not applicable.
Availability of data and material
The meteorological and air pollution data utilized for this study are publicly available from the Japan Meteorological Agency (https://www.data.jma.go.jp/stats/etrn/index.php) and the National Institute for Environmental Studies (https://www.nies.go.jp/igreen/) respectively. The mortality data is available from the corresponding author upon reasonable request. The data are not publicly available due to health information that could compromise the privacy of individuals.
Competing interests
The authors declare that they have no competing interests.
Funding
This work was supported by the Japan Science and Technology Agency (JST) as part of SICORP, Grant Number JPMJSC20E4, the Environment Research and Technology Development Fund S-20 (JPMEERF21S12006), the 1-2307 (JPMEERF20231007) of the Environmental Restoration and Conservation Agency Provided by the Ministry of Environment of Japan, and JSPS KAKENHI Grant Number 20H03942.
Author’s contribution
RK: performed conceptualization, investigation, and writing the original draft.
MABAT: performed investigation and edited draft manuscript.
CFSN: performed conceptualization, investigation, supervision, and edited draft manuscript.
MH: performed supervision and edited draft manuscript.
XS: performed supervision and edited draft manuscript.
YK: performed data collection and cleaning for the temperature data.
HN: performed data collection and cleaning for the air pollution data.
HT: performed supervision and edited draft manuscript.
KU: performed conceptualization, supervision, and edited draft manuscript.
All authors read and approved the final manuscript.
Acknowledgements
Not applicable.
References
- 1. Anderson M. Climate Change 2014: Synthesis Report. Libr J. 2016;141(9):28.
- 2. Barnett AG, Hajat S, Gasparrini A, Rocklov J. Cold and heat waves in the United States. Environ Res. 2012;112:218–24.
- 3. Basu R. High ambient temperature and mortality: a review of epidemiologic studies from 2001 to 2008. Environ Health. 2009;8:40.
- 4. D’Ippoliti D, Michelozzi P, Marino C, de’Donato F, Menne B, Katsouyanni K, et al. The impact of heat waves on mortality in 9 European cities: results from the EuroHEAT project. Environ Health. 2010;9:37.
- 5. Gasparrini A, Armstrong B. The impact of heat waves on mortality. Epidemiology. 2011;22(1):68–73.
- 6. Kovats RS, Kristie LE. Heatwaves and public health in Europe. Eur J Public Health. 2006;16(6):592–9.
- 7. Robine JM, Cheung SL, Le Roy S, Van Oyen H, Griffiths C, Michel JP, et al. Death toll exceeded 70,000 in Europe during the summer of 2003. C R Biol. 2008;331(2):171–8.
- 8. Semenza JC, Rubin CH, Falter KH, Selanikio JD, Flanders WD, Howe HL, et al. Heat-related deaths during the July 1995 heat wave in Chicago. N Engl J Med. 1996;335(2):84–90.
- 9. Bell ML, McDermott A, Zeger SL, Samet JM, Dominici F. Ozone and short-term mortality in 95 US urban communities, 1987–2000. JAMA. 2004;292(19):2372–8.
- 10. Dominici F, Peng RD, Bell ML, Pham L, McDermott A, Zeger SL, et al. Fine particulate air pollution and hospital admission for cardiovascular and respiratory diseases. JAMA. 2006;295(10):1127–34.
- 11. Collaborators GBDRF, Forouzanfar MH, Alexander L, Anderson HR, Bachman VF, Biryukov S, et al. Global, regional, and national comparative risk assessment of 79 behavioural, environmental and occupational, and metabolic risks or clusters of risks in 188 countries, 1990–2013: a systematic analysis for the Global Burden of Disease Study 2013. Lancet. 2015;386(10010):2287–323.
- 12. Kan H, London SJ, Chen G, Zhang Y, Song G, Zhao N, et al. Season, sex, age, and education as modifiers of the effects of outdoor air pollution on daily mortality in Shanghai, China: The Public Health and Air Pollution in Asia (PAPA) Study. Environ Health Perspect. 2008;116(9):1183–8.
- 13. Qian Z, He Q, Lin HM, Kong L, Bentley CM, Liu W, et al. High temperatures enhanced acute mortality effects of ambient particle pollution in the “oven” city of Wuhan, China. Environ Health Perspect. 2008;116(9):1172–8.
- 14. Wu W, Xiao Y, Li G, Zeng W, Lin H, Rutherford S, et al. Temperature-mortality relationship in four subtropical Chinese cities: a time-series study using a distributed lag non-linear model. Sci Total Environ. 2013;449:355–62.
- 15. Yang J, Ou CQ, Ding Y, Zhou YX, Chen PY. Daily temperature and mortality: a study of distributed lag non-linear effect and effect modification in Guangzhou. Environ Health. 2012;11:63.
- 16. Breitner S, Wolf K, Devlin RB, Diaz-Sanchez D, Peters A, Schneider A. Short-term effects of air temperature on mortality and effect modification by air pollution in three cities of Bavaria, Germany: a time-series analysis. Sci Total Environ. 2014;485–486:49–61.
- 17. Chen K, Wolf K, Breitner S, Gasparrini A, Stafoggia M, Samoli E, et al. Two-way effect modifications of air pollution and air temperature on total natural and cardiovascular mortality in eight European urban areas. Environ Int. 2018;116:186–96.
- 18. Hu X, Han W, Wang Y, Aunan K, Pan X, Huang J, et al. Does air pollution modify temperature-related mortality? A systematic review and meta-analysis. Environ Res. 2022;210:112898.
- 19. Li L, Yang J, Guo C, Chen PY, Ou CQ, Guo Y. Particulate matter modifies the magnitude and time course of the non-linear temperature-mortality association. Environ Pollut. 2015;196:423–30.
- 20. Rai M, Stafoggia M, de’Donato F, Scortichini M, Zafeiratou S, Vazquez Fernandez L, et al. Heat-related cardiorespiratory mortality: Effect modification by air pollution across 482 cities from 24 countries. Environ Int. 2023;174:107825.
- 21. Ren C, Williams GM, Morawska L, Mengersen K, Tong S. Ozone modifies associations between temperature and cardiovascular mortality: analysis of the NMMAPS data. Occup Environ Med. 2008;65(4):255–60.
- 22. Stafoggia M, Michelozzi P, Schneider A, Armstrong B, Scortichini M, Rai M, et al. Joint effect of heat and air pollution on mortality in 620 cities of 36 countries. Environ Int. 2023;181:108258.
- 23. Li J, Woodward A, Hou XY, Zhu T, Zhang J, Brown H, et al. Modification of the effects of air pollutants on mortality by temperature: A systematic review and meta-analysis. Sci Total Environ. 2017;575:1556–70.
- 24. Environment Mot. Climate Change Impact Assessment Report Review. 2020.
- 25. Ministry of the Environment, Ministry of Education CSS and T, Ministry of Agriculture F and F, Ministry of Land IT and T, Agency JM. Climate Change Observation, Projection and Impact Assessment Integrated Report 2018 - Climate Change and its Impacts in Japan. 2018.
- 26. Ito A, Wakamatsu S, Morikawa T, Kobayashi S. 30 Years of Air Quality Trends in Japan. Atmosphere-Basel. 2021;12(8):1072.
- 27. Lin YK, Ho TJ, Wang YC. Mortality risk associated with temperature and prolonged temperature extremes in elderly populations in Taiwan. Environ Res. 2011;111(8):1156–63.
- 28. Wang C, Zhang Z, Zhou M, Zhang L, Yin P, Ye W, et al. Nonlinear relationship between extreme temperature and mortality in different temperature zones: A systematic study of 122 communities across the mainland of China. Sci Total Environ. 2017;586:96–106.
- 29. National Institute for Environmental Studies N. Air quality measurement station data files - User Manual (in Japanese). Information Maintenance Office, Environmental Information Department: National Institute for Environmental Studies; 2021.
- 30. Gasparrini A. Distributed Lag Linear and Non-Linear Models in R: The Package dlnm. J Stat Softw. 2011;43(8):1–20.
- 31. Anderson BG, Bell ML. Weather-related mortality: how heat, cold, and heat waves affect mortality in the United States. Epidemiology. 2009;20(2):205–13.
- 32. Guo Y, Barnett AG, Pan X, Yu W, Tong S. The impact of temperature on mortality in Tianjin, China: a case-crossover design with a distributed lag nonlinear model. Environ Health Perspect. 2011;119(12):1719–25.
- 33. Gasparrini A, Guo Y, Hashizume M, Lavigne E, Zanobetti A, Schwartz J, et al. Mortality risk attributable to high and low ambient temperature: a multicountry observational study. Lancet. 2015;386(9991):369–75.
- 34. Schenker N, Gentleman JF. On judging the significance of differences by examining the overlap between confidence intervals. Am Stat. 2001;55(3):182–6.
- 35. Zeka A, Zanobetti A, Schwartz J. Individual-level modifiers of the effects of particulate matter on daily mortality. Am J Epidemiol. 2006;163(9):849–59.
- 36. Higgins JP, Thompson SG. Quantifying heterogeneity in a meta-analysis. Stat Med. 2002;21(11):1539–58.
- 37. Ren C, Williams GM, Tong S. Does particulate matter modify the association between temperature and cardiorespiratory diseases? Environ Health Perspect. 2006;114(11):1690–6.
- 38. Scortichini M, De Sario M, de’Donato FK, Davoli M, Michelozzi P, Stafoggia M. Short-Term Effects of Heat on Mortality and Effect Modification by Air Pollution in 25 Italian Cities. Int J Environ Res Public Health. 2018;15(8).
- 39. Dang TN, Seposo XT, Duc NH, Thang TB, An DD, Hang LT, et al. Characterizing the relationship between temperature and mortality in tropical and subtropical cities: a distributed lag non-linear model analysis in Hue, Viet Nam, 2009–2013. Glob Health Action. 2016;9:28738.
- 40. Denpetkul T, Phosri A. Daily ambient temperature and mortality in Thailand: Estimated effects, attributable risks, and effect modifications by greenness. Sci Total Environ. 2021;791:148373.
- 41. Pan R, Honda Y, Minakuchi E, Kim SE, Hashizume M, Kim Y. Ambient Temperature and External Causes of Death in Japan from 1979 to 2015: A Time-Stratified Case-Crossover Analysis. Environ Health Perspect. 2022;130(4):47004.
- 42. Parliari D, Cheristanidis S, Giannaros C, Keppas SC, Papadogiannaki S, de’Donato F, et al. Short-Term Effects of Apparent Temperature on Cause-Specific Mortality in the Urban Area of Thessaloniki, Greece. Atmosphere-Basel. 2022;13(6).
- 43. Brook RD, Rajagopalan S, Pope CA 3rd, Brook JR, Bhatnagar A, Diez-Roux AV, et al. Particulate matter air pollution and cardiovascular disease: An update to the scientific statement from the American Heart Association. Circulation. 2010;121(21):2331–78.
- 44. Kahle JJ, Neas LM, Devlin RB, Case MW, Schmitt MT, Madden MC, et al. Interaction effects of temperature and ozone on lung function and markers of systemic inflammation, coagulation, and fibrinolysis: a crossover study of healthy young volunteers. Environ Health Perspect. 2015;123(4):310–6.
- 45. Dubowsky SD, Suh H, Schwartz J, Coull BA, Gold DR. Diabetes, obesity, and hypertension may enhance associations between air pollution and markers of systemic inflammation. Environ Health Perspect. 2006;114(7):992–8.
- 46. O’Neill MS, Zanobetti A, Schwartz J. Modifiers of the temperature and mortality association in seven US cities. Am J Epidemiol. 2003;157(12):1074–82.