INTRODUCTION
The emission of air pollutants from China has increased rapidly in recent years owing to the marked expansion of its economy and the insufficient implementation of environmental pollution control measures. In particular, PM2.5 pollution in metropolitan areas is one of the most serious environmental problems in China (Song et al., 2007). Thus, the long-range transport of air pollutants from China has a measurable impact on atmospheric composition in Japan, which is located at the forefront of the eastern regions of the Asian continent. Studies over the past few decades have shown that various gaseous and particulate pollutants, including non-sea-salt sulfate (nss SO42−), nitrate, O3, heavy metals, PAHs, and black carbon, are transported from the Asian continent to Japan in winter and spring when the airflows from the Asian continent are dominant (Mukai et al., 1990, 1994; Ichikawa et al., 1998; Tanaka and Sakata, 2002; Matsumoto et al., 2003; Uno et al., 2003; Tanimoto et al., 2005).
Lead is one of the most hazardous heavy metals and has four isotopes, 204Pb, 206Pb, 207Pb, and 208Pb. Lead isotope ratios, such as 207Pb/206Pb and 208Pb/206Pb, provide useful information on lead sources in environmental samples when each source has distinctive isotope ratios. Mukai et al. (1994) showed that lead isotope ratios of aerosols are effective indicators of long-range transport of air pollutants from the Asian continent to Japan. This is because air masses from the Asian continent have lower radiogenic isotope ratios, i.e., higher 207Pb/206Pb and 208Pb/206Pb, than those from Japan. On the basis of such differences in lead isotope ratios, Kusunoki et al. (2012) suggested that the recent increase in lead concentration in sediment cores from Lake Shinji, western Japan, is primarily due to the long-range transport of lead from the Asian continent. Moreover, it has been reported that the concentration ratio of lead to zinc (expressed as Pb/Zn ratio) in aerosols is an effective indicator of the origin of an air mass (Mukai et al., 1990, 1994). This is based on the fact that the Pb/Zn ratio in air masses from the Asian continent is higher than that from Japan. Mukai et al. (1990) observed the seasonal variations in this ratio at the Oki Islands; it was high in winter (about 1) and low in summer (about 0.5). These variations were considered to depend on the extent to which the countermeasures for lead sources were implemented in each region, such as the phase-out of leaded gasoline.
Li et al. (2012) estimated the atmospheric emissions of lead from anthropogenic sources in China from 1990 to 2009. Motor vehicle gasoline combustion was the largest source of anthropogenic lead emissions before 2000. However, since leaded gasoline was phased out in 2000, a substantial decline in lead emissions occurred in 2001. After the phase-out, coal combustion and nonferrous metal smelting became important emission sources, and lead emissions from those sources increased gradually. This makes it possible to expect that lead concentration and isotope ratios in air masses transported from the Asian continent to Japan have changed over the years. The clarification of these long-term trends is important to evaluate the contribution of lead from the Asian continent to Japan based on lead isotope ratios and Pb/Zn ratio in environmental samples, such as aerosols and sediments. For example, the historical trend of lead isotope ratios in sediment cores collected from lakes has been used to evaluate the contribution of increasing long-range transport of air pollutants from the Asian continent in recent years (Kusunoki et al., 2012; Hosono et al., 2016). Unfortunately, the data on atmospheric lead concentration and isotope ratios in Japan that have been observed continuously for a long time are not available.
In this study, we evaluated the long-term trend of atmospheric lead pollution in western Japan based on lead isotope ratios and Pb/Zn ratio as indicators of the long-range transport of aerosols from the Asian continent. First, we investigated the recent seasonal changes in atmospheric lead concentration, lead isotope ratios, and Pb/Zn ratio based on the two-year observation (May 2013–April 2015) in Hirado City on the Asian continent side of Japan (Fig. 1). Next, we collected the data on these parameters by a review of literature in some sites in western Japan, which were observed during winter (December–February) when airflows from the Asian continent are dominant for several years from approximately 1990. Finally, using these data, the long-term trends of atmospheric lead concentration, lead isotope ratios, and Pb/Zn ratio were evaluated.
MATERIALS AND METHODS
SAMPLING
The location (33.35 ºN, 129.58 ºE) of the sampling site in Hirado City, Nagasaki Prefecture is shown in Fig. 1. This site is in a remote area on the Asian continent side of Japan, which has been strongly affected by the long-range transport of air pollutants from the Asian continent. Kosa (“yellow sand” in Japanese) events have also been observed frequently in this region. There are no large anthropogenic sources around the site, except for coal-fired power plants. However, it is likely that the effects of emissions from the power plants in the surrounding environment are very small based on the study by Sakata and Asakura (2011).
Atmospheric aerosol (TSP) samples were collected on quartz fiber filters (20×25 cm; ADVANTEC OR-100) using a high-volume air sampler (Shibata HV-RW) without an impactor. In general, sampling was conducted at a flow rate of 300 L min−1 every week from May 2013 to April 2015, except for a period from August 15 to November 7, 2013 when the sampler underwent maintenance work. After the collection of samples, the filters were stored until further analyses.
CHEMICAL ANALYSES
To determine the lead and zinc concentrations and lead isotope ratios in aerosols, a portion (35 cm2) of the sample filter was cut into pieces and digested with HF–HNO3–HClO4. After evaporation to dryness, the resulting residue was dissolved in ~0.5 mol L−1 of HNO3 solution. Using this solution, we measured the lead and zinc concentrations in aerosol samples by inductively coupled plasma atomic emission spectrometry (ICP-AES; Varian 730ES). The typical operating conditions for ICP-AES used in this study were 1,200 W for RF power and 15 L min−1 for plasma flow rate. Its precision and accuracy in measuring elements, including lead and zinc, were already verified using a NIST standard reference material (urban particulate matter, SRM1648; Sakata et al., 2014). The aerosol concentrations of lead and zinc were corrected with respect to those in blank filters. The concentrations of lead and zinc in blank filters ranged from 0.9% to 19% (average, 3.6%) and from 3.4% to 23% (average, 7.8%) in samples, respectively. The number of samples with relatively high ratios (>15%) of filter blanks were only two for lead and five for zinc. Moreover, Honda (2019) reported that the relative standard deviations (RSDs) for the replicate measurements (n=5) of lead and zinc concentrations in quartz fiber filters (ADVANTEC OR-100) were 7% and 20%, respectively. A rough estimate based on these values suggests that even for a sample with the highest ratios of filter blanks (Pb, 19%; Zn, 23%), the variations in filter blanks are only 1.3% for lead and 4.6% for zinc, which are close to the analytical error (RSD) of conventional ICP-AES. Thus, it is assumed that the effect of filter blanks on the precision of element and lead isotope analyses of aerosols is very small.
On the other hand, lead isotope ratios were measured by inductively coupled plasma mass spectrometry (ICP-MS; Varian 820MS) using a sample solution in which the lead concentration was adjusted to be approximately 40 or 80 μg L−1. The typical operating conditions for ICP-MS were 1,300 W for RF power, 16 L min−1 for plasma flow rate, 500 μs for dwell time, 1,000 times for scan frequency, and 5 times for repeat frequency. A peristaltic pump was used to introduce the samples in ICP-MS. The lead isotope ratios in NIST SRM 981 solution were measured before and after the isotope ratio measurement of the samples. The obtained mean isotope ratios were used as the reference (207Pb/206Pb=0.91464±0.00033; 208Pb/206Pb=2.1681±0.0008) to determine the correction factors for lead isotope ratios in the samples. The RSD of the three replicate measurements was approximately 0.15% for 207Pb/206Pb and 208Pb/206Pb (see Table 1).
Table 1 Atmospheric lead concentration, lead isotope ratios, and Pb/Zn ratio of aerosol samples at Hirado site
| Sampling Time | Pb concentration (ng m−3) | 207Pb/206Pb (mean±1σ) | 208Pb/206Pb (mean±1σ) | Pb/Zn ratio |
|---|
| Year | Start | End |
|---|
| 2013 | 1-May | May 8 | 5.7 | 0.849±0.001 | 2.065±0.003 | 0.19 |
| 2013 | 8-May | May 15 | 18.7 | 0.855±0.004 | 2.090±0.006 | 0.30 |
| 2013 | 15-May | May 23 | 15.1 | 0.857±0.002 | 2.098±0.005 | 0.25 |
| 2013 | 23-May | May 31 | 21.9 | 0.858±0.002 | 2.096±0.003 | 0.31 |
| 2013 | 31-May | 7-Jun | 9.9 | 0.854±0.003 | 2.083±0.007 | 0.28 |
| 2013 | 7-Jun | 14-Jun | 4.6 | 0.851±0.001 | 2.077±0.005 | 0.22 |
| 2013 | 14-Jun | 22-Jun | 1.2 | 0.834±0.001 | 2.042±0.001 | 0.11 |
| 2013 | 8-Jul | 15-Jul | 1.6 | 0.837±0.001 | 2.042±0.002 | 0.27 |
| 2013 | 15-Jul | 23-Jul | 1.1 | 0.822±0.002 | 2.009±0.002 | 0.17 |
| 2013 | 23-Jul | 31-Jul | 12.5 | 0.849±0.001 | 2.091±0.006 | 0.24 |
| 2013 | 31-Jul | 7-Aug | 5.9 | 0.848±0.002 | 2.079±0.003 | 0.29 |
| 2013 | 7-Aug | 15-Aug | 9.1 | 0.852±0.002 | 2.095±0.003 | 0.21 |
| 2013 | 7-Nov | 16-Nov | 17.0 | 0.856±0.002 | 2.095±0.002 | 0.38 |
| 2013 | 16-Nov | 23-Nov | 15.3 | 0.860±0.004 | 2.101±0.005 | 0.50 |
| 2013 | 23-Nov | 2-Dec | 13.1 | 0.855±0.001 | 2.087±0.001 | 0.49 |
| 2013 | 2-Dec | 10-Dec | 21.0 | 0.862±0.002 | 2.112±0.005 | 0.46 |
| 2013 | 10-Dec | 17-Dec | 14.3 | 0.861±0.001 | 2.104±0.002 | 0.46 |
| 2013 | 17-Dec | 24-Dec | 5.8 | 0.849±0.001 | 2.075±0.003 | 0.28 |
| 2013 | 24-Dec | 7-Jan | 18.3 | 0.860±0.002 | 2.109±0.006 | 0.42 |
| 2014 | 7-Jan | 14-Jan | 20.8 | 0.858±0.004 | 2.097±0.005 | 0.45 |
| 2014 | 14-Jan | 21-Jan | 24.9 | 0.861±0.001 | 2.103±0.003 | 0.43 |
| 2014 | 28-Jan | 4-Feb | 23.8 | 0.857±0.002 | 2.105±0.004 | 0.66 |
| 2014 | 4-Feb | 11-Feb | 3.8 | 0.855±0.001 | 2.080±0.003 | 0.19 |
| 2014 | 11-Feb | 18-Feb | 5.9 | 0.862±0.001 | 2.109±0.002 | 0.41 |
| 2014 | 18-Feb | 25-Feb | 9.6 | 0.858±0.002 | 2.091±0.007 | 0.37 |
| 2014 | 25-Feb | 4-Mar | 15.2 | 0.861±0.001 | 2.103±0.003 | 0.34 |
| 2014 | 4-Mar | 11-Mar | 14.8 | 0.858±0.002 | 2.090±0.003 | 0.31 |
| 2014 | 11-Mar | 18-Mar | 10.7 | 0.856±0.002 | 2.093±0.003 | 0.33 |
| 2014 | 18-Mar | 25-Mar | 18.7 | 0.858±0.002 | 2.096±0.003 | 0.32 |
| 2014 | 25-Mar | 1-Apr | 7.7 | 0.857±0.001 | 2.096±0.005 | 0.30 |
| 2014 | 1-Apr | 8-Apr | 11.1 | 0.856±0.001 | 2.089±0.001 | 0.32 |
| 2014 | 8-Apr | 15-Apr | 12.8 | 0.855±0.001 | 2.090±0.001 | 0.32 |
| 2014 | 15-Apr | 22-Apr | 11.8 | 0.857±0.002 | 2.087±0.003 | 0.31 |
| 2014 | 6-May | 13-May | 11.9 | 0.854±0.001 | 2.093±0.004 | 0.32 |
| 2014 | 13-May | 20-May | 17.2 | 0.855±0.002 | 2.091±0.002 | 0.26 |
| 2014 | 20-May | 27-May | 10.6 | 0.858±0.001 | 2.096±0.003 | 0.27 |
| 2014 | 27-May | 3-Jun | 30.9 | 0.856±0.002 | 2.095±0.002 | 0.32 |
| 2014 | 3-Jun | 10-Jun | 4.7 | 0.854±0.001 | 2.084±0.003 | 0.19 |
| 2014 | 10-Jun | 17-Jun | 10.9 | 0.853±0.001 | 2.081±0.002 | 0.13 |
| 2014 | 17-Jun | 24-Jun | 5.5 | 0.852±0.002 | 2.070±0.003 | 0.18 |
| 2014 | 24-Jun | 1-Jul | 7.6 | 0.852±0.001 | 2.084±0.006 | 0.23 |
| 2014 | 1-Jul | 8-Jul | 6.3 | 0.850±0.001 | 2.083±0.002 | 0.21 |
| 2014 | 8-Jul | 15-Jul | 10.6 | 0.852±0.001 | 2.088±0.004 | 0.31 |
| 2014 | 15-Jul | 22-Jul | 1.0 | 0.822±0.002 | 2.009±0.003 | 0.14 |
| 2014 | 22-Jul | 29-Jul | 1.7 | 0.836±0.001 | 2.037±0.003 | 0.11 |
| 2014 | 29-Jul | 5-Aug | 5.2 | 0.850±0.001 | 2.080±0.003 | 0.20 |
| 2014 | 5-Aug | 12-Aug | 2.4 | 0.847±0.003 | 2.055±0.008 | 0.21 |
| 2014 | 12-Aug | 18-Aug | 2.0 | 0.845±0.001 | 2.056±0.002 | 0.21 |
| 2014 | 18-Aug | 26-Aug | 2.9 | 0.848±0.002 | 2.071±0.002 | 0.12 |
| 2014 | 26-Aug | 2-Sep | 3.6 | 0.841±0.001 | 2.050±0.002 | 0.22 |
| 2014 | 2-Sep | 9-Sep | 5.4 | 0.847±0.003 | 2.072±0.002 | 0.25 |
| 2014 | 9-Sep | 16-Sep | 9.9 | 0.856±0.001 | 2.086±0.003 | 0.33 |
| 2014 | 16-Sep | 23-Sep | 7.8 | 0.859±0.001 | 2.087±0.001 | 0.26 |
| 2014 | 23-Sep | 30-Sep | 5.8 | 0.855±0.001 | 2.076±0.001 | 0.27 |
| 2014 | 30-Sep | 7-Oct | 6.5 | 0.858±0.001 | 2.091±0.005 | 0.38 |
| 2014 | 7-Oct | 14-Oct | 6.3 | 0.849±0.001 | 2.062±0.004 | 0.22 |
| 2014 | 14-Oct | 21-Oct | 8.1 | 0.858±0.001 | 2.092±0.004 | 0.23 |
| 2014 | 21-Oct | 28-Oct | 4.0 | 0.850±0.002 | 2.073±0.003 | 0.26 |
| 2014 | 28-Oct | 4-Nov | 5.2 | 0.858±0.001 | 2.089±0.001 | 0.21 |
| 2014 | 4-Nov | 11-Nov | 14.4 | 0.863±0.001 | 2.108±0.003 | 0.32 |
| 2014 | 11-Nov | 18-Nov | 10.7 | 0.855±0.001 | 2.095±0.005 | 0.38 |
| 2014 | 18-Nov | 24-Nov | 5.6 | 0.853±0.002 | 2.079±0.002 | 0.25 |
| 2014 | 24-Nov | 2-Dec | 3.8 | 0.849±0.001 | 2.074±0.002 | 0.22 |
| 2014 | 2-Dec | 9-Dec | 7.9 | 0.853±0.001 | 2.083±0.003 | 0.44 |
| 2014 | 9-Dec | 15-Dec | 9.7 | 0.856±0.001 | 2.088±0.004 | 0.40 |
| 2014 | 15-Dec | 24-Dec | 9.1 | 0.855±0.001 | 2.086±0.001 | 0.40 |
| 2014 | 24-Dec | 5-Jan | 15.1 | 0.858±0.001 | 2.095±0.002 | 0.42 |
| 2015 | 5-Jan | 13-Jan | 19.3 | 0.858±0.001 | 2.095±0.004 | 0.43 |
| 2015 | 13-Jan | 20-Jan | 15.1 | 0.856±0.001 | 2.091±0.003 | 0.33 |
| 2015 | 20-Jan | 27-Jan | 11.0 | 0.852±0.002 | 2.088±0.003 | 0.40 |
| 2015 | 27-Jan | 3-Feb | 8.1 | 0.851±0.002 | 2.080±0.005 | 0.31 |
| 2015 | 3-Feb | 10-Feb | 14.3 | 0.854±0.002 | 2.082±0.005 | 0.45 |
| 2015 | 10-Feb | 17-Feb | 12.2 | 0.852±0.001 | 2.084±0.004 | 0.48 |
| 2015 | 17-Feb | 24-Feb | 8.2 | 0.852±0.001 | 2.078±0.002 | 0.42 |
| 2015 | 24-Feb | 3-Mar | 7.3 | 0.852±0.001 | 2.080±0.003 | 0.29 |
| 2015 | 3-Mar | 10-Mar | 5.4 | 0.851±0.001 | 2.073±0.004 | 0.30 |
| 2015 | 10-Mar | 17-Mar | 10.3 | 0.852±0.001 | 2.084±0.002 | 0.37 |
| 2015 | 17-Mar | 24-Mar | 16.9 | 0.855±0.001 | 2.089±0.003 | 0.34 |
| 2015 | 24-Mar | 31-Mar | 4.7 | 0.854±0.001 | 2.086±0.003 | 0.22 |
| 2015 | 31-Mar | 7-Apr | 4.2 | 0.846±0.002 | 2.070±0.002 | 0.30 |
| 2015 | 7-Apr | 14-Apr | 2.7 | 0.842±0.003 | 2.049±0.003 | 0.21 |
| 2015 | 14-Apr | 21-Apr | 9.8 | 0.852±0.001 | 2.091±0.001 | 0.31 |
| 2015 | 21-Apr | 28-Apr | 13.9 | 0.854±0.001 | 2.088±0.003 | 0.26 |
In this study, since the sampling duration of aerosols was one week, it is generally difficult to determine the source regions contributing to lead in each sample based on back-trajectory analysis. To clarify the characteristics of trajectories during winter and summer at the Hirado site, we calculated the back-trajectories during winter and summer using a HYSPLIT trajectory model (https://ready.arl.noaa.gov/HYSPLIT_traj.php), which was developed at NOAA Air Resources Laboratory. The trajectories, which had a 3-day duration and ended at 12:00 UTC on the third day, were calculated every 6 h during the arbitrary sampling periods in winter (December 10–16, 2013; January 7–13, 2014) and summer (June 17–23, 2014; August 6–11, 2014). The reference height was set at 1,300 m AGL, which is the upper end of the atmospheric boundary layer. The results of the back-trajectory analysis are shown in Supplementary Figs. S1–S4.
RESULTS AND DISCUSSION
RECENT SEASONAL CHANGES IN ATMOSPHERIC LEAD CONCENTRATION, LEAD ISOTOPE RATIOS, AND Pb/Zn RATIO IN HIRADO
The analytical results obtained in this study are summarized in Table 1. The seasonal changes and averages of atmospheric lead concentration, lead isotope ratios (207Pb/206Pb and 208Pb/206Pb), and Pb/Zn ratio from May 2013 to April 2015 at the Hirado site are shown in Fig. 2. In Japan, generally, the following seasons include three months: spring (March, April, and May), summer (June, July, and August), fall (September, October, and November), and winter (December, January, and February). As described previously, no data were obtained from August 15 to November 7, 2013, because the sampler underwent maintenance work.
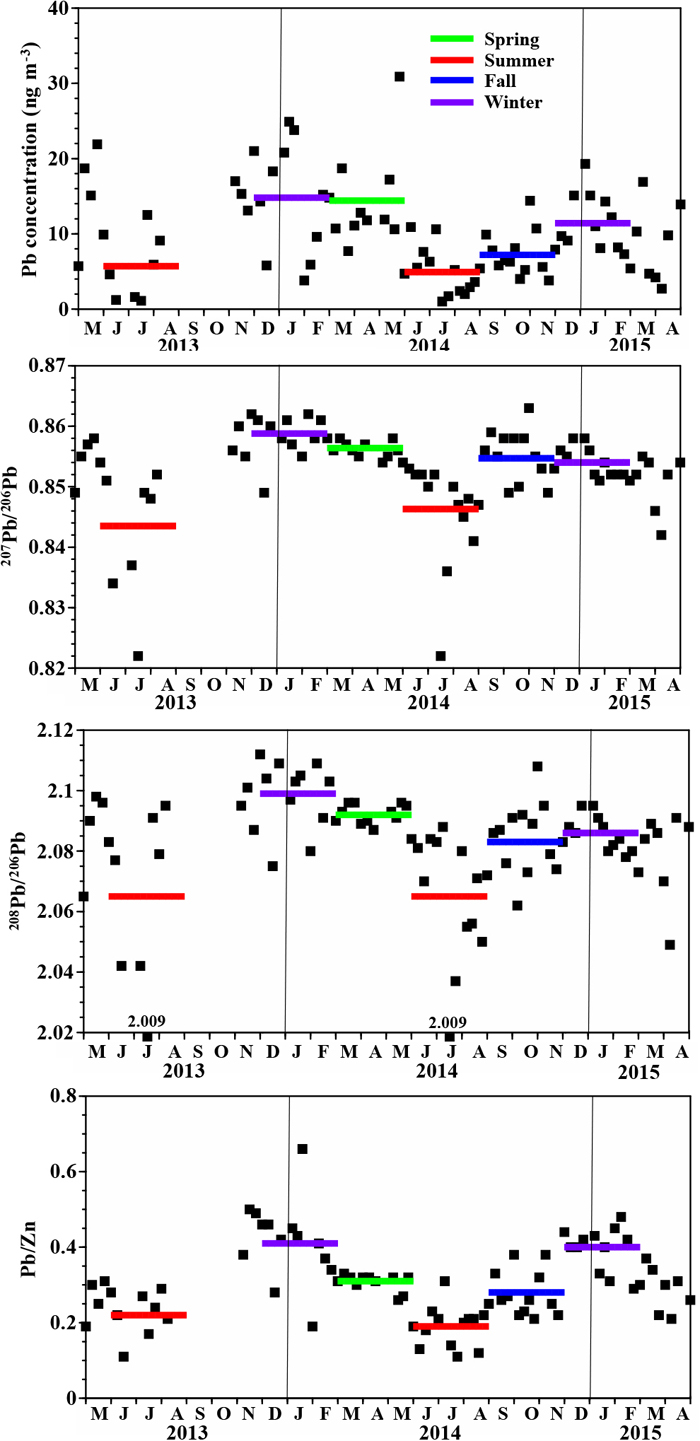
The atmospheric lead concentration increased during winter and decreased during summer. Based on the back-trajectory analysis, the trajectories during winter (Figs. S1 and S2) at the Hirado site were primarily from northern China, while those during summer (Figs. S3 and S4) were unstable and passed through different regions, including the Pacific Ocean, Korean Peninsula, and Kyushu region depending on the day. Thus, the increase in lead concentration during winter suggests the enhanced long-range transport of lead from anthropogenic sources in the Asian continent. As shown in Fig. 2, the highest lead concentration was observed in the last week of May 2014. This is attributable to the kosa events that occurred for six successive days from May 26 to 31 based on the data (Japan Meteorological Agency; https://www.data.jma.go.jp/gmd/env/kosahp/59chiten/817.html) obtained from the nearest Nagasaki meteorological observatory (32.73 ºN, 129.87 ºE).
The lead isotope ratios (207Pb/206Pb and 208Pb/206Pb) of aerosols also generally increased during winter and decreased during summer in Hirado. Fig. 3 shows the lead isotope ratios (mean±1σ) of aerosols during winter and summer at the Hirado site. The line shown in the figure is based on the lead growth curve presented by Coming and Richard (1975). The lead isotope ratios of aerosols at the Hirado site are compared with those in major cities (Shanghai, Tianjin, and Xiamen) of China in 2001–2003 after the phase-out of leaded gasoline (Zheng et al., 2004; Wang et al., 2006; Zhu et al., 2010), and to the lead isotope ratios of volcanic rocks (Murozumi et al., 1996), coal fly ashes from typical coal-fired power plants (Sakata et al., 2006), and fly ashes from municipal solid waste (MSW) incinerators (Sakata et al., 2000) in Japan. Unfortunately, the recent lead isotope ratios of aerosols in China are not available. In this study, we assumed that there are no marked changes in the lead isotope ratios of aerosols after the phase-out of leaded gasoline, because coal combustion and nonferrous metal smelting became the important emission sources of lead after the phase-out (Li et al., 2012). The lead isotope ratios of aerosols during winter at the Hirado site were relatively close to those in major cities of China after the phase-out of leaded gasoline and fly ashes from MSW incinerators in Japan. MSW incineration accounted for the major portion of atmospheric lead in most Japanese urban areas until around 2000 (Sakata et al., 2000). However, after that, lead emissions from MSW incineration decreased rapidly due to the improved flue gas control system associated with the countermeasures for dioxins (Sakata and Marumoto, 2004). Sakata and Marumoto (2004) observed the decreasing trend of atmospheric lead concentration with decreasing emissions of particles from MSW incinerators after the start of countermeasures for dioxins in the Tokyo area. As described earlier, the trajectories during winter (Figs. S1 and S2) at the Hirado site were primarily from northern China. These support the fact that the lead in aerosols during winter at the Hirado site originates predominantly from anthropogenic sources in China.

On the other hand, the distribution of the lead isotope ratios of aerosols during summer at the Hirado site was highly scattered, and the ratios were lower than those during the other seasons. The trajectories during summer (Figs. S3 and S4) were unstable and passed through different regions, including the Pacific Ocean, Korean Peninsula, and Kyushu region depending on the day. This suggests that the lead isotope ratios during summer are affected by lead from anthropogenic and natural sources (e.g., soil particles and volcanic emissions) in Japan and Korea. Although the recent lead isotope ratios from Japan and Korea need to be clarified, Fig. 3 shows that the lead isotope ratios during summer at the Hirado site are located between the volcanic rocks and coal fly ashes in Japan. The lead isotope ratios of volcanic rocks were almost identical to those in Japanese soils (207Pb/206Pb=0.846±0.004; 208Pb/206Pb=2.093±0.011; unpublished results by Sakata). Thus, we hypothesize that the lead isotope ratios during summer at the Hirado site are governed by lead from anthropogenic sources, such as coal combustion, and natural sources, such as soil particles and volcanic emissions. Volcanic emissions may be particularly large in the Kyushu region where major volcanoes exist. It appears that the markedly low lead isotope ratios observed sometimes during summer (Fig. 2) are primarily attributable to lead emissions from coal combustion facilities, such as coal-fired power plants and iron works, because no other sources with such low isotope ratios have been found.
The Pb/Zn ratio clearly increased during winter and decreased during summer. This reflects the fact that the Pb/Zn ratio in air masses originating from the Asian continent is higher than that from Japan (Mukai et al., 1990, 1994). Although the recent Pb/Zn ratio in aerosols from China is not available, Okuda et al. (2004) reported an average Pb/Zn ratio of 0.56 in Beijing from March 2001 to August 2003 after the phase-out of leaded gasoline, which was relatively close to the ratio (0.40±0.09) during winter at the Hirado site. Kaneyasu et al. (2014) reported that the Pb/Zn ratio of aerosols collected in Fukuoka in western Japan was close to that in Beijing. Sakata et al. (2014) measured the concentrations of trace elements, including lead and zinc, in aerosol samples from 10 sites (four sites from industrial and urban areas and six sites from remote areas) across Japan from April 2004 to March 2006. Using these data, we calculated 0.30±0.09 as the average Pb/Zn ratio (±1σ) in 10 sites during summer, which was the time when the contribution of sources in China was minimized. In addition, the Pb/Zn ratio of an average crust material is 0.19 (Mason and Moore, 1982), which is regarded as the background value of soils. Thus, the Pb/Zn ratio (0.20±0.06) at the Hirado site during summer also tends to support the hypothesis that the lead in aerosols during summer originates primarily from anthropogenic and natural sources (e.g., soil particles and volcanic emissions) in Japan.
This study confirmed the seasonal changes in atmospheric lead concentration, lead isotope ratios, and Pb/Zn ratio: increasing during winter and decreasing during summer, owing to the long-range transport of lead from the Asian continent. Moreover, the latest monitoring data (April 2017–March 2018) at a site in the Goto Islands (Fig. 1) obtained by the Ministry of the Environment, Japan (https://www.env.go.jp/air/osen/pm/monitoring.html) showed similar seasonal changes in atmospheric lead concentration and Pb/Zn ratio: increasing during winter (Pb concentration, 10.0±9.0 ng m−3; Pb/Zn, 0.43±0.09) and decreasing during summer (Pb concentration, 3.2±1.7 ng m−3; Pb/Zn, 0.19±0.07). Thus, the latest monitoring results suggest the effectiveness of Pb/Zn ratio as the indicator of the long-range transport of air pollutants from the Asian continent to Japan.
LONG-TERM TRENDS OF ATMOSPHERIC LEAD CONCENTRATION, LEAD ISOTOPE RATIOS, AND Pb/Zn RATIO DURING WINTER IN WESTERN JAPAN
The long-term trends of atmospheric lead concentration, lead isotope ratios, and Pb/Zn ratio in some sites in western Japan during winter from approximately 1990 are presented in Fig. 4. The data at the Hirado site are from this study. In addition, by a review of literature, we collected the data for these parameters that were measured during the winter of several years at sites in the Oki Islands, Matsue City, and Matsuura City (Fig. 1). These sampling sites are located in the Sea of Japan or in remote areas along the coast of the Sea of Japan. Thus, we expect that the effects of anthropogenic sources around the sites on the atmospheric lead concentration and isotope ratios are very small. In contrast, the differences in the locations of the study sites may contribute to the differences in their atmospheric lead concentration and isotope ratios if the amount and sources of lead transported from the Asian continent are different among the sites, depending on their locations. Sakata et al. (2014) found that the atmospheric trace element concentrations at the sites along the coast of the Sea of Japan decreased exponentially with increasing longitude of their locations. Hence, it is probable that the lead concentrations at the Hirado and Matsuura sites are higher than those at the Oki and Matsue sites located in the east. This is supported by the monitoring data obtained by the Ministry of the Environment, Japan (https://www.env.go.jp/air/osen/pm/monitoring.html) during winter (January 18–February 1, 2018) at sites in the Oki Islands and Goto Islands (Fig. 1), as shown in Fig. 5. Moreover, the monitoring data demonstrated that there is no significant difference (p>0.05 by t-test) in the Pb/Zn ratio between the Oki and Goto sites (Oki site, 0.51±0.18; Goto site, 0.43±0.09). This suggests that the differences in the locations of the study sites do not contribute to the differences in their Pb/Zn ratios.


The aerosol samples from the Oki site were collected on cellulose membrane filters or PTFE filters using a handy-type, high-volume air sampler, which has an impactor to trap coarse particles larger than 10 μm (Mukai et al., 1994). In contrast, the samples from the Matsue and Matsuura sites were collected on quartz fiber filters by the same method as that used for the samples from the Hirado site (Marumoto and Sakata, 2007; Sakata et al., 2014). We assumed that the differences in the materials of filters have a little effect on the concentrations of lead and zinc in aerosols. The sampling durations were 24 h at the Oki and Matsue sites, one week at the Hirado site, and about two weeks at the Matsuura site. Thus, the sampling durations at the Hirado and Matsuura sites were much longer than those at the Oki and Matsue sites. Hence, the atmospheric lead concentration, lead isotope ratios, and Pb/Zn ratio in the samples from the Matsuura and Hirado sites were averaged during such long durations, and consequently, the variations (1σ) in those parameters among the samples were smaller than those from the Oki and Matsue sites (Fig. 4).
Fig. 4 shows that the atmospheric lead concentration tends to decrease over the years (r2=0.94; p<0.001). As mentioned earlier, it is probable that the lead concentrations at the Hirado and Matsuura sites are higher than those at the Oki and Matsue sites, which are located in the east. If this is the case, the atmospheric lead concentrations in 1990s at the Hirado and Matsuura sites are expected to be higher than that at the Oki site (Fig. 4). This confirms the decreasing trend of atmospheric lead concentration during winter over the years in western Japan, suggesting that atmospheric lead pollution is improving.
Fig. 6 shows the long-term trend of atmospheric lead emissions from anthropogenic sources in China from 1990 to 2009 (Li et al., 2012). In China, motor vehicle gasoline combustion was the largest source of atmospheric lead emissions before 2000, but after 2001, when leaded gasoline was phased out, coal combustion and nonferrous metal smelting became the important emission sources. Wang et al. (2006) measured the lead concentration of aerosols in Tianjin, China from 1994 to 2001. From 1994 to 1998, the lead concentration gradually decreased. This decline could be attributable to the use of unleaded gasoline, as the period overlapped with the phase-out of leaded gasoline. From 1999, the lead concentration varied, implying that besides leaded gasoline, there were other lead sources that cannot be ignored (Wang et al., 2006). Although the data on recent atmospheric lead emissions in China after 2010 are not available, the lower lead concentration measured during winter from May 2013 to April 2015 at the Hirado site (Fig. 4) strongly suggests that the recent atmospheric lead emissions in China have reduced due to the implementation of environmental pollution control measures (Fu et al., 2017).

For lead isotope ratios, no measurements were conducted from December 2004 to February 2006 at the Matsuura site. The samples collected before 2001 showed almost constant lead isotope ratios (Fig. 4). However, for the samples collected from May 2013 to April 2015 at the Hirado site, the isotope ratios were clearly lower than those before 2001, suggesting that the lead sources transported from the Asian continent to Japan have changed over the years.
As shown in Fig. 6, in China, motor vehicle gasoline combustion was the largest source of atmospheric lead emissions before 2000. Vehicle exhaust from leaded gasoline used in Shanghai, China has higher lead isotope ratios (207Pb/206Pb=0.896–0.911; 208Pb/206Pb=2.187–2.201) than other anthropogenic sources (Zheng et al., 2004; Chen et al., 2005). According to the measurement by Wang et al. (2006), there has been a steady decrease in 207Pb/206Pb in aerosol samples from Tianjin from 1994 to 2001, suggesting that the sources contributing to aerosol lead was changing. The period from 1994 to 2001 was the critical period of the switch from leaded to unleaded gasoline. During this time, the systematic change in 207Pb/206Pb could be reasonably linked to the use of leaded gasoline. Thus, it is likely that vehicle exhaust from leaded gasoline in China was the source of higher lead isotope ratios before 2001 at the Oki and Matsue sites.
Similar to the atmospheric lead concentration, the Pb/Zn ratio tended to decrease over the years (r2 =0.80; p<0.001; Fig. 4). This may be due to the fact that the amounts and sources of lead and zinc transported from the Asian continent to Japan have changed over the years. Tian et al. (2015) estimated the emissions of toxic heavy metals, including lead and zinc, from 1949 to 2012 in China. The long-term trend of lead emissions is almost the same as that obtained by Li et al. (2012), as shown in Fig. 6. A substantial decrease in lead emissions occurred after 2001, because leaded gasoline was phased out in 2000. In contrast, zinc emissions increased abruptly after 2000 due to the expansion of coal combustion and ferrous and nonferrous metal smelting; consequently, the ratio of lead emissions to zinc emissions (expressed as emission Pb/Zn ratio) decreased from 1.9 in 2000 to 0.65 in 2012. Therefore, it is concluded that the long-term decreasing trend of Pb/Zn ratio in aerosols from the study sites in western Japan (Fig. 4) is attributed to the fact that the amounts of lead and zinc transported from the Asian continent to Japan have changed over the years. The higher Pb/Zn ratios in China than those in western Japan may be related to the contribution of soil particles with low Pb/Zn ratio (0.19; Mason and Moore, 1982) transported from the Asian continent and the relatively large uncertainties of the estimated emissions of lead and zinc (Tian et al., 2015).

