Articles
Monitoring of phenolic endocrine disrupting chemicals by direct acetylation method: Pollution status in Tokyo rivers in 2016–2019 and estimation of their sources

2022 Volume 2 Pages 1-13
Details
2022 Volume 2 Pages 1-13
To analyze a wide range of phenolic endocrine disrupting chemicals, including alkylphenols, bisphenol A (BPA) and its analogues, triclosan (TCS), thymol, and phenolic UV filters, a direct acetylation method has been developed and applied to 116 river water samples and 40 sewage treatment plant (STP) effluent samples collected in 2016–2019 in Tokyo, Japan. This method can simultaneously derivatize a range of target chemicals to inert acetylates at an early stage in the analytical procedure. In this study, nonylphenol concentrations in the Tamagawa River (median 5.7 ng/L) and the Sumidagawa River (median 13.4 ng/L) were one order of magnitude lower than those 20 years ago. Similarly, the TCS and BPA concentrations (median 27.0 ng/L and 11.0 ng/L, respectively) decreased by ~80% compared to the values obtained in studies conducted ~20 years ago. These decreases can be attributed to reduced production due to the establishment of environmental standards and industrial self-regulation. Most target chemicals had higher concentrations in the STP effluents than in river water, indicating that STP effluents are major sources of the chemicals. However, BPA in the Tamagawa River exhibited a different spatial pattern. Namely, BPA concentrations in the STP effluents (~5 ng/L) in the middle and lower reaches were lower than those in the receiving water (~15 ng/L). Meanwhile, effluents from two upstream STPs had extremely high BPA concentrations of up to 158 ng/L, revealing effluents from these STPs as major sources of BPA in the Tamagawa River. There are several landfills in the upstream STP catchment area, and their leachate is likely to contribute to the high concentrations of BPA in the STP effluents and river water. This is consistent with the composition of BPA and its alternatives, including BPAP, BPZ, BPS, BPB, BPE, BPF, BPAF, in the effluents from the STPs. The upstream STPs showed a predominance of BPA, whereas the alternatives, such as BPS and BPF, were dominant in the STPs in the middle and lower reaches. The compositional difference can be ascribed to the recent replacement of BPA with alternatives and BPA leaching from plastic products dumped in the 1980s and 1990s.

Endocrine disrupting chemicals (EDCs) generally refer to anthropogenic compounds that mimic hormones when taken into an organism. When these chemicals bind with a hormone receptor, they act like a natural hormone to modulate the reproductive system. They require the same structure as a hormone to bind to a receptor (Metzler and Pfeiffer, 2001). There are many types of EDCs in the environment. Among them, estrogenic EDCs have received particular attention. Estrogenic EDCs have a phenolic structure as found with natural estrogens. For estrogenic EDCs, a phenolic structure is considered the key for binding to an estrogen receptor (Mueller and Korach, 2001). This study focuses on the phenolic structure, in terms of estrogenic endocrine disruption potential, and systematically analyzes a wide range of phenolic compounds using direct derivatization. The target compounds in the present study include alkylphenols (APs), bisphenol A (BPA) and its analogues, triclosan (TCS), thymol, and phenolic UV filters.
First, in the present study, we developed an analytical method to systematically analyze a wide range of phenolic compounds. A direct (i.e., in-water) derivatization method was developed. This method has the advantage that it can simultaneously derivatize the target compounds to inert acetylates in sample water (i.e., river water and sewage effluents) before extraction, facilitating the extraction and purification of polar compounds. Moreover, since the contamination of acetyl derivatives of the target compounds is unlikely to occur during the analytical procedure, direct derivatization in sample water can lower the procedural blank and limit of quantification. Finally, the developed method was applied to the analysis of river water and sewage treatment plant effluent samples to investigate the behavior and sources of the phenolic compounds.
APs and BPA are typical estrogenic EDCs (Markey et al., 2001). APs, including nonylphenols (NPs) and octylphenol (OP), are used as raw materials for non-ionic surfactants, namely alkylphenol polyethoxylates (APEOs), which are used for industrial detergent. APEOs are converted to APs during sewage treatment (Giger et al., 1984; Ahel et al., 1994). APs are also used as antioxidants in plastics (Gilbert et al., 1986) and have been detected in plastic products (Yamashita et al., 2019). Their leaching could be a source of APs in sewage and river water. The exposure and effects of APs have been assessed in relation to freshwater fish, such as rainbow trout (Jobling et al., 1996). In their study, they suggested that APs, including nonylphenols, exhibit estrogenic activity. In Japan, nonylphenols have been regulated by the environmental quality standards for the conservation of the living environment since 2012 (Ministry of the Environment, 2012). BPA is used as a composite monomer of polycarbonates and epoxy resins. Polycarbonates are widely used for hard plastic products such as CDs, home appliances, medical devices, and tableware. BPA is also used as a plastic additive. For example, BPA is used as an antioxidant for polyvinyl chloride (PVC) (Kawanaka et al., 2000; Yamamoto and Yasuhara, 2000; EU, 2009). In addition, BPA has been detected in plastic products made of polyethylene (PE), polypropylene (PP), and acrylate-styrene, indicating that BPA is used as a plastic additive for a variety of plastic products (Rani et al., 2015). Moreover, BPA is used as a color developer for thermal paper. Among the millions of tons of plastics produced globally (Bailin et al., 2008), polycarbonates and epoxy resins are the dominant application of BPA, while additives constitute minor applications (Vasiljevic and Harner, 2021). In Japan, polycarbonates and epoxy resins represent 66.3% and 26% of BPA production, respectively, whereas, in 1997, plastic additives and thermal paper accounted for 2.7% and 0.4%, respectively (National Institute of Technology and Evaluation, 2003). Howdeshell et al. (1999) suggested that the exposure of female mouse fetuses to BPA induces early puberty. In addition to the endocrine disrupting activity, BPA exposure is associated with human disease, metabolic disease, oxidative stress, and cancer (Rochester, 2013; Seachrist et al., 2016). In recent years, BPA has been replaced with its analogues due to concerns about its toxicity. However, it has been reported that some BPA alternatives (e.g., bisphenol S, BPS; bisphenol F, BPF; and bisphenol AF, BPAF) also exhibit endocrine disruption activity (Matsushima et al., 2010; Eladak et al., 2015) and are associated with type 2 diabetes mellitus and oxidative stress, as seen with BPA (Duan et al., 2018; Wang et al., 2019).
Synthetic chemicals used as pharmaceuticals and in personal care products (PPCPs) have increased concern as emerging contaminants due to their widespread use. Antimicrobial and UV filters are frequently used in PPCPs. They are used in a variety of consumer products, such as soaps, cosmetics, and sunscreen. Some PPCP chemicals have a phenolic structure and reportedly exhibit endocrine disruption activity (Brausch and Rand, 2011). TCS is used as an antimicrobial agent in personal care products, such as hand soap and toothpaste. Raut and Angus (2010) reported that TCS has the potential to act as an endocrine disruptor in male mosquitofish. TCS displays not only estrogenic, but also androgenic activity (Gee et al., 2008). Based on an extensive review, The Florence Statement on TCS and Triclocarban concluded that TCS is an environmentally persistent endocrine disruptor and toxic to aquatic and other organisms (Halden et al., 2017). In the EU and the USA, TCS was banned for use in soaps (European Chemical Agency: ECHA, 2015; U.S. Food and Drug Administration: FDA, 2017). Since 2016, the Japanese government has urged industries not to use TCS (Ministry of Health, Labor and Welfare, 2016). UV filters and stabilizers are used in plastic products as well as personal care products. Among UV filters, BP3 has endocrine disruption potential (Brausch and Rand, 2011). BP3 showed slight estrogenic activity in an MCF-7 human breast cancer cell proliferation assay and pS2 protein assay (Schlumpf et al., 2001; Schlumpf et al., 2004). The estrogenic activity of drometrizole (UVP) was reported recently (Sakuragi et al., 2021).
APs, BPA, and TCS were monitored in river water in Tokyo ~20 years ago (Isobe et al., 2001; Nakada, 2003; Nakada et al., 2006) and some regulations have been passed (Ministry of the Environment, 2012; Ministry of Health, Labor and Welfare, 2016). To see the temporal trend of contamination and to evaluate the effectiveness of countermeasures, it is important to monitor the current levels of EDC pollution.
The objectives of the present study were 1) to develop an analytical method to systematically analyze spectra of phenolic compounds based on in-water acetylation, and 2) to monitor the pollution status of the APs, BPA and its alternative bisphenols, TCS, thymol, and phenolic UV filters, in rivers and sewage effluent in Tokyo from 2016–2019, and discuss their sources and temporal trends.
This study was conducted in the Tamagawa River and the Sumidagawa River and their catchment areas. Both rivers run through Tokyo, Japan. The Tamagawa River is 140 km long with a drainage area of 1,240 km2 and a water flow of ~10 m3/s under low flow conditions. The population in the catchment area is approximately three million. The Tamagawa River has eight municipal sewage treatment plants (STPs) in the drainage area, six of which were studied in the present work. Secondary treatment (activated sludge treatment) following mechanical treatment (i.e., settlement) are conducted in all the plants. The population served by the individual STPs ranged from around 100,000–500,000 as described in Table S1. In the lower reaches of the river, sewage effluent constitutes half the volume of the river water (Bureau of Sewerage, 2017). The Sumidagawa River has a drainage area of 610 km2 and a population of approximately five million. The river is 50 km long and the water flows at approximately 30 m3/s. Of the 10 STPs in the drainage system, one STP (STP-S) was selected to collect sewage effluent. In the lower reaches of the Sumidagawa River, the secondary effluent represents ~70% of the river water (NILIM Public Investment Project Team, 2005).
The river water and the sewage effluent were collected during 11 surveys in 2016–2019 (May, November 2016; May 2017; May, December 2018; February, May, June, July, August, November 2019). The river water samples were obtained at 16 locations along the Tamagawa River and its tributaries and at four locations along the Sumidagawa River, as shown in Fig. 1. For each survey, the river water and effluent samples were collected within two weeks. The sampling locations and dates are detailed in Table S2 and Table S3. Grab samples of river water were collected from a bridge or at the riverside. Grab samples of the STP effluents were collected at the outfalls to the rivers. The samples were obtained using a stainless-steel bucket and stored in a 3 L amber glass bottle and transported to the laboratory under cool conditions. The sampling equipment was rinsed with methanol and dried prior to use. The samples were filtered with a pre-baked glass fiber filter (90 mm φ: Whatman GF/F). The filtrates were acidified to pH 3 with HCl to suppress microbial degradation and stored at 4°C until analysis.
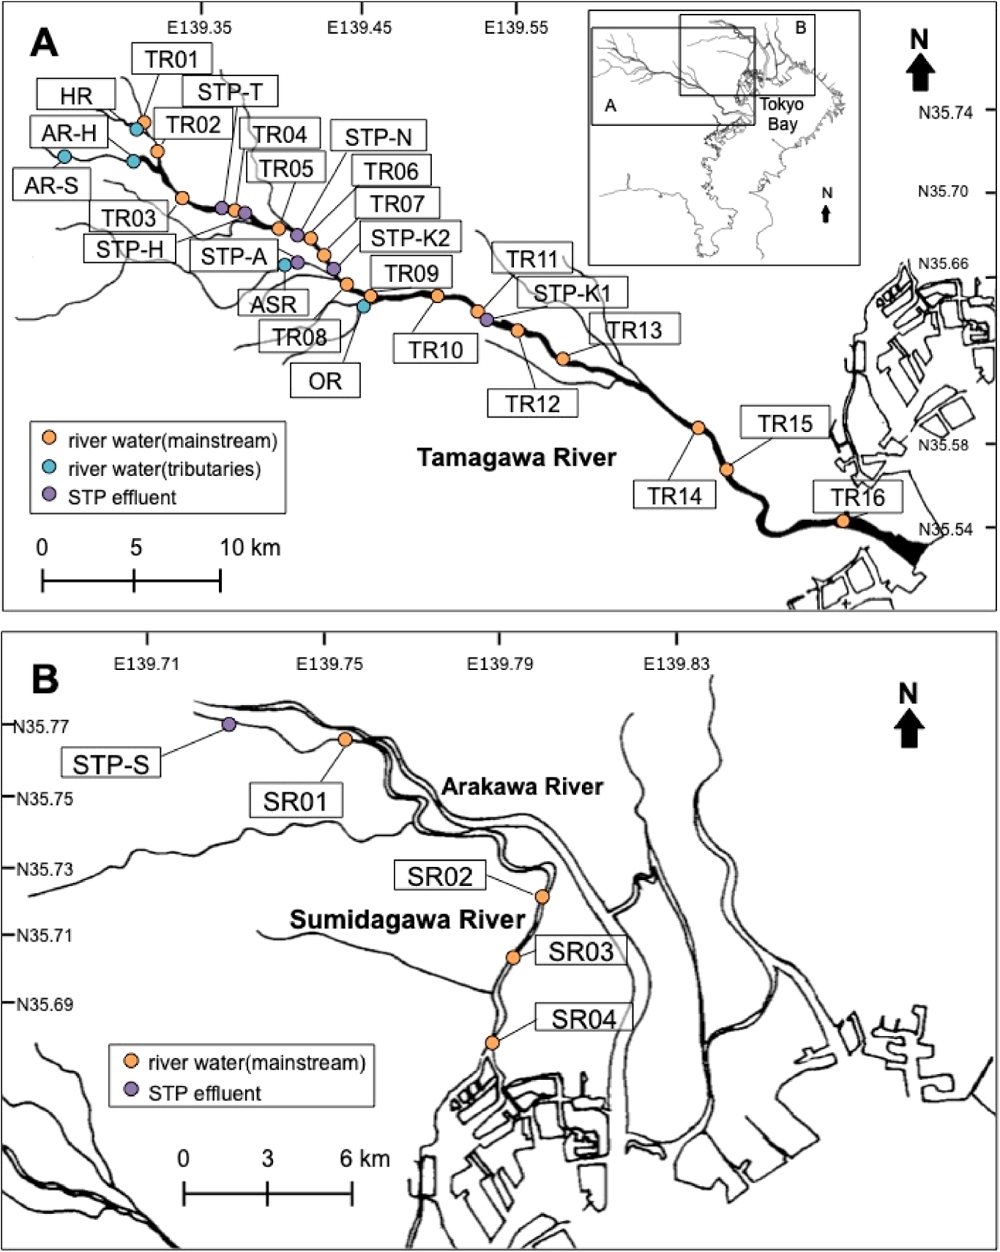
Maps of sampling sites in Tokyo, Japan. A, Tamagawa River area; B, Sumidagawa River area
All solvents and analytical regents were purchased from Wako Pure Chemical Industries, Ltd. (Osaka, Japan), except for dichloromethane (DCM) obtained from Kanto Chemical Co., Inc. (Tokyo, Japan). The grade and pre-treatment of the chemicals were as follows. Hexane, acetone, and iso-octane (2,2,4- trimethylpentane) were guaranteed reagents, and were distilled with a glass apparatus prior to use. The methanol was HPLC grade while the DCM was dioxin analysis grade. The methanol and DCM were used without distillation. Silica gel (wakogel® Q-22, through 75 μm: 200 mesh) was baked for two hours at 400°C to remove organic contaminants. It was then activated for four hours at 200°C and deactivated with 5% (w/w) of distilled water. After deactivation, the silica gel was stored in hexane. The pyridine, acetic anhydride, and potassium carbonate used were guaranteed reagents. Anhydrous sodium sulfate was baked for four hours at 550°C to remove organic contaminants. The solid phase extraction cartridge was a Sep-pak® Plus tC18 Long Environmental cartridge (900 mg) obtained from Nihon Waters K.K. (Tokyo, Japan).
4-nonylphenol (NP, isomer mix) was purchased from Tokyo Chemical Industry (Tokyo, Japan). p-t-octylphenol (OP) was purchased from Dr. Ehrenstorfer GmbH (Augsburg, Germany). 2-isopropyl-5-methylphenol (thymol) and 5-chloro-2-(2,4-dichlorophenoxy)phenol (TCS) were purchased from Wako Pure Chemical Industries, Ltd. 2,2-bis(4-hydroxyphenyl)propane (BPA) was purchased from Kanto Chemical Co., Inc. Oxybenzone (BP3) and drometrizole (UVP) were purchased from AccuStandard, Inc. (New Haven, CT, USA).
2,2-bis(4-hydroxyphenyl)hexafluoropropane (BPAF), 4,4’-dihydroxydiphenylmethane (BPF), 4,4’-ethylidenebisphenol (BPE), 2,2-bis(4-hydroxyphenyl)butane (BPB), bis(4-hydroxyphenyl)sulfone (BPS), 1,1-bis(4-hydroxyphenyl)cyclohexane (BPZ), and 4,4’-(alpha-methylbenzylidene)bisphenol (BPAP) were purchased from Sigma-Aldrich (St. Louis, MO USA). The information for the target compounds is listed in Table S4.
The following isotopically-labeled standards were used as surrogates. 4-n-nonylphenol-2,3,5,6-d4 (d-NP) and 2,2-bis(4-hydroxyphenyl)propane-d16 (d-BPA) were purchased from Kanto Chemical Co., Inc. (Tokyo, Japan). 4-n-octylphenol-d6 (d-OP) and thymol-d7 (d-thymol) were purchased from Hayashi Pure Chemical Ind., Ltd. (Osaka, Japan). 5-chloro-2-(2,4-dichlorophenoxy)phenol-d3 (d-TCS), drometrizole-d3 (d-UVP), 4,4’-ethylidenebisphenol-13C6 (13C-BPE), 2,2-bis(4-hydroxyphenyl)butane-d8 (d-BPB), and 4,4’-(alpha-methylbenzylidene)bisphenol-13C6 (13C-BPAP) were purchased from Toronto Research Chemicals (Toronto, Canada). Oxybenzone-(phenyl-d5) (d-BP3) was purchased from Sigma-Aldrich. 2,2-bis(4-hydroxyphenyl)hexafluoropropane-13C12 (13C-BPAF), 4,4’-dihydroxydiphenylmethane-d10 (d-BPF), and bis(4-hydroxyphenyl)sulfone-13C12 (13C-BPS) were purchased from Cambridge Isotope Laboratories, Inc. (Tewksbury, MA USA). Deuterated polycyclic aromatic hydrocarbons (d-PAHs), i.e., anthracene-d10, perylene-d12, p-terphenyl-d14, and benzo[a]anthracene-d12, were purchased from Supelco, Inc. (North Harrison, PA, USA), and used as an injection internal standard (IIS).
DIRECT ACETYLATION, EXTRACTION, AND FRACTIONATIONFive hundred milliliters of the filtered samples were placed in a 1 L glass bottle and spiked with surrogate standards. Direct acetylation was performed by adding acetic anhydride and potassium carbonate to the water samples to concentrations of 2% and 5%, respectively. The bottles were capped with glass sliding stoppers and stirred for 30 minutes at 40°C with a magnetic stirrer, according to Kurata et al. (1994 with some modification). After acetylation, solid phase extraction was conducted by passing the water sample through a tC18 cartridge at a rate of 10 mL/min. Before use, the cartridge was rinsed with hexane, followed by DCM, and then methanol. Elution of the sample extracts was performed with 3, 2, 2, and 3 mL of DCM and combined extracts were dried with anhydrous sodium sulfate. The eluate was dried using a rotary-evaporator and the solvent was replaced with hexane. The acetylated extract was fractionated with 5% H2O deactivated silica gel column chromatography (1 cm i.d.×9 cm) by elution with 10 mL of 25% DCM/hexane (1st fraction), 25 mL of 40% DCM/hexane (2nd fraction), 5 mL of DCM (3rd fraction), and 30 mL of 30% acetone/DCM (4th fraction). The 2nd fraction contained NP, OP, TCS, and thymol while the 4th fraction contained BPA and its analogues, UVP and BP3. No target chemicals were eluted in the 1st and 3rd fractions. The 2nd and 4th fractions were concentrated, transferred to a glass ampoule, dried under gentle stream of nitrogen, and reconstituted in 50 μL IIS (d-PAHs) isooctane solution.
INSTRUMENTAL ANALYSISOne microliter each of the concentrated second and fourth fractions was injected into a gas chromatograph (Agilent Technology 7890B, Santa Clara, CA USA) equipped with a quadrupole mass spectrometer (Agilent Technology 5977) in the selected ion monitoring (SIM) mode. The instrumental conditions and monitored ions are described in Table S5 and Table S6.
Quantitative standards were prepared as follows. Appropriate volumes of working standard solutions (0.5–10 ppm) were mixed in a vial and concentrated under a gentle nitrogen stream until they were less than 100 μL. Then, 50 μL of acetic anhydride and 50 μL of pyridine were added to the vial and agitated. It was left overnight, and 0.3 mL of 4 M HCl was added to stop acetylation. Acetylated standards were liquid-liquid extracted with 2 mL of hexane and dried with Na2SO4. The hexane was evaporated under a gentle nitrogen stream and samples were resolubilized in an appropriate volume of isooctane with IIS for GC-MS analysis. Quantification was undertaken in the SIM mode, and the monitor ions are listed in Table S5. Five-point quantitative calibration curves (0.625, 1.25, 2.5, 5, and 10 μg/mL for NP; 0.0625, 0.125, 0.25, 0.5, and 1 μg/mL for OP and UVP; 0.125, 0.25, 0.5, 1, and 2 μg/mL for thymol, TCS, and BP3; 0.25, 0.5, 1, 2, and 4 μg/mL for BPA; and 0.5, 1, 2, 4, and 8 μg/mL for bisphenol analogues) were obtained. All calibration curves for the target compounds demonstrated high linearity (R2≥0.99), except for BPS, which was regressed by a quadratic curve. They were quantified by comparing the integrated peak area obtained with single or totaled selected ion monitors with the peak area of the corresponding IISs (see Table S5). NP is a mixture of isomers with different branched alkyl chain structures, and there were 10 peaks in the mass fragment chromatogram as shown in Fig. S1. Calibration curves and quantification were obtained for individual peaks. The NP standard used for quantification was a mixture of isomers and the isomer composition is available in Katase et al., (2008). The sum of the concentrations of nine peaks are expressed as “NP concentration” in the present study, excluding peak 3, which overlapped with an interfering peak in most samples.
QUALITY ASSURANCE AND QUALITY CONTROLThe concentrations of the target chemicals were quantified and corrected using the recovery of surrogate standards (Table S5) spiked prior to direct acetylation. The limit of detection (LOD) was calculated based on the signal to noise ratio in corresponding mass fragment chromatograms. The LOD was normally 0.01–0.1 ng/L for all the compounds except BPS and total NP (Table S7) when 500 mL of water was analyzed. The higher LOD for BPS was due to higher polarity, resulting in lower sensitivity in the GC-MS analysis. The higher LOD for NP was due to the summation of nine peaks in the totaled ion monitoring chromatograms of the nine ions listed in Table S5. Travel blanks were run with every set of (normally seven) samples to check potential contamination during sampling and analysis. The limits of quantitation (LOQ) for the target chemicals were defined as three times the concentrations in the travel blanks. The LOQ values are listed in Table S7 and were normally less than 2 ng/L for all the compounds, with the exception of total NPs (16 ng/L) and BPS (15 ng/L). To test the reproducibility, a triplicate analysis was performed for STP effluent samples, and the RSDs of the target compound concentrations were largely within 10%, as listed in Table S7. To check the recoveries of the target compounds throughout the entire analytical procedure, the STP effluent sample was spiked with a mixture of native standards and analyzed. The recoveries for most of the compounds exceeded 75%, as listed in Table S7.
STATISTICAL ANALYSISStatistical analysis was performed using EZR (version 1.54, Kanda, 2013) on the data of NP, BPA, and TCS for comparison with the results of a previous study of the Tamagawa River and the Sumidagawa River. A t-test or Wilcoxon rank sum exact test was conducted to compare the two groups in the present and previous studies. The Kruskal-Wallis test and the Steel-Dwass test were employed to compare more than three groups. Data were regarded as statistically significant at a p<0.05.
An analytical scheme of a broad spectrum of phenolic EDCs is shown in Fig. 2. The target compounds include nonylphenol (NP), octylphenol (OP), triclosan (TCS), thymol, bisphenol A (BPA) and its alternative bisphenols, oxybenzone (BP3), and drometrizole (UVP) in Table S4. A previous method (Nakada, 2003) acetylated phenolic EDCs just before GC-MS analysis, whereas the present method directly derivatizes the phenolic EDCs to acetylate in sample water before extraction and purification. This has several advantages. Because the polarity of phenolic compounds becomes relatively inert as a result of acetylation, target compounds are less susceptible to adsorption loss during solid phase extraction and purification, especially during column chromatography, and a consistent high recovery was obtained. For example, the recovery of acetylated NP using silica gel column chromatography was 109±6% (n=2), whereas the recovery of non-derivatized NP by chromatography was 57±14% (n=2). Acetylation also reduces the polarity of the interfering materials that are injected into the analytical instrument, and protects the injection port, analytical column, and mass spectrometer from interference by polar components. Furthermore, derivatization before SPE extraction and column chromatography reduces the potential of contamination during the procedure, leading to a lower LOQ. The LOQs of BPA and TCS in the present study were 2 and 0.5 ng/L, respectively, whereas they were 5 and 1 ng/L, respectively, in an earlier study (Nakada et al, 2006). Consequently, the analytical method based on direct acetylation enabled the sensitive and robust analysis of a broad spectrum of phenolic EDCs.

Analytical method with direct acetylation
A summary of the concentrations of target compounds in the Tamagawa River and the Sumidagawa River is presented in Fig. 3 and Table 1. Detailed data are available in Table S8 and Table S9. Concentrations of NP in the river water and STP effluent ranged from 0.6 to 164 ng/L and 4.8 to 1,010 ng/L, respectively. OP concentrations were one order of magnitude lower than NP (river water: <0.3–17.4 ng/L, STP effluent: <1.3–30.5 ng/L). The APs concentrations in the STP effluents were higher than those in the river water, although a few outliers were observed (Fig. 3). Similarly, the BPA concentrations in the STP effluents (<0.9–158 ng/L) were higher than those in river water (<0.3–104 ng/L). The TCS concentrations showed a similar trend, i.e., 9.8–122 ng/L for the STP effluents but were <0.1–38.7 ng/L for the river water. Measured UV filters also showed similar trends. Namely, they were higher in STP effluents (BP3: 2.4–42.6 ng/L; UVP: 1.0–25.2 ng/L) than in river water (BP3: <0.1–14.9 ng/L; UVP: <0.03–12.8 ng/L). These trends indicate that STP effluents are major sources of the target chemicals in the rivers.

Concentrations of Nonylphenol (NP), Octylphenol (OP), Thymol, Triclosan (TCS), Bisphenol A (BPA), BP3, UVP in river water and sewage treatment plant effluent. A: Tamagawa River; B: Sumidagawa River. Cross mark: STP effluent, Circle: River water.
| TR mainstream | TR STP effluent | SR mainstream | SR STP effluent | |||||||||
|---|---|---|---|---|---|---|---|---|---|---|---|---|
| totalNP | 0.6 | – | 149 | 4.8 | – | 1,010 | 0.9 | – | 164 | 13.7 | – | 56.1 |
| OP | 0.3 | – | 17.4 | 1.3 | – | 30.5 | 0.7 | – | 7.2 | 2.5 | – | 16.7 |
| thymol | 0.1 | – | 14.6 | 1.7 | – | 11.2 | 0.3 | – | 5.0 | 1.5 | – | 5.5 |
| TCS | 0.1 | – | 20.4 | 9.8 | – | 79.1 | 2.8 | – | 38.7 | 15.7 | – | 122 |
| BPA | 0.3 | – | 104 | 0.9 | – | 158 | 2.1 | – | 40.4 | 5.5 | – | 67.5 |
| BP3 | 0.1 | – | 12.7 | 2.4 | – | 42.6 | 1.9 | – | 14.9 | 7.3 | – | 24.6 |
| UVP | 0.03 | – | 10.5 | 1.0 | – | 25.2 | 0.5 | – | 12.8 | 3.5 | – | 17.1 |
*The concentrations lower than LOQ were highlighted in gray. The LOQ value were defined as three times of blank concentrations.
The concentrations of APs, TCS, and bisphenols, including BPA, in river water and STP effluents reported in the literature are summarized in Table S10. APs, NP (river water: 0.6–164 ng/L, STP effluent: 4.8–1,010 ng/L), and OP in the present study were lower than those in China (Bahe River, 108–634 ng/L for NP and <1.2–126 ng/L for OP; Wang et al., 2018) and Spain (Iberian rivers, <0.01–391 for NP and <0.14–85 ng/L for OP; Gorga et al., 2015). The TCS levels found in this study (river water: <0.1–38.7 ng/L) were similar to those reported in Spain (<0.17–19 ng/L; Gorga et al., 2015), China (n.d. to 65.6 ng/L; Ma et al., 2018), and Japan (<1–7.5 ng/L; Kiguchi et al., 2016). The levels of BPA observed in the present study (river water: <0.3–104 ng/L) are in the same range as those previously observed by Yamazaki et al., (2015) in Japan (3–120 ng/L), Korea (1.0–272 ng/L), and China (n.d. to 98 ng/L). However, Wang et al. (2018) and Huang et al. (2018) reported one order of magnitude higher concentrations of BPA in the Bahe River and the Luixi River than were found in the present study. The lower concentrations of TCS and BPA in the present study can be explained by the wider coverage of sewage treatment (approximately 100%) in Tokyo and the efficiency and differences regarding the production, use, and regulation of chemicals between the countries or regions.
TEMPORAL TREND IN THE TAMAGAWA RIVER AND THE SUMIDAGAWA RIVERThe results of NP, BPA, and TCS in the present study (2016–2019) were compared with those in previous studies conducted ~20 years ago (Isobe et al., 2001; Nakada, 2003; Nakada et al., 2006). This comparison is shown in Fig. 4. The monitoring of NP in the Tamagawa River and the Sumidagawa River was conducted in 1997 (Isobe et al., 2001). TR12, TR14, and TR16 in the Tamagawa River and SR01, SR02, and SR04 in the Sumidagawa River were the same sampling points as the previous research and the concentration levels of NP for the six locations are presented in Fig. 4 and Fig. S2. The NP concentrations from 2016–2019 in the Tamagawa River ranged from 0.6 to 31.3 ng/L, and those in the Sumidagawa River ranged from 3 to 164 ng/L, which were one order of magnitude lower than those in the 1997 survey (TR: 29–90 ng/L, SR: 71–510 ng/L), with an average reduction of 89%. A nonparametric Wilcoxon test reveals a significant difference between the 1997 study and the present study in both the Tamagawa River and the Sumidagawa River (p<0.001). The decrease in NP concentrations over the last 20 years are attributed to regulation and reduced production. In Japan, NP has been regulated by environmental quality standards for the conservation of the living environment since 2012 (Ministry of the Environment, 2012). In fact, the NP concentrations at all river locations in the present study (0.1–164 ng/L) were lower than the environmental quality standards (600 ng/L). The large reduction (89%) in NP concentrations in river water indicates the effectiveness of the governmental regulation and industrial self-regulation. As Fig. S2 shows, the NP concentrations in the Sumidagawa River were higher than the Tamagawa River, both for the present and the 1997 studies. Both rivers receive a similar proportion (50%–70%) of sewage effluent (NILIM Public Investment Project Team, 2005; Bureau of Sewerage, 2017). The difference between the NP concentrations of the two rivers can be explained by the fact that the NP precursor, NPEO, is used as an industrial detergent in Japan and the Sumidagawa River basin has more industries that utilize NPEO, such as textile and staining industries (Ministry of Economy, Trade and Industry, 2016).

Concentrations of nonylphenol (total NP) and bisphenol A in river water, triclosan in STP effluents in the Tamagawa River (TR) and the Sumidagawa River (SR) in comparison with those in previous studies (a, b, c). a: Isobe et.al (2001) measured NP at TR12, TR14, TR1, SR016, SR02, and SR04 in 1997; b: Nakada et al. (2003) measured BPA at the closest points to TR16 and SR04 in 2001/2002; c: Nakada et. al (2006) measured TCS in STP effluents in Tokyo in 2002/2003.
BPA monitoring in the Tamagawa River and the Sumidagawa River was conducted by Nakada (2003) in 2001 and 2002. Their sampling points were different from those in the present study, although the same reaches were covered. The closest points were selected for a comparison of the 2001–2002 study and the present study (Fig. 4). The BPA concentrations from 2016 to 2019 in the Sumidagawa River ranged from 2.1–40.4 ng/L, which were 93% lower than those in the 2001–2002 study (67.5–164 ng/L). A nonparametric Wilcoxon test revealed a significant difference between the concentrations of the present study and those of the previous study (p<0.001). This decrease can be ascribed to the replacement of BPA with alternatives over the last 20 years (National Institute of Technology and Evaluation, 2003). The Tamagawa River had a smaller decrease (63%), suggesting there might be different sources in the Tamagawa River than the Sumidagawa River, as discussed in a later section.
Nakada et al. (2006) conducted TCS monitoring of municipal wastewater in Tokyo in 2002 and 2003. They measured influents and secondary effluents collected from five municipal STPs in Tokyo. The TCS concentrations in the STP effluents in this study were compared with those in the 2002–2003 study (Fig. 4). TCS also decreased from 26.6–330 ng/L in 2002–2003 to 9.8–122 ng/L in 2017–2019 (p<0.001), with a reduction rate of 77%. The Japanese government started to promote industrial voluntary regulation of TCS in 2016 (Ministry of Health, Labor and Walfare, 2016). Therefore, the decrease in TCS concentrations can be attributed to the phasing out of TCS production. However, a detailed examination of the temporal change showed that the TCS concentrations in STP effluents in 2017 were in a similar range to those in 2002–2003, although self-regulation started in 2016. There appears to be a lag between the reduction in production and the decrease in the sewage TCS concentration. Because TCS was used as an antibacterial agent in personal care products, such as hand soap and toothpaste, and the regulation did not involve a ban on sales or use, the products may have remained on sale and in homes for about one year after the replacement of TCS with an alternative. It is important to continue monitoring to evaluate the effectiveness of the countermeasures.
SPATIAL PATTERN OF EDCs OCCURRENCE IN THE TAMAGAWA RIVERThe concentrations of TCS and BPA at sampling points along the Tamagawa River are presented in Fig. 5. As mentioned above (Fig. 3), all detected EDCs had higher concentrations in sewage effluent than those in river water. The TCS concentrations along the rivers follow this pattern over the entire reaches(Fig. 5–A). In most cases, the TCS concentrations increased from upstream locations (e.g., TR11: 3.9±2.3 ng/L) to adjacent downstream locations (e.g., TR12: 9.3±6.2 ng/L) with the input of corresponding STP effluent (e.g., STP-K1: 27.6±4.9 ng/L).

Boxplots indicating spatial pattern of TCS (A) and BPA (B) in the Tamagawa River.
Summary boxplots present the median value (line in box), interquartile range, and whiskers extending to highest and lowest values.
Numbers in brackets show number of samples collected in 2016–2019.
However, BPA showed a different spatial pattern in the Tamagawa River (Fig. 5–B). In river water, TR04 had the highest concentration (20–70 ng/L) of BPA, and the concentration decreased from upstream (~30 ng/L) to downstream (~15 ng/L). Among the STP effluents, STP-H had the highest BPA concentration (max: 158 ng/L), followed by STP-T (max: 130 ng/L). However, the other STPs located downstream showed lower BPA concentrations (<0.9–36.1 ng/L) than STP-H, STP-T, and river water. This indicates that effluents from STP-H and STP-T are the major sources of BPA into the river water and determine the spatial pattern of BPA in the entire river.
STP-H and STP-T must have a unique source in the catchment area. There are four landfill sites in the STP-H catchment area, and three of them (landfill sites A, B, and D) discharge leachate into the public sewer after treatment in landfill site facilities. The sizes (area and volume) of the landfill sites are 8–22 (×104) m2 and 9–38 (×105) m3, respectively (Ministry of the Environment, 2017). The dumping of municipal waste, including metals, plastics, and incinerator ashes, began in 1982. Landfill sites B and D became full and closed in 1998 and 1997, respectively, while the dumping of waste, consisting mainly of incinerator ash, is still on-going at sites A and C (Ministry of the Environment, 2017; Tokyo Tama Wide Area Resource Recycling Association, 2021). All the landfills are open-air. Rain washes the dumped waste and leachate is generated, even after the sites closed. There are no publicly available data on leachate volume or BPA concentrations in the leachates from the landfill sites. Based on the area of the landfill sites (Ministry of the Environment, 2017) and precipitation data (Japan Meteorological Agency, 2018), the total volume of leachate from landfill sites A, B, and D, which all discharge leachate into the public sewer, is calculated to be 1,920 m3/day. This corresponds to ~1% of the volume of wastewater discharged into the Tamagawa River from STP-H (154,000 m3/day; Ministry of Land, Infrastructure, Transport and Tourism, 2020). It has been reported that landfill leachate has an extremely high BPA concentration ranging from hundreds to millions ng/L and up to 7,900×103 ng/L (Sakamoto et al., 2004; Morin et al., 2015; Teuten et al., 2009; Kwan and Takada, 2019). For Japanese landfill sites, high BPA concentrations of up to 4,960×103 ng/L have been reported (Sakamoto et al., 2004). They are derived from plastic additives (Sakamoto et al., 2004; Teuten et al., 2009), thermal paper (Goldinger et al., 2015), residual monomers (Sakamoto et al., 2007), or monomers generated by the degradation of polycarbonates and epoxy resin (Teuten et al., 2009; Kwan and Takada, 2019). Leachate is treated at the landfill site treatment facilities and further treated at the STPs. However, the removal efficiency of BPA is not 100% (e.g., 95%, Sakamoto et al., 2004; and 70%, Nakada et al., 2007) and the BPA concentration in untreated leachate is extremely high (millions ng/L) and, therefore, the STP effluents are suspected to contain high concentrations of BPA. For example, on the assumption that the BPA concentration in the leachate is 5,000×103 ng/L, the removal efficiency of BPA during individual treatments (landfill site facility and STP-H) is 95%, and the leachate volume is 1% of the STP effluent, we can estimate the BPA concentration to be 125 ng/L. This is in the same order as observed for the STP effluents (median: 93.9 ng/L). However, the landfill sites located in the STP-H, STP-T, and STP-H catchment areas are interconnected through an underground pipeline, and the leachate can be treated in STP-T and discharged there. Therefore, the high concentrations of BPA in the effluents from STP-H and STP-T can be explained by the landfill leachate. This is supported by the unique compositions of the bisphenol analogues in the effluents as discussed in the next section.
OCCURRENCE OF BISPHENOL ANALOGUES IN RIVERS IN TOKYOBisphenol analogues were measured in river water and STP effluents collected from the Tamagawa River and the Sumidagawa River in 2019. The concentration and composition of the bisphenols are shown in Fig. 6. The concentrations for the individual locations are available in Table S11. In the Tamagawa River and the Sumidagawa River, all the BPA alternatives, including BPS, BPF, BPB, BPZ, BPAP, and BPAF, were detected at least once in the river water or effluent samples, except for BPE. The concentrations of the individual bisphenols ranged from <0.1–285 ng/L. The pattern of the BPA alternatives observed in the present study was similar to those reported in wastewaters in Slovenia (Česen et al., 2018). BPS and BPF were predominant in STP-K1, STP-N, and STP-S. The predominant detection of BPS and BPF has often been reported in wastewater and river water in Korea, China, and India (Yamazaki et al., 2015; Huang et al., 2018; Wan et al., 2018). The detection of alternatives (Fig. 6) suggests that the replacement of BPA with alternative bisphenols has been occurring. For example, the BPA used for thermal paper was replaced with bisphenol alternatives in the 2000s in Japan (National Institute of Technology and Evaluation, 2003). The predominant detection of BPS in several effluents and river water samples in the present study (Fig. 6) is consistent with the highest concentrations of urinal BPS in Japanese samples among Asian and Pacific countries (Liao et al., 2012). However, BPA was predominant in effluents from STP-H, STP-T, and the receiving water (TR04) while the alternative bisphenols were trace components in the samples (Fig. 6). These findings suggest that the bisphenols in these effluents are derived from old products prior to their replacement. This is consistent with our idea that BPA is derived from plastic products deposited as landfill in the past before replacement of BPA with alternatives in the 2000s. Municipal solid waste was dumped in landfill sites D and B from 1982–1997 and 1984–1998, respectively (Table S12). Landfill site A has accommodated waste since 1997. The leachate from these landfill sites is likely to contain BPA derived from old plastics before their replacement in the 2000s. Since BPA in thermal paper is neither incorporated nor bound to polymers, it can easily leach into water. Thus, BPA in thermal paper could have been released in the 2000s as it was then in use. Thereafter, BPA was replaced with an alternative, and, therefore, it is unlikely to contribute to leachate today. In contrast, the leaching of additive BPA from plastics can persist for a long time, as additives take time to migrate within a polymer matrix before leaching out. Furthermore, it takes longer for BPA-based polymers (i.e., polycarbonates and epoxy resin) to be depolymerized into their composite monomers. Thus, the leaching of BPA from dumped plastic waste can be considered legacy plastic pollution.

Bisphenols concentrations and composition of BPA and its analogues in the Tamagawa River and the Sumidagawa River. The samples were collected in 2019.
Globally, 8,300 million tons of plastics were produced cumulatively from 1950–2015 and the 60%, i.e., 4,900 million tons of plastic waste, have been deposited as landfill waste or have accumulated in the natural environment (Geyer et al., 2017). Polycarbonates and epoxy resin are estimated to represent approximately 1–2% of total plastic production (National Institute of Technology and Evaluation, 2003; Kaneko 2007; Bailin et al., 2008; Geyer et al., 2017) and, therefore, more than 50 million tons of BPA-based polymers have been dumped in landfill sites throughout the world. They have the potential to release BPA into aquatic environments over many years, as long as their depolymerization can occur. A survey is needed of BPA in leachate and the bodies of water, including groundwater that receive it. It is also important to determine the possibility and rate of the depolymerization of polycarbonates and epoxy resin in landfill sites if we are to assess the magnitude and time span of the legacy pollution of dumped plastics. Furthermore, the leaching of many plastic-derived chemicals, other than BPA, presents another big concern. In fact, high concentrations of phthalates (Gao and Wen, 2016), nonylphenols (Teuten et al., 2009), and polybrominated diphenyl ethers (Kwan et al., 2013; Kwan and Takada, 2019) have been detected in leachates from landfill sites. Plastic products contain various additives, such as plasticizers, antioxidation agents, UV-stabilizers, and flame retardants, where many of them are suspected to be toxic (Andrady and Rajapakse, 2017). In addition, the byproducts formed during plastic production, residual monomers, and monomers generated through depolymerization could be released from dumped plastics. More than 2,000 chemicals associated with plastics, including additives, monomers, and processing aids, are of concern as persistent, bioaccumulative, and toxic chemicals (Wiesinger et al., 2021). The mixed dumping at landfill sites of huge amounts of plastics of various polymers and origins pose the potential risk of introducing a broad spectrum of plastic-derived toxic chemicals into aquatic environments over many years. A comprehensive survey and monitoring of chemicals in leachates and studies looking at ways to reduce the burden are necessary for sustainability.
A direct acetylation method for phenolic EDCs was developed and applied to river water samples and effluent samples taken from the Tamagawa River and the Sumidagawa River. The NP, TCS, and BPA concentrations in the present study were lower than those in previous studies conducted ~20 years ago. NP decreased by ~90%, and TCS and BPA decreased by ~80% due to the establishment of environmental standards or industrial self-regulation. The concentrations of the phenolic EDCs in the STP effluents were higher than those in river water. Municipal wastewater is a major source of all the target compounds, except for BPA. BPA in the Tamagawa River had a different spatial pattern from the other target compounds. STPs in the upstream region, which has several landfill sites in the catchment area, had the highest concentrations of BPA (max: 158 ng/L) and their leachate is likely to contribute to BPA concentrations in the STP effluents and river water in the Tamagawa River. The composition of the bisphenol analogues in STP effluents and river water is consistent with this idea. Namely, that BPA was predominant in the upstream stations and STPs, whereas bisphenol analogues, especially BPS and BPF, were dominant in the river water and STP effluents in the lower reaches, indicating that the replacement of BPA with alternatives has been occurring and BPA could originate from old products dumped in the landfill sites in the 1980s and 1990s. Since vast amounts of plastic waste has been deposited as landfill waste and the release of BPA from dumped plastics through the leaching of additives and depolymerization of polycarbonates and epoxy resin would take a long time, dumped plastics are a source of legacy pollution and will lead to long-term pollution by BPA. As well as studying BPA, it is important that we investigate pollution by other additives found in dumped plastics.
Students and staffs of our laboratory provided welcome assistance on the field and laboratory works. The present study was supported by a Grant-in-Aid (Projects No. 20H00627) supported by Ministry of Education, Culture, Sports, Science and Technology, Japan.
Fig. S1, Mass fragment Chromatogram of nonylphenol acetate of analytical standard; Fig. S2, Nonylphenol concentrations at the individual locations of the Tamagawa River and Sumidagawa River in comparison with those in Isobe et al. (2001); Table S1, Basic information of the sewage treatment plants (STP) surveyed; Table S2, Sampling surveys and the date; Table S3, The information of sampling site; Table S4, Chemical structure, log Kow and monitored ion of the target compounds; Table S5, Monitored ion for GC-MS analysis; Table S6, Method for GC-MS; Table S7, LOD, LOQ, RSD and Recoveries; Table S8, Concentrations (ng/L) of target compounds in the Tamagawa River (sample collected in #1 May 2016 - #10 August 2019); Table S9, Concentrations (ng/L) of target compounds in Sumidagawa River (sample collected in #1 May 2016 - #10 August 2019); Table S10, Concentrations (ng/L) of NP, OP, TCS and Bisphenols in previous studies; Table S11, Concentrations (ng/L) of Bisphenols in Tamagawa River and Sumidagawa River (sample collected in #11 November 2019); Table S12, Information of landfills in the catchment of STP-H.
This material is available on the Website at https://doi.org/10.5985/emcr.20210013.