ABSTRACT
Short-chain chlorinated paraffins (SCCPs) are persistent organic pollutants. In Japan, SCCPs are widely detected in the environment although the production and use of SCCPs have been banned. It is essential to estimate the amount and sources of SCCPs to implement countermeasures for SCCP emission. In this study, we estimated the emission and environmental concentrations of SCCP homologues in Japan from 1950 to 2050. Initially, the material flow of total SCCPs was estimated considering the material recycling process. The emission from each process during the entire life cycle of products containing SCCPs was estimated for each homologue. Volatilization factors of long-term-use products were specifically estimated from release factors and surface area, weight, and SCCP concentration of products containing SCCPs. The environmental concentrations were then estimated using the environmental fate model. In the material flow and emission estimation, parameter uncertainties, such as emission factors and SCCP application distribution, were considered, assuming each parameter follows a uniform distribution. The results of emission estimation suggested a decreasing trend of SCCP emission in recent years and continuation of this trend in the future. However, some emissions from long-term-use products may persist. In the future, products that have a long lifetime with closed-loop recycling, such as polyvinyl chloride wire-coating materials, are expected to significantly contribute to atmospheric emission. Moreover, recycled products may contain SCCPs. Based on the estimated concentration, the estimated water and sediment concentrations were within the range of the observed concentrations. Conversely, we could reduce the gap between the estimated and observed atmospheric SCCP concentrations compared with those in previous studies that did not consider the volatilization factor for each SCCP-containing product and material recycling process. However, a difference between the estimated and observed concentrations suggests that some unconsidered emission sources may exist that emit SCCPs into the atmosphere, such as SCCPs as impurities in medium-chain chlorinated paraffins, imported products containing SCCPs, and atmospheric advection from other countries. Hence, it is essential to calculate emissions from sources other than products that intentionally contain SCCPs produced in the past.

INTRODUCTION
Short-chain chlorinated paraffins (SCCPs) are a complex mixture of chlorinated n-alkanes with chain lengths of 10–13 carbons. SCCPs have been listed in Annex I of the Stockholm Convention in 2017 owing to their toxicity, high persistence, long-range transport potential, and bioaccumulation potential (UNEP, 2017), and they are a cause of concern owing to their effect on the environment (Peters et al., 2000).
In Japan, SCCPs had been widely used since 1950 because of their efficacy in industrial production (Tsunemi and Tokai, 2007). SCCPs were largely applied as additives to metalworking fluids in Japan. SCCPs were also included in long-term-use products, such as polyvinyl chloride (PVC), rubber materials, and paint materials (Tsunemi, 2010), e.g., plasticizers and flame retardants. In 2018, the production, use, and import of SCCPs were banned under the Chemical Substances Control Law (JMETI, 2018b). Before this regulation, metalworking industries prohibited the use of SCCPs for metalworking fluids by self-regulation (Harada et al., 2011).
Japan’s Ministry of Environment (JMoE) has reported that SCCPs are widely detected in air, water, and sediment samples based on their annual sampling survey (JMoE, 2021). It reported that atmospheric concentrations of SCCPs remained high compared with those of legacy persistent organic pollutants such as polychlorinated biphenyls and polybrominated diphenyl ethers. This implies that there are still some sources of SCCP emission. Therefore, estimating the amount and sources of emission is essential to formulate countermeasures for SCCP emission.
A few studies have estimated the amount of SCCP emissions in Japan (Tsunemi, 2010; Glüge et al., 2016; JMoE, 2017). Glüge et al. (2016) estimated the global production, use, and emission of SCCPs, including those in Japan. Tsunemi (2010) estimated the amount of SCCPs produced in Japan from 1950 to 2002 and the substance flow and emission of SCCPs in 2001. JMoE (2017) estimated SCCP emissions in Japan from 1950 to 2030. However, these studies have certain limitations regarding the accuracy of emission estimations. Initially, the applications, emission factors, and volatilization factors of SCCPs showed large uncertainties owing to the insufficient availability of data (Tsunemi, 2010). Additionally, these studies could estimate only total SCCP emission, which is the sum of emissions of all SCCP homologues. However, SCCPs have many homologues, and the physicochemical properties of these homologues vary considerably (Gawor and Wania, 2013; Krogseth et al., 2013; Glüge et al., 2016; Endo, 2021). Therefore, volatilization factors of SCCPs from long-term-use products have been suggested to be a variable for each homologue. Moreover, Chen et al. (2019) suggested that the estimated atmospheric concentrations differed between total SCCP-based estimation and homologue-based estimation. Another limitation is the material recycling process of products containing SCCPs has not been considered in these estimations. SCCPs have been detected in recycled products (Brandsma et al., 2019); therefore, processes such as PVC recycling could contribute to maintaining the stock of SCCPs in use. These findings indicate that the amount of SCCP emissions estimated in previous studies cannot comprehensively explain the recent environmental concentrations.
The primary objective of this study was to estimate the amount of SCCP emissions in Japan from 1950 to 2050 for each homologue. To consider the uncertainties of model parameters such as distribution of SCCP applications, emission factors, and the lifetime of long-term-use products, material flow and emissions were estimated iteratively 3,000 times assuming that the parameters follow a uniform distribution with lower and upper limits. In the material flow model, the material recycling process was also included. Moreover, the environmental SCCP concentrations were estimated using the environmental fate model and compared with the measured concentrations to validate the estimated emissions and discuss the existence of unknown emission sources.
MATERIALS AND METHODS
OVERVIEW OF THE MODELS
In this study, the material flow of SCCPs was estimated based on total SCCPs, and the emissions of SCCPs were then estimated based on each homologue. The material flow model of SCCPs comprises three phases (Fig. 1). The production and formulation phase includes the production of SCCP mixtures and the formulation of SCCPs into additive materials. The use phase includes the industrial use of these materials and long-term-use products containing SCCPs. The waste treatment phase includes the disposal of waste containing SCCPs and the recycling of products containing SCCPs. The parameters of material flow and emission estimation were provided in Table 1.

Table 1 Parameters of material flow and emission estimation
| Symbol | Description | Unit | Detailed Information |
|---|
| Material flow analysis |
| Prodt | Amount of SCCPs produced in year t | tons/year | Fig. S1 |
| Impt | Amount of SCCPs imported in year t | tons/year | Fig. S1 |
| Uset | Amount of SCCPs used in year t | tons/year | Eq. 1 |
| Formfc,t | Amount of SCCPs formulated into formulation category fc in year t | tons/year | Eq. 2 |
| IndUsepc,t | Amount of SCCPs used as additives for making production pc in year t | tons/year | Eq. 3 |
| Stockpc,t,pt | Stock of SCCPs in year t contained in long-term-use products pc, which were made in year pt | tons | Eq. 4 |
| Stockpc,t | Stock of SCCPs in year t contained in long-term-use products pc | tons | Eq. 5 |
| LF_Stockt | Stock of SCCPs existing in landfill sites in year t | tons | Eq. 11 |
| Dist_Formfc,t | Distribution proportion of formulation category fc in year t | — | Table S8 |
| Dist_IndUsefc,pc | Distribution proportion of industrial use for production pc from formulation category fc in year t | — | Table S9 |
| Dist_Dispt,pc,dc | Distribution proportion of disposed product pc into waste treatment process dc in year t | — | Fig. S2 |
| Dist_Sludgeapp,t | Distribution proportion of sludge utilization application (including landfill) app in year t | — | Table S1 |
| Disppc,t,pt | Amount of SCCPs in year t contained in disposed long-term-use products, pc, which were made in year pt | tons/year | Eq. 6 |
| DispTreatdc,pc,t | Amount of treated SCCPs contained in products pc by the process dc in year t | tons/year | Eq. 9 |
| MRpc,t | Amount of SCCPs contained in products pc material recycled in year t | tons/year | Eq. 8 |
| DispRatepc,t-pt | Proportion of disposed long-term-use products pc whose production age was t-pt | — | Eq. 7 |
| Sludgeapp,t | Amount of SCCPs contained in sludge, which was utilized for sludge application app in year t | tons/year | Eq. 13 |
| SewageRatet | Proportion of sewage coverage in year t | — | Fig. S3 |
| SewageTreatt | Amount of SCCPs contained in water treated in a sewage treatment plant in year t | — | Eq. 12 |
| IncRateapp,t | Proportion of incineration before sludge utilization app in year t | — | — |
| DegRateSludge | Degradation rate of SCCPs during sludge incineration | — | — |
| DegRateLF | Degradation rate of SCCPs in the landfill site | 1/year | — |
| WeibullCDF | Cumulative distribution function of Weibull distribution | — | Eq. 8 |
| t | Year | year | — |
| pt | Year when the long-term-use products were produced | year | — |
| fc | Category of formulation application of SCCPs | — | — |
| pc | Category of production containing SCCPs | — | — |
| dc | Category of processes related to SCCPs waste treatment | — | — |
| Ypc | Average lifetime of long-term-use products pc | year | Table S10 |
| αpc | Parameter of Weibull distribution | — | Table S10 |
| Emission estimation |
| EmisProcess,t,pc,homo,media | Amount of emitted SCCP homologue homo from the process (process) into environmental media (media) | tons/year | Table 2 |
| EFProcess,media | Emission factor from the process into environmental media | — or 1/year | Table S5 |
| HomoDistprocess | Proportion of each homologue in the process | — | Table S2–S4 |
| Estimation of volatilization factor |
| RRpc,homo | Release rate of SCCP homologue homo from long-term-use products pc | g/(m2s) | Eq. 14 |
| Concpc | Total SCCP concentration in long-term-use products pc | g/g | Table S7 |
| CarbDistpc | Proportion of each carbon length in long-term-use products pc | — | Table S2–S4 |
| VPhomo | Vapor pressure of SCCP homologue homo | Pa | Table S6 |
| VFpc,homo | Volatilization factor of SCCP homologue homo from long-term-use products pc | 1/year | Fig. 2 |
| Areapc | Surface area of long-term-use products pc | m2 | Table S7 |
| Weightpc | Weight of long-term-use products pc | g | Table S7 |
SCCP: short-chain chlorinated paraffin
To consider the uncertainties in the estimation of persistent organic pollutant emissions, some studies conducted uncertainty analyses (Pulles et al., 2006; Glüge et al., 2016). The present study assumed the estimation of material flow and emissions of SCCPs from 1950 to 2050 as one trial. This trial was iterated 3,000 times using Fortran90, assuming that some parameters followed a uniform distribution with lower and upper limits because of the lack of information about parameter values and distribution shape. The source code of the estimation program and input data are provided in the supplementary information along with a detailed discussion on the number of iterations (S.I.3.).
MATERIAL FLOW ANALYSIS OF TOTAL SCCPs
PRODUCTION AND FORMULATION PHASE
The production and formulation phase consists of the production and formulation processes. During production, mixtures of SCCP homologues were produced. The amount of production and import of SCCPs from 1950 to 2016 was obtained from the literature (Tsunemi, 2010; JMoE, 2017) and has been presented in Fig. S1. After 2017, it was assumed that there would be no production and import of SCCPs in Japan. In addition, no export of SCCPs was assumed during the entire estimated period.
During formulation, SCCPs were formulated into additive materials, such as additives for metalworking fluids, plasticizers for PVC, and flame retardants of rubber materials. The amount of SCCPs formulated into each formulation category was estimated using the amount of used SCCPs in Japan (Eq. 1) and formulation distribution (Eq. 2):
|
Us
e
t
=Pro
d
t
+Im
p
t
,
| (1) |
|
For
m
fc,t
=Dist_For
m
fc,t
×Us
e
t
.
| (2) |
The use phase is composed of two processes: industrial use and long-term-use processes. During the industrial use process, the formulated additive materials containing SCCPs were expected to be used in the final products. In the case of additives in metalworking fluids, SCCPs would be used and transferred into the waste treatment phase immediately. In other formulation categories, they would be used to make long-term-use products. The amount of SCCPs for industrial use in each product category was estimated using Eq. 3:
|
IndUs
e
pc,t
=
∑
fc
(
Dist_IndUs
e
fc,pc
×For
m
fc,t
)
.
| (3) |
During the long-term-use process, the stock of SCCPs contained in long-term-use products was increased by the industrial use of SCCPs and material recycling of products containing SCCPs, whereas it was decreased by product disposal. In this study, the annual SCCP stock was estimated for each production year (Eq. 4). The stock for each production year was then summed, and the annual stock of SCCPs for every product category was calculated using Eq. 5. The disposal rate of long-term-use products was determined based on Weibull distribution (Eq. 6 and Eq. 7). To compute Weibull distribution, product age was required (Eq. 8):
|
Stoc
k
pc,t+1,pt
={
0
IndUs
e
pc,t
+M
R
pc,t
Stoc
k
pc,t,pt
-Dis
p
pc,t,pt
(
if t<pt
)
(
if t=pt
)
,
(
if t>pt
)
| (4) |
|
Stoc
k
pc,t
=
∑
pt
Stoc
k
pc,t,pt
,
| (5) |
|
Dis
p
pc,t,pt
=Stoc
k
pc,t,pt
×DispRat
e
pc,t-pt
,
| (6) |
|
DispRat
e
pc,t-pt
=Weibul
l
CDF
(
Y
pc
,
α
pc
,t-pt
)
-Weibul
l
CDF
(
Y
pc
,
α
pc
,t-pt-1
)
,
| (7) |
|
Weibul
l
CDF
(
Y,α,T
)
=1-exp[
-
(
T
Y
)
α
×
{
Γ(
1+
1
α
)
}
α
].
| (8) |
The waste treatment phase includes processes related to waste disposal and recycling. In this study, the products containing SCCPs were treated after their lifetime using the following processes: preprocessing, wastewater treatment, incineration, landfill, material recycling, feedstock recycling, and energy recovery. Initially, the total amount of disposed-off SCCPs was distributed into each process (Eq. 9):
|
DispTrea
t
dc,pc,t
=
∑
pt
(Dis
p
t,pc,pt
×Dist_Dis
p
t,pc,dc
)
.
| (9) |
After material recycling, the amount of recycled SCCPs was assumed to be included in the stock of long-term-use products that contain them (Eq. 4 and Eq. 10). In this study, all product categories, except for agricultural vinyl sheets, were assumed to be closed-loop recycled products. Considering agricultural vinyl sheets, recycled materials were assumed to be utilized for PVC flooring.
|
M
R
pc,t+1
=DispTrea
t
MR,pc,t
.
| (10) |
In the landfill process, the stock of SCCPs in landfill sites was estimated using Eq. 11. In this study, we assumed that the stock of SCCPs in landfill sites would degrade at a uniform rate.
|
LF_Stoc
k
t+1
=LF_Stoc
k
t
×(
1-DegRat
e
LF
)
+
∑
pc
DispTrea
t
LF,pc,t
+Sludg
e
LF,t
.
| (11) |
In the wastewater treatment process, it was assumed that the SCCPs emitted into the water would be treated and partially transferred as sludge and discharge water (Eq. 12). After this process, the sludge containing SCCPs could be utilized as construction materials or in green farms or be dumped in landfills (Eq. 13). In addition, a part of the sludge was assumed to be incinerated before utilization and landfill. The proportion of sewage coverage was obtained from JMLIT (2021) (Fig. S3), and the distribution and incineration proportion of sludge were fixed during the estimation period (Table S1).
|
SewageTrea
t
t
=SewageRat
e
t
×
∑
process
∑
homo
Emi
s
process,t,homo,water
,
| (12) |
|
Sludg
e
app,t
=SewageTrea
t
t
×Dist_Sludg
e
app,t
×{
IncRat
e
app,t
×DegRat
e
Sludge
+(
1-IncRat
e
app,t
)
}.
| (13) |
SCCP emissions were estimated by multiplying the amount of SCCPs in each process, emission factors, and homologue profiles (Table 2). It was assumed that the primary media where SCCP emissions persist are air, surface water, and soil. Moreover, the utilization of wastewater sludge for green farms was regarded as a form of emission to the soil. Soil would play an important role as a secondary SCCP emission source into the atmosphere; however, it was not included in emission estimation in the present study. We considered SCCP emission from the soil to the atmosphere in the environmental fate model.
Table 2 Equations of emissions estimated
| Production and Use |
|---|
| Production | EmisProd,t,homo,media=Prodt×EFProd,media×HomoDistInd |
| Formulation | EmisForm,t,homo,media=(ΣfcFormfc,t)×EFForm,media×HomoDistInd |
| Industrial Use | EmisIndUse,t,homo,media=(ΣfcFormfc,t)×EFIndUse,media×HomoDistInd |
| Long-term Use (Volatilization) | EmisLong,t,pc,homo,media=Stockpc,t×VFpc,homo×HomoDistLong,pc |
| Long-term Use (Other than volatilization) | EmisLong,t,pc,homo,media=Stockpc,t×EFLong,pc,homo,media×HomoDistLong,pc |
| Waste Disposal |
|---|
| Preprocessing | EmisPre,t,homo,media=(ΣpcDispTreatPre,pc,t)×EFPre,media×HomoDistInd |
| Incineration | EmisInc,t,homo,media=(ΣpcDispTreatInc,pc,t)×EFInc,media×HomoDistInd |
| Landfill | EmisLF,t,pc,homo,media=StockLFt×EFLF,media×HomoDistInd |
| Material Recycling | EmisMR,t,homo,media=(ΣpcDispTreatMR,pc,t)×EFMR,media×HomoDistInd |
| Feedstock Recycling | EmisFR,t,homo,media=(ΣpcDispTreatFR,pc,t)×EFFR,media×HomoDistInd |
| Energy Recovery | EmisER,t,homo=(ΣpcDispTreatER,pc,t)×EFER,media×HomoDistInd |
| Wastewater Treatment | EmisSWT,t,homo,media=SewageTreatt×EFSWT,media×HomoDistInd |
| Green Farm | EmisGFM,t,homo,media=SludgeGreenFarm,t |
Relative homologue profiles in industrial mixtures, PVC materials, and rubber materials were obtained from the literature (Krogseth et al., 2013; Wang et al., 2018) and are listed in Tables S2–S4. However, there were no data for the homologue profile in paint materials; thus, it was assumed to be the same as that for industrial mixtures.
PARAMETER UNCERTAINTIES
EMISSION FACTORS
We assumed that emission factors, other than volatilization factors from long-term-use products, have a uniform distribution owing to the unavailability of data. These emission factors were set as the value ranges for total SCCPs by referring to previous studies (Glüge et al., 2016; JMoE, 2017; Chen et al., 2022) and the emission factors used for screening assessment and risk assessment for Chemical Substances Control Law in Japan (JMETI, 2018a) (Table S5).
In this study, volatilization factors were estimated based on the vapor pressure of each homologue, product shape, and SCCP concentration in products. It has been reported that the common logarithm of the SCCP release rate from products is proportional to the common logarithm of multiplying the vapor pressure of homologues and SCCP concentrations in products (Kuramochi et al., 2021). The relationship between the release rate and the vapor pressures of each homologue, product shape, and SCCP concentration in products is shown in Eq. 14. Vapor pressure of each homologue (Table S6) was obtained from the literature (Endo, 2021). The assumed SCCP concentrations in products are presented in Table S7; these values were obtained from previous surveys of products containing SCCPs (Krogseth et al., 2013; Wang et al., 2018). These assumed concentration ranges covered the typical values of PVC flooring and rubber products (Chen et al., 2019), PVC products (Wang et al., 2018; Guida et al., 2020), and wire-coating products (UNEP, 2018). However, the SCCP concentration range of the PVC film did not cover the value reported by Chen et al. (2019).
|
lo
g
10
R
R
pc,homo
=-0.0586+0.44
×lo
g
10
(
Con
c
pc
×CarbDis
t
pc
×V
P
homo
)
.
| (14) |
For estimating volatilization factors [1/year], the release rate [g/(m2s)] was translated based on Eq. 15 using the surface area and weight of products containing SCCPs. The surface area and weight of the long-term-use products containing SCCPs were fixed values as each product category has a typical shape; these values were obtained from production catalogs (JPMA, 2021; JRMA, 2021; VEC, 2021) (Table S7).
|
V
F
pc,homo
=
R
R
pc,homo
×Are
a
pc
×24×365
Weigh
t
pc
×Con
c
pc,carb
.
| (15) |
The application of SCCPs is varied, however, the proportion of each application remains unknown because of the lack of data. Tsunemi and Tokai (2007) reported that approximately half of SCCPs in Japan were used in metalworking fluids. Therefore, the proportion of additives for metalworking fluid for the formulation category was fixed at 50% during the entire estimation period. The proportion of other formulation categories was assumed to follow uniform distribution between the minimum and maximum values (Table S8).
In addition, the formulated additive materials containing SCCPs would be distributed into product categories during the industrial use process. These industrial use distributions were also assumed to follow a uniform distribution (Table S9). In this study, we assumed that SCCPs were present in PVC products (wire coating, agricultural sheet, flooring, film, and other products), rubber materials, and paint materials. Because SCCPs had been detected in various materials such as sealing materials (Koh et al., 2002), polypropylene packaging (Wang et al., 2019), and polyethylene terephthalate and polyethylene (Wang et al., 2018), it is possible that not all SCCP applications in Japan could be covered in this study.
LIFETIME DISTRIBUTION OF LONG-TERM-USE PRODUCTS
Finally, the amount of disposal of long-term-use products was estimated based on stock and lifetime distribution. The average lifetime and shape parameters of the Weibull distribution followed the uniform distribution of the ranges (Table S10).
ENVIRONMENTAL FATE MODEL
Koshiba et al. (2019) estimated environmental concentrations using the Mackay level IV environmental fate model based on MuSEM, which is the Mackay level III model developed by the National Institute for Environmental Studies, Japan (Mackay, 2001; NIESJ, 2020). This model contains the following compartments: air, surface water, seawater, surface water sediment, seawater sediment, and natural, agricultural, and city soils. The environmental fate model used in this study required data on the physicochemical properties shown in Table S6 (Gawor and Wania, 2013; Krogseth et al., 2013; Endo, 2021).
We estimated the SCCP concentration in air, water, soil, and sediment in Japan using the Mackay level IV model for 3,000 emission estimation results. In addition, the environmental concentrations of total SCCPs were estimated using the estimation results by JMoE (2017). The physicochemical properties of total SCCPs were assumed to be mean values of all homologues in Table S6 to estimate environmental total SCCP concentration. In all emission cases, the total amount of water emission was regarded as the emission to surface water, and the total amount of soil emission was regarded as emission to city soil.
RESULTS AND DISCUSSION
ENVIRONMENTAL CONCENTRATIONS
CONCENTRATION TRENDS OF TOTAL SCCPs
Fig. 2 shows the estimated concentrations and observed concentrations in air, water, and sediment using the environmental fate model. The atmospheric SCCP concentrations estimated in this study showed an increasing trend after 1950 (Fig. 2A). The atmospheric SCCP concentration reached a peak value of 72.0 pg/m3 in 1992, considering average emissions. This SCCP concentration is projected to show decreasing trends because of the overall declining trend of SCCP emissions. The average value of the estimated atmospheric concentration in this study was ~10–100 times lower than the average value of the observed atmospheric concentrations (Li et al., 2012; JMoE, 2021; Koshiba et al., 2021). The estimations were updated by considering parameters such as volatilization factors of long-term-use products, which improved the estimation of atmospheric concentrations in this study from that reported by JMoE (2017). However, the improvements in this study could not explain the gap between the previously estimated concentrations and the observed concentrations. Moreover, the maximum atmospheric SCCP concentration obtained in this study was lower than the minimum observed concentrations. This implies that there may be additional unconsidered emission sources in recent years.
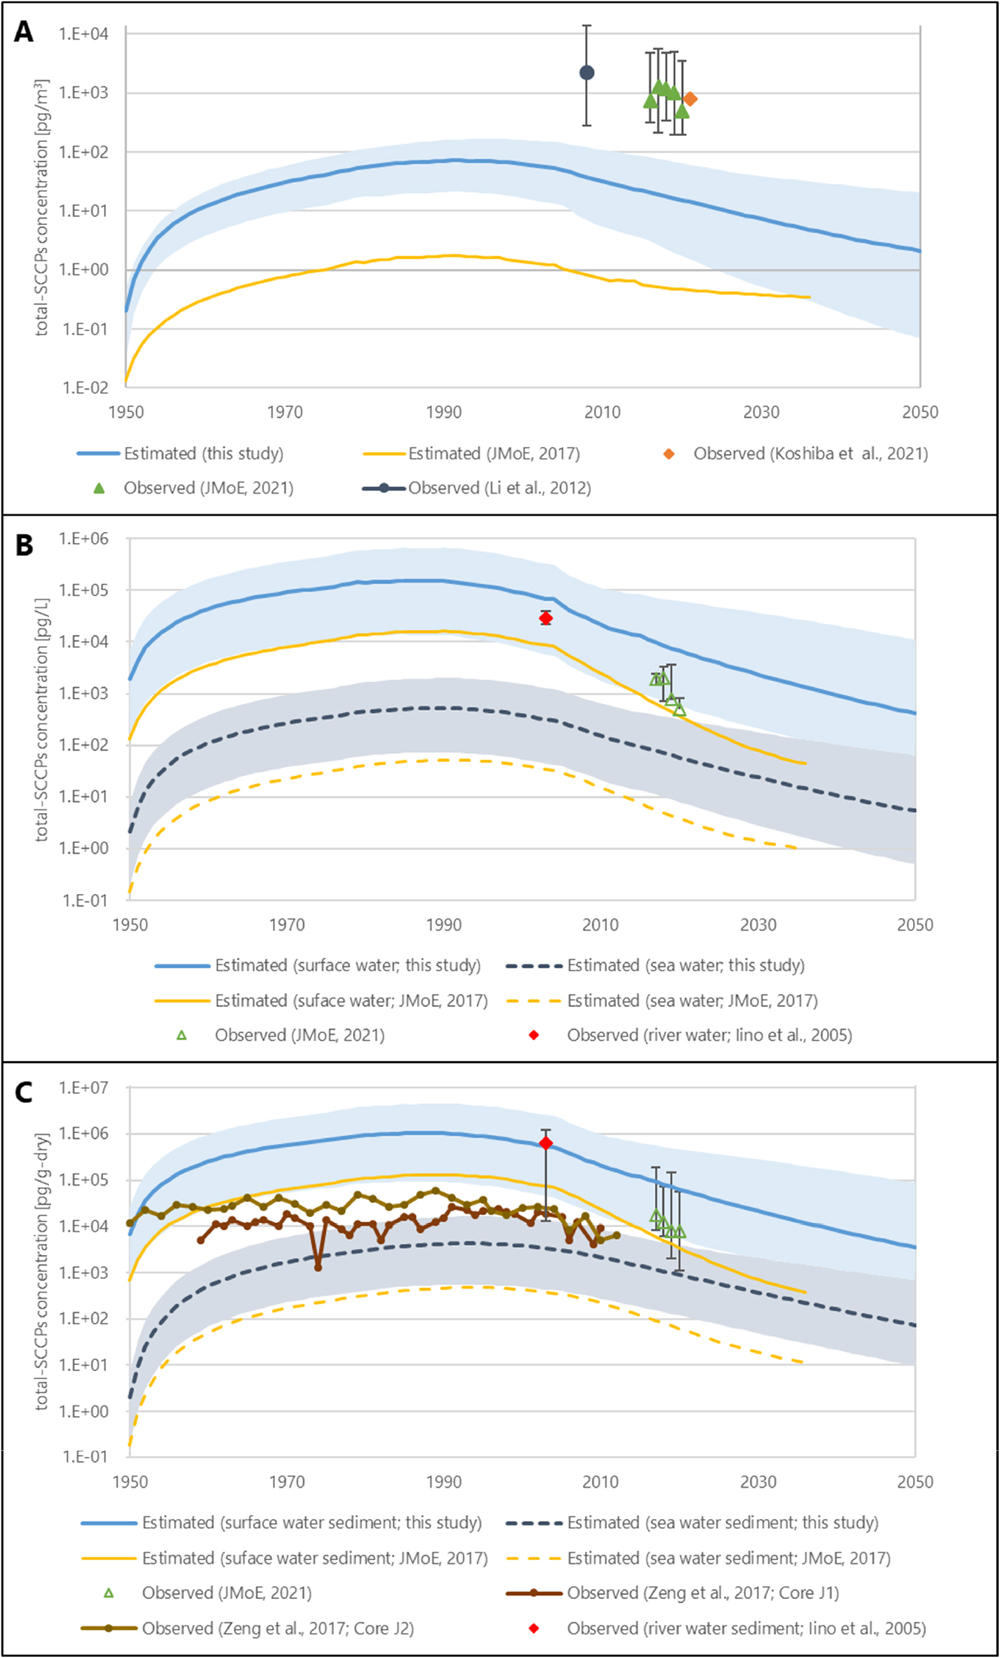
The estimated concentrations in the surface water and seawater differed by 10–100 times (Figs. 2B and 2C). This can be ascribed to the assumption that the total SCCP emission to water was to surface water; however, it is possible that SCCPs were emitted into seawater as they were being used in paint materials exposed to seawater (Fiedler, 2010). The trends of SCCP concentration in water were similar to those in the atmosphere. The general trend was an increase in SCCP concentration after the start of production and use of SCCPs, followed by a decreasing trend in recent years, which will continue in the future. The trends and peaks of water concentrations were also similar to those observed in sediments. Our estimated surface water concentrations of SCCPs were similar to the range of observed river water concentrations (Iino et al., 2005). Seawater sediment concentrations in this study showed levels similar to those in the core sediments in Tokyo Bay (Zeng et al., 2017). Moreover, the surface water sediment concentrations estimated in the current study could explain the observed river water sediment value obtained by Iino et al. (2005). These results indicate that the emission factor assumed herein reflects the actual values more effectively than those of a previous study by JMoE (2017). The estimated water and sediment concentrations of SCCPs from emissions estimated by JMoE (2017) showed greater decreasing trends than the concentrations estimated in this study. This is because JMoE (2017) assumed no water emission from wire-coating materials during long-term use. In the recent monitoring surveys conducted by the JMoE, SCCPs were not detected in water and sediment samples in more than half of the sampling sites (47–48 sites for water and 61–62 sites for sediment; JMoE, 2021). Therefore, it is difficult to compare the estimated and observed concentrations in recent years and to analyze the factors of emission to water from long-term-use products.
HOMOLOGUE PATTERN
The homologue pattern of estimated atmospheric SCCPs was similar to the observed pattern (Fig. 3A). The observations indicate that the patterns tend to have a larger proportion of homologues with shorter carbon chain lengths and lower chlorine numbers. However, in the study of Li et al. (2012), the Cl 6 homologues were the highest in the same carbon length homologues, and we could not reproduce this pattern in this study. The observed homologue pattern may be affected by the air temperature. In the present study, the volatilization factor of each homologue was estimated on the basis of the release experiment under a constant temperature. Therefore, the estimation model in the present study could not reflect the effect of air temperature; thus, there was a gap between the estimated homologue pattern and the observed pattern. In addition, it is possible that an individual emission source affected the atmospheric SCCP homologue pattern. The Cl 4 homologues also had high concentrations (Koshiba et al., 2021). However, in this study, we could not determine the emission and environmental concentrations of Cl 4 homologues because of the lack of data regarding the proportion of Cl 4 homologues in products containing SCCPs. Therefore, the lack of Cl 4 homologues in this estimation would be one of the factors causing the difference between the estimated and observed atmospheric total SCCP concentrations.

Considering the concentration of SCCPs in surface water (Fig. 3B) and surface water sediments (Fig. 3C), the estimated concentrations showed similar levels compared with the observed river water and river water sediment concentrations for almost all homologues (Iino et al., 2005). These results suggest that the estimation of SCCP emission to the surface water can reproduce actual situations during this period.
In the case of seawater sediments (Fig. 3D), we overestimated the proportion of higher chlorinated homologues and underestimated the proportion of lower chlorinated homologues compared with the observed patterns (Zeng et al., 2017). SCCP emission sources in our model did not include potential sources affecting seawater sediment in Tokyo Bay. Moreover, the physicochemical properties of each SCCP homologue, such as half-life and partition coefficient between water and sediment, could affect the estimation results of SCCP concentrations in sea water sediment.
EMISSION ESTIMATION
Fig. 4 shows the estimation results of total SCCP (sum of all homologues) emissions in the air, water, and soil. The atmospheric emission presented an increasing trend after 1950; from 1950 to 1990, the amount of SCCPs produced and used in Japan increased. The peak emission was estimated to be in 1992 (considering average emission), and the range of peak atmospheric total SCCP emission was estimated to be 5.0–54.9 tons/year (average emission was ~ 18.3 tons/year). Future estimations show decreasing trends until 2050. It was estimated that the average air emission was <10 tons/year in recent years. However, the results suggest that there would still be atmospheric SCCP emissions in 2050 from the stock of long-term-use products containing SCCPs. Fig. 5 shows the contribution of each long-term-use product during volatilization. The trends of the primary emission contributors of air emission were assumed to change annually. In 1950, PVC films were a large contributor because of their thin and lightweight properties, which resulted in large volatilization factors. However, because PVC films have a short lifetime, paint materials were considered to be the largest contributor to emissions from 1980 to 2030. In the future, PVC wire-coating material might be a large contributor to emissions as it is a closed material recycling product with a long lifetime.

The emissions into water presented an increasing trend after 1950. The peak emission ranged from 4.0 to 198.9 tons/year, and the average peak emission was 46.7 tons/year. The peak emission from soil ranged from 0.2 to 6.1 tons/year, with an average of 1.7 tons/year. Water and soil emissions showed more rapid decreasing trends than atmospheric emissions. This may be because of the difference in the main emission pathways in each media. Industrial use process had a large contribution to water and soil emissions—unlike atmospheric emission—before the ban on the production and use of SCCP (Fig. S4). Therefore, this 2005 ban likely resulted in a large and immediate reduction of emissions into water.
Although the increasing trends after the start of production and use of SCCPs in Japan were similar in all media, the year of peak average emission varied for each environmental medium (1992 for air, 1979 for water, and 1990 for soil). This difference was attributed to the difference in main emission sources for each environmental medium (Fig. S4). The main emission source for air was the volatilization from long-term-use products; therefore, the peak emission to air lagged behind the year when production peaked. Conversely, most of the water emissions were attributable to the industrial use of metalworking fluid; in this scenario, the peak emission year coincided with the year, which had the peak use of SCCPs. The main emission pathway for soil was from sewage water treatment plants; in particular, the use of sludge in green farms led to the peak emission of soil being different from the peaks of air and water.
The ranges of estimated emissions were the largest in water emission. The maximum emission was ~40 times the minimum emission for each year before 2010. This was because water emission was primarily caused by a single emission source, i.e., the industrial use of metalworking fluid. Thus, the effect of variation of water emission factors was significant for the wider range of emission estimation results. Conversely, the ratios of maximum emission to minimum emission of air were smaller than those of water as there were multiple contributors. However, the ratio of maximum to minimum emissions of air was estimated to show an increasing trend and reached ~35 in 2050. The cause of this increasing trend might be the decline in the number of emission sources, which has a significant effect.
DISCUSSION
Compared with the results of previous studies (Fig. S5), the atmospheric and water emissions had similar values that were between the average emission observed in this study and those reported by Tsunemi (2010). However, the soil emission observed by Tsunemi (2010) was ~50 times lower than the minimum value in this study. This might be because Tsunemi (2010) assumed that there were no soil emissions from long-term-use products. Conversely, the estimation results by JMoE (2017) were considerably lower than those reported in this study. They were at the same level as the minimum values in the case of water and soil observed in this study and lower than the minimum values in the case of air. The lower estimation results by JMoE (2017) may be attributed to the difference in emission factors. The volatilization factors were specifically estimated from the release factors in this study, and they were considerably higher than the values assumed in the JMoE report (2017). In the JMoE report (2017), the soil emission would remain high after 2010 based on the assumption of emissions into the soil from landfill sites.
Comparing the estimated and observed concentrations (Fig. 2), the atmospheric SCCP concentrations were underestimated, whereas water and sediment SCCP concentrations were estimated within the range of the observed concentrations. This suggests the presence of unconsidered emission sources that have contributed to the SCCP concentration in the atmosphere in recent years. Initially, in this study, we estimated the SCCP emission from products in which SCCPs are intentionally used. However, there might be products that unintentionally contain SCCPs, e.g., the impurities in medium-chain chlorinated paraffins (MCCPs) (Yuan et al., 2020). Studies have reported SCCPs in the CP product, which mainly contains MCCPs and LCCPs (Sprengel and Vetter, 2020; Xia et al., 2021). In Japan, assessing the SCCP content when producing and importing MCCP products and keeping SCCP content <1% by weight in MCCPs are necessary (JMoE, 2019). In recent years, ~600 tons of MCCPs have been imported annually (JMoE, 2018). In Japan, the production and import of SCCPs had already been banned; thus, SCCPs present in MCCPs as impurities could become primary emission sources in the future. In addition, imported long-term-use products may contain SCCPs, as reported by Guida et al. (2022b) and McGrath et al. (2021). Moreover, some studies have reported that imported products containing SCCPs played an important role in SCCP inventory in recent years (Babayemi et al., 2022; Guida et al., 2022a). Tong et al. (2022) also suggested the importance of exporting toxic chemicals. Therefore, understanding the amount of SCCPs in imported products and estimating the emission from these products are essential; thus, the trial estimation was conducted as described in Section 3.4. Finally, it was also suggested that SCCPs are introduced into the air in Japan by atmospheric advection as SCCPs have long-range transport properties.
From our estimation results, emission sources would continue to exist in the future (Fig. 4); the primary emission source may be the stock of SCCPs contained in long-term-use products (Fig. S4). These products will be recycled in a closed loop, and they may become significant emission sources, which would result in future stock. In addition, emissions from unanticipated products may contain SCCPs. Therefore, it is important to focus on the recycling process as a countermeasure for SCCP emissions. Moreover, some emission sources may not have been considered. Hence, it is also essential to understand emissions from sources other than those that contain SCCPs and have intentionally resulted in SCCP emissions in the past. This can include closed-loop recycled products that have long product lifetimes, SCCPs as impurities in MCCPs, and imported products containing SCCPs.
TRIAL ESTIMATION OF SCCP EMISSION FROM IMPORTED PVC PRODUCTS
First, the imported amount of PVC products for each product category was estimated in the present study. The imported amount of total PVC products from 1988 to 2016 was obtained from a previous study (Mitsumata and Hashimoto, 2019). We divided the annual imported PVC amount in proportion to the average amount produced in each product category between 2017 and 2021 reported by VEC. The estimated imported amount of each PVC product category is shown in Fig. S6. We assumed that the amount of imported PVC products before 1988 was the value in 1988 and the amount of imported PVC products after 2016 was the value in 2016.
With the estimated imported amount of plasticized PVC, the amount of SCCPs present in imported PVC was estimated using Eq. 16. We assumed that SCCPs would be detected in imported PVC products at a constant rate and SCCPs would be present in the detected PVC products at a constant concentration.
|
Im
p
pc,t
=PVCIm
p
pc,t
×Det
R
pc
×Con
c
pc
.
| (16) |
where Imppc,t: the imported amount of SCCPs present in PVC products, pc in a year, t [tons], PVCImppc,t: the imported amount of PVC products, pc in a year, t [tons], DetRpc: the detection rate of SCCPs in imported PVC products, pc [-], and Concpc: SCCP concentrations in PVC products, pc [w/w].
We assumed the detection rate and SCCP concentrations in imported PVC products considering the observed value by Guida et al. (2022b). Guida et al. (2022b) surveyed imported PVC products in the Japanese market; 38 electrical and electronic cables, 10 house interior products, and 39 children’s products and toys were surveyed. SCCPs were detected in 12 electrical and electronic cables (the average total SCCP concentration was 1,250 mg/kg) and 21 children’s products and toys (the average total SCCP concentration was 8,780 mg/kg). No SCCPs were detected in house interior products. Therefore, we assumed the detection rate of PVC wire-coating products, flooring, and other PVC products as 0.316 (12/38), 0 (0/10), and 0.538 (21/39), respectively, and SCCP concentrations in the wire-coating and other PVC products were assumed to be 1,250 mg/kg and 8,780 mg/kg, respectively. In this study, PVC agricultural sheets and films were also included in the PVC product category. We assumed that the detection rate and concentrations would follow a uniform distribution between certain minimum and maximum values because of the lack of data. The minimum and maximum values were 0–0.538 for the detection rate and 0–8,780 for SCCP concentrations.
According to the above conditions, the emission estimation model described in Section 2 was used for SCCPs present in imported PVC products. Fig. S7 shows the estimation results of air, water, and soil emission from imported PVC products containing SCCPs. During the estimation period, the primary medium for emission was the atmosphere because the primary SCCP emission pathway was volatilization from imported long-term-use products containing SCCPs. The total SCCP emission to all media in 2020 was 0.05–19 tons/year (the average value was 1.7 tons/year; this emission range was similar to that of the atmospheric SCCP emission from SCCPs produced in Japan; the minimum was 0.8, the average was 4.1, and the maximum was 18 tons/year). Therefore, a recent SCCP emission status indicated that imported products containing SCCPs would play an important role. Atmospheric SCCP emission from imported PVC products has increased in recent years following the increased amount of imported PVC products. However, potential uncertainties in future trends such as changes in the imported amount of PVC and SCCP detection rates and concentrations were not considered in this estimation.
The contribution of each product category to the total SCCP volatilization amount is shown in Fig. S8. The results suggested that the primary volatilization source was the PVC film because it was a thin product with a large volatilization factor. However, the detection rate and SCCP concentrations in the PVC film were in the range of observed values for wire coating and toys by Guida et al. (2022b). Therefore, large uncertainties may exist in SCCP emission from PVC films. In contrast, wire-coating materials and other PVC products, in which SCCPs were detected by Guida et al. (2022b), showed a 20% contribution to the SCCP volatilization amount in 2020, suggesting SCCP emission from imported PVC products. PVC flooring, which was assumed not to contain SCCPs, also contributed to this amount (Fig. S8). This was because we assumed that agricultural PVC sheets would be recycled into flooring.
Considering the results of trial emission estimation from imported PVC products, we estimated that SCCP emission from imported PVC products was similar to SCCP emission from products produced in Japan in recent years. Therefore, understanding the SCCP-containing status of imported products is important for future SCCP countermeasures.
CONCLUSIONS
In this study, the SCCP emission and environmental concentration of each homologue (air, water, and sediment) were estimated from 1950 to 2050, considering model parameter uncertainties. In addition, the volatilization factors of long-term-use products were estimated based on the release factors and shapes of products. Environmental concentrations of SCCPs were also estimated using the environmental fate model to compare them with observed concentrations and validate the emission estimation.
The emission of SCCPs presented increasing trends after 1950 and peaked in 1992 for air, 1979 for water, and 1990 for soil (average emissions). Furthermore, the SCCP emissions in the environmental media showed a decreasing trend in recent years, which will continue in the future. However, the results indicate that the SCCP emissions from long-term-use products containing SCCPs will persist until 2050. In particular, volatilization from wire-coating PVC materials would have a large proportion of atmospheric emissions because wire-coating materials have a long lifetime and tend to be recycled in a closed loop. Comparing the estimated and observed concentrations of SCCPs, the water and sediment concentrations were within the range of the observed values. However, the atmospheric concentrations of SCCPs were underestimated by ~10–100 times even in the maximum emission cases. Therefore, it was suggested that there are unconsidered emission sources such as impurities in MCCPs, imported products containing SCCPs, and atmospheric advection. It is also essential to understand the unconsidered emission sources associated with this study.
CONFLICT OF INTEREST
The authors declare that they have no known competing financial interests or personal relationships that could have appeared to influence the work reported in this paper.
ACKNOWLEDGMENTS
This study was supported by the Environmental Research and Technology Development Fund of the Ministry of Environment, Japan (grant number JPMEERF18S20306). The funding source was not involved in the study design, including the collection, analysis, and interpretation of data; the writing of the report; and the decision to submit the article for publication.
SUPPLEMENTARY MATERIAL
Fig. S1, The amounts of produced and imported short-chain chlorinated paraffin in Japan; Fig. S2, Distribution of waste treatment for each product; Fig. S3, Proportion of sewage coverage in Japan; Fig. S4, Proportion of emissions from each process; Fig. S5, Comparison of estimated emissions between this and previous studies (JMoE, 2017; Tsunemi, 2010); Fig. S6, Estimated amount of imported plasticized polyvinyl chloride; Fig. S7, Short-chain chlorinated paraffin (SCCP) emission from imported polyvinyl chloride products containing SCCPs; Fig. S8, Contribution of each product category to the total short-chain chlorinated paraffin volatilization; Table S1, Sludge utilization proportion; Table S2, Homologue profile of industrial mixtures; Table S3, Homologue profile of polyvinyl chloride materials; Table S4, Homologue profile of rubber materials; Table S5, Emission factors for each process; Table S6, Physicochemical properties of short-chain chlorinated paraffin for each homologue; Table S7, Properties of long-term use products; Table S8, Distribution of formulation application of short-chain chlorinated paraffin; Table S9, Industrial use distribution of additive materials containing short-chain chlorinated paraffin; Table S10, Parameters for lifetime distribution; Fig. S9, Relative error to 100,000 iterations of 50–1,000 iterations (air emission estimation); Fig. S10, Relative error to 100,000 iterations of 1,000–50,000 iterations (air emission estimation); Fig. S11, Relative error to 100,000 iterations of 50–1,000 iterations (water emission estimation); Fig. S12, Relative error to 100,000 iterations of 1,000–50,000 iterations (water emission estimation); Fig. S13, Relative error to 100,000 iterations of 50–1,000 iterations (soil emission estimation); Fig. S14, Relative error to 100,000 iterations of 1,000–50,000 iterations (soil emission estimation); Fig. S15, Results of estimated volatilization factors.
This material is available on the Website at https://doi.org/10.5985/emcr.20220014.
REFERENCES
- Babayemi, J.O., Nnorom, I.C., Weber, R., 2022. Initial assessment of imports of chlorinated paraffins into Nigeria and the need of improvement of the Stockholm and Rotterdam Conventions. Emerg. Contam. 8, 360–370. doi: 10.1016/j.emcon.2022.07.004.
- Brandsma, S.H., Brits, M., Groenewoud, Q.R., van Velzen, M.J.M., Leonards, P.E.G., de Boer, J., 2019. Chlorinated paraffins in car tires recycled to rubber granulates and playground tiles. Environ. Sci. Technol. 53, 7595–7603. doi: 10.1021/acs.est.9b01835.
- Chen, C., Chen, A., Zhan, F., Wania, F., Zhang, S., Li, L., Liu, J., 2022. Global historical production, use, in-use stocks, and emissions of short‑, medium‑, and long-chain chlorinated paraffins. Environ. Sci. Technol. 56, 7895–7904. doi: 10.1021/acs.est.2c00264.
- Chen, C., Li, L., Liu, J., Liu, J., 2019. Global environmental fate of short-chain chlorinated paraffins: Modeling with a single vs. multiple sets of physicochemical properties. Sci. Total Environ. 666, 423–430. doi: 10.1016/j.scitotenv.2019.02.157.
- Endo, S., 2021. Refinement and extension of COSMO-RS-trained fragment contribution models for predicting the partition properties of C10-20 chlorinated paraffin congeners. Environ. Sci. Process Impacts 23, 831–843. doi: 10.1039/D1EM00123J.
- Fiedler, H., 2010. Short-chain chlorinated paraffins: Production, use, and international regulations, In: Jacobe, D.B. (ed.), The handbook of environmental chemistry volume 10 chlorinated paraffins, pp. 1–40, Springer, Berlin.
- Gawor, A., Wania, F., 2013. Using quantitative structural property relationships, chemical fate models, and the chemical partitioning space to investigate the potential for long range transport and bioaccumulation of complex halogenated chemical mixtures. Environ. Sci. Process Impacts 15, 1671–1684. doi: 10.1039/c3em00098b.
- Glüge, J., Wang, Z., Bogdal, C., Scheringer, M., Hungerbühler, K., 2016. Global production, use, and emission volumes of short-chain chlorinated paraffins—A minimum scenario. Sci. Total Environ. 573, 1132–1146. doi: 10.1016/j.scitotenv.2016.08.105.
- Guida, Y., Capella, R., Kajiwara, N., Babayemi, J.O., Torres, J.P.M., Weber, R., 2022a. Inventory approach for short-chain chlorinated paraffins for the Stockholm Convention implementation in Brazil. Chemosphere 287, 132344. doi: 10.1016/j.chemosphere.2021.132344.
- Guida, Y., Capella, R., Weber, R., 2020. Chlorinated paraffins in the technosphere: A review of available information and data gaps demonstrating the need to support the Stockholm Convention implementation. Emerg. Contam. 6, 143–154. doi: 10.1016/j.emcon.2020.03.003.
- Guida, Y., Matsukami, H., Kajiwara, N., 2022b. Short- and medium-chain chlorinated paraffins in polyvinyl chloride consumer goods available in the Japanese market. Sci. Total Environ. 849, 157762. doi: 10.1016/j.scitotenv.2022.157762.
- Harada, K., Takasuga, T., Hitomi, T., Wang, P., Matsukami, H., Koizumi, A., 2011. Dietary exposure to short-chain chlorinated paraffins has increased in Beijing China. Environ. Sci. Technol. 45, 7019–7027. doi: 10.1021/es200576d.
- Iino, F., Takasuga, T., Senthilkumar, K., Nakamura, N., Nakanishi, J., 2005. Risk assessment of short-chain chlorinated paraffins in Japan based on the first market basket study and species sensitivity distributions. Environ. Sci. Technol. 39, 859–866. doi: 10.1021/es049221l.
- Japan Paint Manufacturers Association (JPMA) website, 2021. JPMA, Tokyo. https://www.toryo.or.jp/index.html (accessed 14 October 2022) (in Japanese)
- Japan Rubber Manufacturers Association (JRMA) website, 2021. JRMA, Tokyo. https://www.rubber.or.jp/ (accessed 14 October 2022) (in Japanese)
- JMETI, 2018a. CSCL (Chemical Substances Control Law). JMETI, Tokyo. https://www.meti.go.jp/policy/chemical_management/english/cscl/ (accessed 14 October 2022)
- JMETI, 2018b. Table of emission factors used for screening assessment and risk assessment for Chemical Substances Control Law. JMETI, Tokyo. https://www.meti.go.jp/policy/chemical_management/kasinhou/information/ra_emissionfactor.html (accessed 14 October 2022) (in Japanese)
- JMLIT, 2021. Promotion of sewerage coverage. JMLIT, Tokyo. https://www.mlit.go.jp/mizukokudo/sewerage/crd_sewerage_tk_000134.html (accessed 14 October 2022) (in Japanese)
- JMoE, 2017. Evaluation of environmental risks of decabromodiphenyl ether and short-chain chlorinated paraffins. JMoE, Tokyo. https://www.mhlw.go.jp/file/05-Shingikai-11121000-Iyakushokuhinkyoku-Soumuka/0000186574.pdf (accessed 14 October 2022) (in Japanese)
- JMoE, 2018. Risk assessment of short chain chlorinated paraffins being a by-product of medium chain chlorinated paraffins. JMoE, Tokyo. https://www.meti.go.jp/shingikai/kagakubusshitsu/anzen_taisaku/pdf/h29_04_04_s01.pdf (accessed 5 January 2023) (in Japanese)
- JMoE, 2019. Handling of chemical substances containing class 1 specified chemical substances. JMoE, Tokyo. https://www.env.go.jp/chemi/kagaku/index/post_45.html (accessed 5 January 2023) (in Japanese)
- JMoE, 2021. Chemicals in the environment. JMoE, Tokyo. http://www.env.go.jp/chemi/kurohon/index.html (accessed 14 October 2022)
- Koh, I.O., Rotard, W., Thiemann, W.H.P., 2002. Analysis of chlorinated paraffins in cutting fluids and sealing materials by carbon skeleton reaction gas chromatography. Chemosphere 47, 219–227. doi: 10.1016/S0045-6535(01)00293-4.
- Koshiba, J., Hirai, Y., Sakai, S., 2019. Historical and future polychlorinated biphenyl emission trends in Japan. Chemosphere 232, 387–395. doi: 10.1016/j.chemosphere.2019.04.206.
- Koshiba, J., Nagano, T., Hirai, Y., Sakai, S., 2021. Atmospheric PCBs, PCNs, SCCPs, and MCCPs concentrations in Kyoto: Gas/particle partitioning. Poster presented at 41st International Symposium on Halogenated Persistent Organic Pollutants, November 08–11, China and Web.
- Krogseth, I.S., Breivik, K., Arnot, J.A., Wania, F., Borgen, A.R., Schlabach, M., 2013. Evaluating the environmental fate of short-chain chlorinated paraffins (SCCPs) in the Nordic environment using a dynamic multimedia model. Environ. Sci. Process Impacts 15, 2240–2251. doi: 10.1039/c3em00407d.
- Kuramochi, H., Matsukami, H., Kajiwara, N., 2021. Application of an indoor-fate model for representing the behavior of selected flame retardants in waste recycling facilities. Poster presented at 29th Symposium on Environmental Chemistry, WP-030, June 1–3, Osaka, Japan. (in Japanese)
- Li, Q., Li, J., Wang, Y., Xu, Y., Pan, X., Zhang, G., Luo, C., Kobara, Y., Nam, J.J., Jones, K.C., 2012. Atmospheric short-chain chlorinated paraffins in China, Japan, and South Korea. Environ. Sci. Technol. 46, 11948–11954. doi: 10.1021/es302321n.
- Mackay, D., 2001. Multimedia Environmental Models: The Fugacity Approach, second ed. Lewis Publishers, Boca Raton, Florida.
- McGrath, T.J., Poma, G., Matsukami, H., Malarvannan, G., Kajiwara, N., Covaci, A., 2021. Short- and medium-chain chlorinated paraffins in polyvinylchloride and rubber consumer products and toys purchased in Belgian market. Int. J. Environ. Res. Public Health 18, 1069. doi: 10.3390/ijerph18031069.
- Mitsumata, Y., Hashimoto, S., 2019. Assessment of secondary reserves of polyvinyl chloride in Japan. Proceedings of JSCE 75, II7–II15. doi: 10.2208/jscejer.75.6_II_7.
- National Institute for Environmental Studies, Japan (NIESJ), 2020. MuSEM | Simulation models & tools for exposure evaluation. NIESJ, Tsukuba. http://www.nies.go.jp/rcer_expoass/musem/musem.html (accessed 14 October 2022) (in Japanese)
- Peters, A.J., Tomy, G.T., Jones, K.C., Coleman, P., Stern, G.A., 2000. Occurrence of C10-C13 polychlorinated n-alkanes in the atmosphere of the United Kingdom. Atmos. Environ. 34, 3085–3090. doi: 10.1016/S1352-2310(99)00479-3.
- Pulles, T., Kok, H., Quass, U., 2006. Application of the emission inventory model TEAM: Uncertainties in dioxin emission estimates for central Europe. Atmos. Environ. 40, 2321–2332. doi: 10.1016/j.atmosenv.2005.12.015.
- Sprengel, J., Vetter, W., 2020. NMR and GC/MS analysis of industrial chloroparaffin mixtures. Anal. Bioanal. Chem. 412, 4669–4679. doi: 10.1007/s00216-020-02720-7.
- Tong, K., Li, L., Breivik, K., Wania, F., 2022. Ecological unequal exchange: Quantifying emissions of toxic chemicals embodied in the global trade of chemicals, products, and waste. Environ. Res. Lett. 17, 044054. doi: 10.1088/1748-9326/ac5f95.
- Tsunemi, K., 2010. Risk assessment of short-chain chlorinated paraffins in Japan, In: Jacobe, D.B. (ed.), The handbook of environmental chemistry volume 10 chlorinated paraffins, pp. 155–194, Springer, Berlin.
- Tsunemi, K., Tokai, A., 2007. Screening risk assessment of short chain chlorinated paraffins in ecosystems using a multimedia model. Atmos. J. Risk Res. 10, 747–757. doi: 10.1080/13669870701472988.
- UNEP, 2017. Report of the Conference of the Parties to the Stockholm Convention on Persistent Organic Pollutants on the Work of its Eighth Meeting (UNEP/POPS/COP.8/32). Secretariat of the Stockholm Convention, Châtelaine, Switzerland. http://chm.pops.int/TheConvention/ConferenceoftheParties/Meetings/COP8/tabid/5309/Default.aspx (accessed 14 October 2022)
- UNEP, 2018. Draft Technical Guidelines on the Environmentally Sound Management of Wastes Consisting of, Containing or Contaminated with Short-Chain Chlorinated Paraffins (UNEP/CHW/COP.14/7/Add.2). Secretariat of the Basel Convention, Châtelaine, Switzerland. http://www.basel.int/TheConvention/ConferenceoftheParties/Meetings/COP14/tabid/7520/Default.aspx (accessed 26 January 2023)
- Vinyl Environmental Council (VEC), 2021. Introduction of vinyl chloride products for each sector. VEC, Tokyo. https://www.vec.gr.jp/enbi/enbi3_1.html (accessed 14 October 2022) (in Japanese)
- Wang, C., Gao, W., Liang, Y., Jiang, Y., Wang, Y., Zhang, Q., Jiang, G., 2019. Migration of chlorinated paraffins from plastic food packaging into food simulants: Concentrations and differences in congener profiles. Chemosphere 225, 557–564. doi: 10.1016/j.chemosphere.2019.03.039.
- Wang, C., Gao, W., Liang, Y., Wang, Y., Jiang, G., 2018. Concentrations and congener profiles of chlorinated paraffins in domestic polymeric products in China. Environ. Pollut. 238, 326–335. doi: 10.1016/j.envpol.2018.02.078.
- Xia, D., Vaye, O., Lu, R., Sun, Y., 2021. Resolving mass fractions and congener group patterns of C8-C17 chlorinated paraffins in commercial products: Associations with source characterization. Sci. Total Environ. 769, 144701. doi: 10.1016/j.scitotenv.2020.144701.
- Xu, C., Gao, L., Zheng, M., Qiao, L., Cui, L., Wang, K., Huang, D., 2019. Short- and medium-chain chlorinated paraffins in commercial rubber track products and raw materials. J. Hazard. Mater. 380, 120854. doi: 10.1016/j.jhazmat.2019.120854.
- Yuan, B., Tay, J.H., Papadopoulou, E., Haug, L.S., Padilla-Sánchez, J.A., de Wit, C.A., 2020. Complex mixtures of chlorinated paraffins found in hand wipes of a Norwegian cohort. Environ. Sci. Technol. Letters 7, 198–205. doi: 10.1021/acs.estlett.0c00090.
- Zeng, L., Lam, J.C.W., Horii, Y., Li, X., Chen, W., Qiu, J.W., Leung, K.M.Y., Yamazaki, E., Yamashita, N., Lam, P.K.S., 2017. Spatial and temporal trends of short- and medium-chain chlorinated paraffins in sediments off the urbanized coastal zones in China and Japan: A comparison study. Environ. Pollut. 224, 357–367. doi: 10.1016/j.envpol.2017.02.015.

