ABSTRACT
Organohalogen compounds (OHCs) are persistent environmental contaminants that can pose health risks to both humans and animals. This study aimed to assess the contamination levels of OHCs in dry and wet pet foods sold in Japan and evaluate their potential health implications for companion animals.
Results indicated that OHCs were widely present in all types of pet foods analyzed, with dry foods generally exhibiting higher contamination levels than wet foods. Polychlorinated biphenyls (PCBs), dichlorodiphenyltrichloroethanes (DDTs), chlordanes (CHLs), hexachlorocyclohexanes (HCHs), polybrominated diphenyl ethers (PBDEs), and decabromodiphenyl ethane (DBDPE) were detected in varying concentrations across different pet food types. The contamination profiles differed based on the raw materials and country of origin. Estimations of OHC concentrations from raw materials highlighted potential contamination sources beyond ingredient-related contributions, including the manufacturing process.
Moreover, risk assessments were conducted to evaluate the potential health risks posed by OHCs exposure through pet food consumption. While PBDEs, CHLs, and DDTs generally posed low risks, PCBs were found to be of concern, particularly in pet foods containing salmon as a primary ingredient. The results underscored the importance of considering the type of pet food and its raw materials when assessing exposure risks.
INTRODUCTION
The enduring impact of organohalogen compounds (OHCs), including polychlorinated biphenyls (PCBs), polybrominated diphenyl ethers (PBDEs), and organochlorinated pesticides (OCPs), has been unequivocally established. Their persistent nature in the environment and propensity for bioaccumulation have led to the induction of reproductive disorders, neurotoxicity, and endocrine disruption, as reported by Alharbi et al. in 2018. In response to this alarming scenario, the Stockholm Convention on Persistent Organic Pollutants has taken decisive action by imposing a ban on the production, usage, distribution, and disposal of these hazardous environmental contaminants. However, despite such efforts, the presence of these deleterious OHCs continues to endure in both humans and wildlife, evoking concerns regarding their potential ramifications.
Contamination of OHCs have been documented in companion animals such as cats and dogs in living environments shared with humans (Mizukawa et al., 2016; Nomiyama et al., 2022). Both anthropogenic and naturally occurring OHCs have been detected in the serum of domestic cats and dogs across various countries, including the USA, Pakistan, UK, Australia, Japan, Spain, Sweden, and Thailand, as reported by several studies (Dye et al., 2007; Venier and Hites, 2011; Ali et al., 2013; Guo et al., 2012, 2016; Dirtu et al., 2013; Chow et al., 2015; Norrgran et al., 2015, 2017; Henriquez-Hernandez et al., 2017; Shimasaki et al., 2022). Of particular concern is the observation that serum concentrations of PCBs and PBDEs in cats living in shared environments are significantly higher, ranging from one to two orders of magnitude, compared to those found in humans (Guo et al., 2012; Ali et al., 2013). This disparity raises apprehension about the potential health implications of such elevated levels of OHCs in these companion animals, urging the need for further investigation and comprehensive measures to mitigate the risks posed by these persistent and bioaccumulative compounds.
Pet monitoring studies conducted in both Sweden and the United States have yielded concerning findings that highlight the impact of OHCs on the health of cats. Specifically, concentrations of PCBs and PBDEs congeners in the serum of cats diagnosed with hyperthyroidism were found to be significantly higher than those observed in healthy cats (Norrgran et al., 2015; Guo et al., 2016). Moreover, cats with diabetes-induced acromegaly demonstrated significantly elevated levels of PCBs, PBDEs, dichlorodiphenyltrichloroethanes (DDTs), and hexachlorocyclohexanes (HCHs) (Dirtu et al., 2013; Norrgran et al. 2015; Lau et al. 2017). Another worrisome aspect is the potential of these contaminants to interfere with the reproductive abilities of pets. A recent study revealed that exposure to PCB-153 could lead to an increased incidence of cryptorchidism (undescended testicles) and a reduction in sperm quality (Sumner et al., 2019). Additionally, there was an observed negative correlation between exposure to PBDEs and the number of Sertoli cells, which indicates a decrease in the proliferative activity of male germ cells (Lea et al., 2016; Sumner et al., 2021). These findings underscore the urgency of comprehending the implications of OHC exposure on the health and well-being of companion animals.
Indeed, cats and dogs are primarily exposed to OHCs through their consumption of pet food, as evidenced by various studies (Dye et al., 2007; Venier and Hites, 2011; Ali et al., 2013; Mizukawa et al., 2016; Norrgran et al., 2017). Research conducted in the United States and Thailand has estimated that the contribution of PBDEs via food ranges from 36% to 50% and 78%, respectively (Dye et al., 2007; Mensching et al., 2012; Shimasaki et al., 2022). Notably, a previous study demonstrated that PBDE levels in dry pet food produced in the United States were remarkably higher by two orders of magnitude when compared to products from other countries (Shimasaki et al., 2022). Moreover, investigations have revealed elevated concentrations of PBDEs, methoxylated-PBDEs (MeO-PBDEs), and PCBs in cat foods made from seafood as opposed to those made from chicken (Shimasaki et al., 2022). These findings indicate that pet food contamination may be influenced by the raw materials used in its production and the country of origin. MeO-PBDEs have been found in high concentrations in various marine animals, and their origin is known to be naturally formed in the ocean by marine algae or cyanobacteria (Teuten et al., 2005; Haraguchi et al., 2009; Nomiyama et al., 2011). These findings strongly suggest that the primary route of MeO-PBDEs exposure in domestic cats is through their dietary intake of pet foods made from seafood (Mizukawa et al., 2016).
Epidemiological investigations have revealed that certain factors, such as indoor habitation and the consumption of wet food, may contribute to the increased prevalence of feline hyperthyroidism, a condition commonly found in elderly cats aged over 10 years. Notably, these studies have pointed to the potential involvement of OHCs exposure from canned food and house dust in the development of feline hyperthyroidism. These studies indicate that OHCs contamination in pet food may have adverse effects on pet health, but there are few detailed studies of OHCs in pet food from Japan.
The objective of the present study is to comprehensively investigate the levels of various OHCs in cat and dog food, focusing on the most purchased types of feeds in Japan during the period of 2018–2019. The specific OHCs under scrutiny include PCBs, OCPs, brominated flame retardants (BFRs): PBDEs, decabromodiphenyl ethane (DBDPE), and MeO-PBDEs. By analyzing the contamination levels of these OHCs in pet food, this study aims to provide a clear understanding of the potential risks posed to companion animals, specifically dogs and cats, through their daily intake of these feeds.
MATERIALS AND METHODS
CHEMICALS
We purchased the standard mixture of BFRs; including 31 PBDEs, DBDPE, pentabrominated ethyl benzene (PBEB), 1,2-Bis(2,4,6-tribromophenoxy)ethane (BTBPE), and 56 PCBs, and 13C12-labeled pentachloroanisole, 13C12-labeled PCBs (CB-52, -95, -101, -105, -118, -138, -153, -156, -157, -167, -170, -178, -180, -189, -194, -202, -206, -208, and -209), and 13C12-labeled BDE-209 from Wellington Laboratories Inc. (Guelph, ON, Canada). OCPs including 6 DDTs, 3 HCHs, hexachlorobenzene (HCBz) and 5 chlordanes (CHLs) and 6-OH-BDE-47, and 13C12-labeled p,p'-DDT and 13C12-labeled HCHs were purchased from Cambridge Isotope laboratories Inc. (Tewksbury, MA, USA). 6-F-BDE-47 and 4'-F-BDE-208 were purchased from Chiron AS (Trondheim, Norway). 2’-OH-BDE-68 and 3,5-DiCl-6-MeO-BDE-47 were purchased from Accu Standard (New Haven, CT, USA). Analytical grade dichloromethane, n-hexane, methyl t-butyl ether (MTBE), and silica gel (Wako-gel DX) were purchased from FUJIFILM Wako Pure Chemical Industries Corporation (Osaka, Japan), acetone and anhydrous sodium sulfate from Nacalai Tesque Inc. (Kyoto, Japan), and Bio-Beads S-X-3 from Bio-Rad Laboratories Inc. (Hercules, CA).
SAMPLING OF DRY AND WET TYPES OF CAT AND DOG FOODS
Dog food (n=46; dry type: 24, wet type: 22) and cat food (n=51; dry type: 25, wet type: 26) were purchased in October, 2018–2019 in Japan. The selections of samples were set their produced countries and brands, considering the import amounts of pet food in Japan and the sales of online suppliers (Japan pet food industry, 2018). The main raw materials produced in the country and the composition written on the wrapping label of each dog and cat food samples were summarized in Table 1 and 2. Also, detailed information of these pet foods is shown in Tables S1–S4 in the Supplementary materials.
Table 1 Sample information of dry food for dog and cat analyzed in this study
| Dry food for dog | Dry food for cat |
|---|
| Sample Ida) | Country of production | Main raw materialsb) | Sample ID | Country of production | Main raw materials** |
|---|
| JPN-DF-D1 | Japan | Wheat, Cod, Chicken fillet, Soybean | JPN-CF-D1 | Australia | Meats, Corn, Barley |
| JPN-DF-D2 | Japan | Cereals, Meats, Beans, Fish, Vegetables | JPN-CF-D2 | Australia | Meats, Corn, Barley, Tuna |
| JPN-DF-D3 | Germany | Meats, Rice, Corn, Wheat, Plant protein, Beet, Egg | JPN-CF-D3 | USA | Chicken, Chicken meal, Plant protein, Fish meals |
| JPN-DF-D4 | Germany | Meats, Rice, Corn, Wheat, Plant protein, Beet, Egg | JPN-CF-D4 | Australia | Cereals, Meats, Plant protein, Seafood extracts |
| JPN-DF-D5 | USA | Fish, Fish meals, Chickpeas, Rice bran, Peas, Brown rice, Arabiki rice, Oatmeal, Potato | JPN-CF-D5 | Japan | Cereals, Meats, Plant protein, Seafood extracts, Fish meals |
| JPN-DF-D6 | USA | Chicken, Brown rice, Rice bran, Brown rice, Arabiki rice, Oatmeal, Plant protein, Beet | JPN-CF-D6 | Japan | Meats, Cereals, Vegetable, Seafood extracts, Fish meals |
| JPN-DF-D7 | Japan | Cereals, Corn, Meats, Beans, Vegetables, Fish | JPN-CF-D7 | Australia | Cereals, Meats, Fish meals |
| JPN-DF-D8 | Japan | Cereals, Meats, Fishmeal, Beans, Vegetables | JPN-CF-D8 | USA | Turkey, Rice, Plant protein, Poultry meats, Corn, Fish meals |
| JPN-DF-D9 | Japan | Cereals, Corn, Meats, Beans, Vegetables, Fish | JPN-CF-D9 | USA | Salmon, Rice, Plant protein, Chicken meal, Egg, Fish meals |
| JPN-DF-D10 | Japan | Cereals, Meats, Beans, Seafood, Vegetable | JPN-CF-D10 | Czech | Corn, Chicken, Plant protein, Fish oil, Wheat, Rice |
| JPN-DF-D11 | USA | Chicken, Meat meals, Rice, Plant protein, Wheat, Egg, Fish meal, Vegetable | JPN-CF-D11 | Czech | Chicken, Corn, Rice, Plant protein, Tuna, Fish oil |
| JPN-DF-D12 | USA | Turkey, Rice, Soybean, Chicken meal, Oatmeal, Wheat, Corn | JPN-CF-D12 | France | Chicken, Rice, Wheat, Corn, Plant protein, Fish oil |
| JPN-DF-D13 | USA | Salmon, Rice, Cereals, Plant protein, Fish meals | JPN-CF-D13 | France | Corn, Chicken, Plant protein, Fish oil, Wheat, Rice, Fish oil |
| JPN-DF-D14 | Czech | Chicken, Turkey, Corn, Wheat, Rice, Plant protein, Beet, Fish oil, Vegetables | JPN-CF-D14 | France | Corn, Chicken, Rice |
| JPN-DF-D15 | France | Rice, Meats, Corn, Beet, Fish oil | JPN-CF-D15 | Japan | Cereals, Meats, Fish meals, Vegetables |
| JPN-DF-D16 | Japan | Cereals, Meats, Fish meals, Soybean, Beet, Vegetables | JPN-CF-D16 | Japan | Cereals, Fish meals, Meats Vegetables |
| JPN-DF-D17 | Japan | Bran, Chicken meal, Starch, Soybean, Beet, Fish oil, Egg, Rice bran | JPN-CF-D17 | Japan | Cereals, Meats, Fish meals, Vegetables |
| JPN-DF-D18 | Japan | Cereals, Meats, Beans, Fish, Vegetables | JPN-CF-D18 | Japan | Cereals, Meats, Fish meals, Vegetables |
| JPN-DF-D19 | Japan | Cereals, Meats, Beans, Seafood, Vegetables | JPN-CF-D19 | Japan | Cereals, Meats, Fish meals, Vegetables |
| JPN-DF-D20 | Japan | Meats, Sugar, Beans, Starch, Cereals, Cheese, Vegetables, Potato | JPN-CF-D20 | Japan | Cereals, Meats, Fish meals, Vegetables |
| JPN-DF-D21 | Japan | Cereals, Meats, Beans, Seafood, Sugar, Egg | JPN-CF-D21 | Japan | Cereals, Meats, Fish meals, Vegetables |
| JPN-DF-D22 | Japan | Cereals, Seafood, Sugar | JPN-CF-D22 | Australia | Salmon, tuna, corn gluten meal, wheat, chicken, beet pulp, animal fats, wheat gluten, soybean meal, barley, fish oil, cellulose, protein hydrolysate, etc. |
| JPN-DF-D23 | England | Salmon, Potatoes, Peas, Salmon Oil, Ocean Fish Meal, Brewer’s Yeast, Vitamins & Minerals | JPN-CF-D23 | USA | Fresh salmon, salmon meal, chicken meal, refined white rice, pea protein, menhaden meal, cellulose, chicken fat (antioxidant-protected with vitamin E), chicken eggs, etc. |
| JPN-DF-D24 | USA | Fresh salmon, dried fish meat, sunflower, peas, sweet potato, pea flour, dried yeast, canola oil, sole, flax seed, tomato pulp, etc. | JPN-CF-D24 | England | Salmon Meal, Salmon, Sweet Potato, Cassava, Salmon Oil, Fish Extract, etc. |
| | | JPN-CF-D25 | Canada | Salmon (raw, deboned), cod (raw, deboned), salmon meal, herring meal (Atlantic herring meal), peas, lentils, chicken eggs (dried), etc. |
a) Sample ID and sample locations are shown in the database of the Environmental Specimen Bank (es-BANK) of Ehime University, Japan (
http://esbank-ehime.com/).
b) Main raw materials are listed in descending order of content.
Table 2 Sample information of wet food for dog and cat analyzed in this study
| Wet food for dog | Wet food for cat |
|---|
| Sample IDa) | Country of production | Main raw materialsb) | Sample ID | Country of production | Main raw materials** |
|---|
| JPN-DF-W1 | Australia | Meat (chicken, beef, etc.), Sunflower oil, | JPN-CF-W1 | USA | Turcky, Liver of Chicken, Pork extract, Fish oil |
| JPN-DF-W2 | Thailand | Fish (Skipjack tuna, Tuna), Wheat, Broun rice, Rice, Barley | JPN-CF-W2 | Thailand | Fish (Skipjack tuna etc.), Beef, Plant fat |
| JPN-DF-W3 | Australia | Meat (chicken, chicken), Vegetables (Carrot, Pumpkin), Wheat | JPN-CF-W3 | Thailand | Fish (Tuna, Skipjack tuna, The young of Sardine), Fish extract |
| JPN-DF-W4 | Australia | Meat (chicken, beef, etc.), vegetable protein, corn starch, wheat, dietary fiber, sunflower oil, garlic powder | JPN-CF-W4 | Thailand | Fish (Tuna, Fish extract), Chicken extract |
| JPN-DF-W5 | Thailand | Meat (Chicken, Beef), Vegetable (Carrot, Green beans, Potato) | JPN-CF-W5 | Thailand | Fish (Skipjack tuna, Tuna, Fish extract), Soy oil, Chicken oil, Chicken, Wheat gluten, Fish oil |
| JPN-DF-W6 | Japan | Meat (Chicken breast and fillet), Vegetable, soy sauce | JPN-CF-W6 | USA | Meats (Pork, Chicken, Cereals), Soy protein, Fish (Sardine) |
| JPN-DF-W7 | Japan | Meat (Chicken breast and fillet), Vegetable, soy sauce, Cheese | JPN-CF-W7 | USA | Meats (Pork, Chicken), Cereals, Soy protein |
| JPN-DF-W8 | USA | Chicken, Barley, Corn, Whey, liver, beet pulp | JPN-CF-W8 | Thailand | Fish (Skipjack tuna, Krab, Small fish, Fish extract) |
| JPN-DF-W9 | Thailand | Chicken fillet, Carrot, Potato, Salmon, Green peas | JPN-CF-W9 | Thailand | Fish (Skipjack tuna, Tuna), Soy oil |
| JPN-DF-W10 | Japan | Chicken fillet, beef, sweet potato, Carrot, potato starch | JPN-CF-W10 | USA | Pork, Chicken, Wheat gluten, Soy flour, Skipjack tuna |
| JPN-DF-W11 | China | Chicken fillet, sweet potato, Carrot, Green bean, Tomato paste, Honey | JPN-CF-W11 | Thailand | Tuna, Skipjack tuna, Whitebait, Fish extract |
| JPN-DF-W12 | Japan | Chicken breast, Chicken fillet, Carrot, Corn, Green peas | JPN-CF-W12 | Thailand | Tuna, Skipjack tuna, Beef, Fish extract |
| JPN-DF-W13 | Thailand | Sardine, Skipjack tuna, Tuna | JPN-CF-W13 | Thailand | Tuna, Plant fat, Soy protein, Chicken extract, Skipjack tuna extract |
| JPN-DF-W14 | Japan | Chicken fillet, pork, pork extract | JPN-CF-W14 | Thailand | Fish (Skipjack tuna, Tuna), Chicken breast, Soy protein, Chicken extract |
| JPN-DF-W15 | China | Chicken fillet, Vegetables (Carrot, Potato, Green beans), Chicken cartilage, Starch, Chicken extract | JPN-CF-W15 | Japan | Tuna, Chicken, Cheese, Tuna extract |
| JPN-DF-W16 | China | Chicken, Beef, Biotin, Chicken extract, Agar, Soybean oil | JPN-CF-W16 | Japan | Tuna, Rice, Vitamin E |
| JPN-DF-W17 | China | Chicken fillet, Vegetables (Carrot, Potato, Pumpkin, Green peas), Chicken fat, Chicken extract, Agar, Chicken powder | JPN-CF-W17 | Japan | Fish (Tuna, Fish peptide, The young of Sardine) |
| JPN-DF-W18 | USA | Beef, Rice, Animal fats and oil, pork, Carrot, Fish oil | JPN-CF-W18 | China | Skipjack tuna, Dried bonito, Starch, Agar |
| JPN-DF-W19 | USA | Chicken, Chicken extract, Chicken liver, Tomato, Salmon, Salmon | JPN-CF-W19 | China | Chicken, The young of Sardine, Starch, Scallop extract |
| JPN-DF-W20 | Thailand | Fish (Skipjack tuna, Tuna), Wheat, Broun rice, Rice, Barley | JPN-CF-W20 | China | Chicken, Beef, Starch, Scallop extract |
| JPN-DF-W21 | Thailand | Skipjack tuna, Tuna, Salmon, Carrot, Pumpkin | JPN-CF-W21 | Poland | Salmon, Chicken, Chicken soup, shrimp |
| JPN-DF-W22 | Thailand | Skipjack tuna, Tuna, Chicken, Carrot, Pumpkin | JPN-CF-W22 | USA | Salmon, Chicken, Chicken liver, Meat extract, Fish oil |
| | | JPN-CF-W23 | USA | Turckey, Broth of turckey, carrot, Rice, Salmon meal |
| | | JPN-CF-W24 | Thailand | Salmon, Rice, Vitamin A, Vitamin D |
| | | JPN-CF-W25 | Germany | Turckey, Potat, CaCO3, Canola oil |
| | | JPN-CF-W26 | Poland | Turckey, Turckey soup, Goose, Mineral, Sweet potato |
a) Sample ID and sample locations are shown in the database of the Environmental Specimen Bank (es-BANK) of Ehime University, Japan (
http://esbank-ehime.com/).
b) Main raw materials are listed in descending order of content.
Clean-up procedures for OHCs in pet foods (dry and wet foods) were slightly changed from the previous method (Mizukawa et al., 2016; Kunisue et al., 2021). The dry food (3 g) was homogenized and 3 M HCl (3 mL), 2-propanol (10 mL) and MTBE/hexane (20 mL, 1:1, v:v)were added. This mixture was stirred with a homogenizer, and the ultrasonic wave was extracted for three times. Lipid content was determined gravimetrically form an aliquot (2 mL) of the raw extract. Then, extract (5 mL) spiked with internal standards (F-PBDEs, 3,5-DiCl-6-MeO-BDE47, p,p'-DDT, β-HCH and 13C12-labeled PCBs and BDE-209) was cleaned with gel permeation chromatography (GPC) to remove lipids and concentrated using a rotary evaporator. In GPC, dichloromethane/hexane (1:1, v:v) was used as the elusion solvent, and 150 mL of solvent was collected after discarding 120 mL. This fraction was passed through a 4 g of activated silica gel column (Wako-gel DX) packed in a glass column with 110 mL of dichloromethane/hexane (5:95, v:v). After concentrated using a rotary evaporator, 13C12-labeled pentachloroanisole, 3-Cl-6-MeO-BDE-47, and 13C12-labeled CB-170 were added as syringe spikes (50 μL of isooctane).
The wet food (20 g) was homogenized, frozen, and dried in a freeze dryer for approximately 48 h. They were then subjected to the same washing process as the dry food described above.
INSTRUMENTAL ANALYSIS
OCPs were analyzed by GC (7890A series, Agilent, USA) coupled with MS/MS (7000 series, Agilent), and PCBs were analyzed by GC (7890A series, Agilent) coupled with MS (5975 series, Agilent). DB-1MS was used for the capillary column with 0.25 μm film thickness and 0.25 mm ID×30 m in length (J&W Scientific). Detailed conditions are described on Tue et al., 2010. Identification and quantification of PBDEs, MeO-PBDEs, and DBDPE were performed by GC-MS (QP-2010 ultra, SHIMADZU, Japan) with negative chemical ionization (NCI) mode. DB-5HT was used for the capillary column with 0.10 μm film thickness, 0.25 mm ID×30 m in length (J&W Scientific).
QA/QC
One procedural blank was analyzed in each batch to detect any possible contamination from solvents and glassware. No substantial interference peaks were observed on the chromatograms obtained from the GC-MS/MS and GC-MS analyses. Target compounds were identified and quantified from corresponding internal standards using the isotope dilution method reported in previous studies (Shimasaki et al., 2022). 13C-labeled internal standards ranged from 52% to 134% and precision (CV<15%). The method of detection limits (MDLs) was calculated according to the guidelines in Japan. (Ministry of the Environment, 2016). The MDLs for target compounds were calculated and the values were as follows: HCB (7.8 pg/g), HCH (22 pg/g), CHLs (56–140 pg/g), DDT (23 pg/g), PCBs (5.9–28 pg/g), PBDEs (1.9–190 pg/g), BTBPE (23 pg/g), PBEB (42 pg/g), DBDPE (66 pg/g), and MeO-PBDEs (11 pg/g).
ESTIMATION OF DRY FOOD CONTAMINATION FROM RAW MATERIALS
To assess the contribution of raw materials in dry pet food and explore other potential contamination pathways, such as those that may occur during the manufacturing process, concentrations of OHCs in dry pet food were estimated based on the substances mixed as raw materials. For this estimation, it was assumed that the contaminations present in the feed raw materials would be similar to those in the final food product, to gather as much relevant information as possible. To begin, the dry food for cats and dogs was categorized into three groups: fish, meat, and cereals, based on the primary raw material listed on the package labels. Patent articles were then consulted for each classified dry food to investigate the mixing ratio of the raw materials (Fig. S1). Simultaneously, median, maximum, and minimum concentrations of OHCs reported in recent papers for specific food types (e.g., salmon, chicken, cereal, fish meal, potatoes, eggs, animal fats, vegetable oils, and fish oils) were reviewed (Table S5–S10).
Using this gathered information, the concentration of OHCs in the mixture of raw materials was estimated using the following equation tailored for this purpose. The estimation considers the identified mixing ratios of the raw materials and the reported OHC concentrations associated with each food type.
|
C
ingredient
=
C
salmon
×
a[%]
100
+
C
chicken
×
b[%]
100
+
C
cereal
×
c[%]
100
+⋅⋅⋅
|
In the context of the equations and considerations mentioned earlier, the symbol “C” represents the concentrations of OHCs in each specific type of food, and the variables “a,” “b,” and “c” signify the respective mixing ratios of raw materials associated with salmon, chicken, cereals, and other ingredients found in dry pet food.
During the manufacturing process of dry pet food, the mixture of raw materials is subjected to drying at temperatures ranging from 80 to 120°C (Ministry of Agriculture, Forestry and Fisheries, 2014; US2018/0042269). It is important to note that the water content in the raw material mixtures varies, as reported in patents, typically falling between 37% and 55% (US20180042270 A1, US20180242616 A1). Meanwhile, the water content in the final product was found to be around 6.5%–12% in dry cat food and 10%–36% in dry dog food, as indicated on the package labels. With these considerations in mind, an assumption was made that the concentration of OHCs in the estimated raw material mixtures should be concentrated by a factor of approximately 133%–194% for dry cat food and 101%–182% for dry dog food. This considers the reduction in water content during the manufacturing process, resulting in a higher concentration of OHCs in the final product.
RISK ANALYSIS
The daily intake (DI) of OHCs for pet cats is computed using the measured concentrations of these compounds in pet food, according to the formula:
|
Daily Intake [ng/kg bw/day]
=
Intake of dry food [g/day]×Concentration of dry food [ng/g]
Body weight [kg]
|
where the daily ingestion of dry food is determined from the recommended feed amounts indicated on the package labels.
Hazard quotients (HQs) were calculated for compounds that defined risk threshold (Tolerable daily intake; TDI, or Reference dose; RfD) using following formula:
|
HQ=
Daily Intake [ng/kg bw/day]
TDI or RfD [ng/kg bw/day]
|
TDI of PCBs and dl PCBs were 20 ng/kg/day (WHO, 2003) and 2 pg-TEQ/kg/week (EFSA Panel on Contaminants in the Food Chain (CONTAM)), respectively. Toxic equivalency factors (TEFs) for dl PCBs were used the value established by the World Health Organization (WHO) in 2005 (Van den Berg et al., 2006). TDI of DDTs (including DDT and their metabolite) and CHLs were 10,000 (JECFA, 2000) and 500 ng/kg bw/day, respectively (JECFA, 1995). RfD of BDE-47, -99, -153, -and 209 were 100, 100, 200, and 7,000 ng/kg bw/day, respectively (Integrated Risk Information System (IRIS) Assessment, USEPA) (Table S11).
STATISTICAL ANALYSIS
For statistical analyses, calculations involving MDLs were treated as half of the MDLs concentrations. The nonparametric Steel–Dwass test followed by Bonferroni adjustment was performed to compare the differences between the groups. A p-value below 0.05 was considered indicative of statistical significance. Spearman’s rank correlation coefficients were computed to examine the relationships between different components and their concentrations, specifically focusing on those components with a detection frequency above 50%. Values that fell outside the range defined by the interval between Q1-3 (Q3-Q1) and Q3+3 (Q3-Q1) were identified as outliers. Here, Q1 and Q3 represent the first quartile (25th percentile) and the third quartile (75th percentile) respectively. However, considering the limited number of samples among each group and the fact that each country has its own sample characteristics, these outliers were not excluded from the statistical analysis.
All these statistical analyses were performed using the R programming language, version 3.4.2 (http://www.r-project.org/). The rigorous statistical examination helps to determine significant trends, relationships, and outliers in the dataset, ensuring the reliability and validity of the study’s findings.
RESULTS AND DISCUSSIONS
RESIDUE LEVELS OF OHCS IN DOG AND CAT FOODS
OHCs were detected in both dry and wet types of pet foods (Fig. 1), though there was notable variation in their concentrations across different samples. The details of the concentrations of OHCs are presented in Table S14–S25 (Supplementary materials). When considering the median concentrations (on a wet weight basis: ww), the order was as follows: ΣDDTs (<MDL −37,000 pg/g)>ΣHCHs (<MDL −23,000 pg/g)>ΣPCBs (<MDL −12,000 pg/g)>ΣMeO-PBDEs (<MDL −7,600 pg/g)>HCBz (<MDL −3,300 pg/g)>ΣPBDEs (<MDL −1,600 pg/g)>DBDPE (<MDL −7,000 pg/g) (Table 3). The median concentrations of ΣCHLs (<MDL −7,300 pg/g), PBEB (<MDL −61 pg/g), and BTBPE (<MDL −120 pg/g) were found to be below the detection limit. Comparing OHC concentrations among different types of pet food, significant differences were observed, except for wet food. The highest concentrations were recorded in dog dry food, followed by cat dry food, and then dog and cat wet food (Fig. 1). These results illustrate the widespread presence of OHCs in various types of pet foods and underscore the variation in their concentrations among different samples. The order of concentration levels provides insight into the relative abundance of different OHCs in the pet food samples, with DDTs and PCBs generally exhibiting higher median concentrations compared to other contaminants (Fig. 1). Additionally, the distinctions in OHC levels across different pet food types suggest potential differences in the sources of contamination and the ingredients used in their production. These will be discussed later.
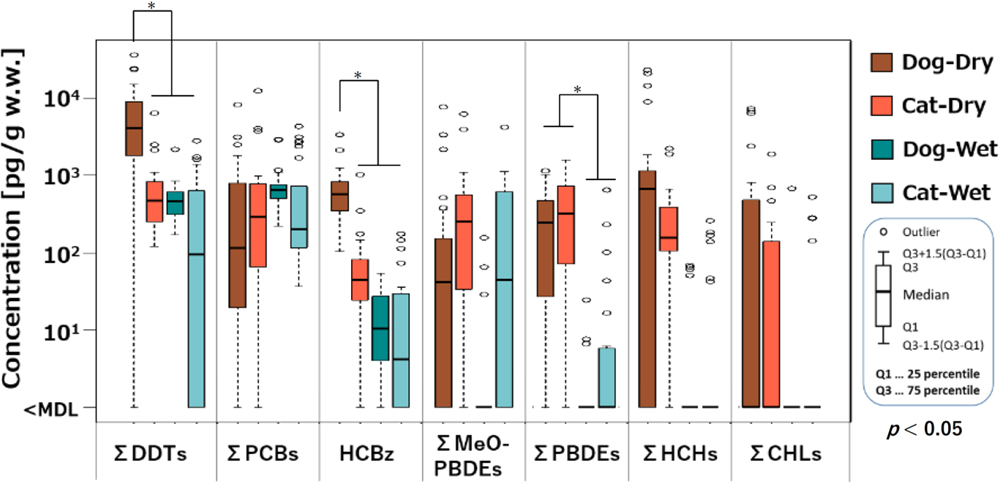
Fig. 1 Concentrations of OHCs in dry food for dog, dry food for cat, wet food for dog, and wet food for cat. 127×66 mm (300×300 DPI)
Table 3 Summary of OHCs concentrations in dry and wet pet food sold in Japan
| Dog‑dry food | | Mean | SD | Median | min | Max | DF (%)a) | Cat‑dry food | Mean | SD | Median | min | Max | DF (%)* |
|---|
| ΣPCBs | 820 | 1,800 | 200 | <MDL | 8,100 | 79 | | 1,100 | 2,500 | 300 | <MDL | 12,000 | 92 |
| HCBz | 760 | 700 | 590 | 110 | 3,300 | 100 | | 110 | 200 | 48 | <MDL | 1,000 | 96 |
| ΣHCHs | 3,300 | 6,600 | 810 | <MDL | 23,000 | 64 | | 360 | 540 | 160 | <MDL | 2,200 | 90 |
| ΣCHLs | 1,000 | 2,300 | <MDL | <MDL | 7,300 | 29 | | 170 | 400 | <MDL | <MDL | 1,900 | 44 |
| ΣDDTs | 7,700 | 9,100 | 4,300 | <MDL | 37,000 | 92 | | 890 | 1,300 | 530 | 120 | 6,300 | 100 |
| ΣPBDEs | 290 | 320 | 240 | <MDL | 1,100 | 83 | | 490 | 460 | 320 | <MDL | 1,600 | 96 |
| PBEB | 4.8 | 16 | <MDL | <MDL | 61 | 8.3 | | <MDL | 1.4 | <MDL | <MDL | 6.2 | 12 |
| BTBPE | 10 | 22 | <MDL | <MDL | 89 | 21 | | 15 | 28 | <MDL | <MDL | 120 | 32 |
| DBDPE | 470 | 1,600 | <MDL | <MDL | 7,000 | 8.3 | | 220 | 810 | 89 | <MDL | 4,100 | 44 |
| ΣMeO-PBDEs | 610 | 1,700 | 29 | <MDL | 7,600 | 54 | | 800 | 1,600 | 260 | <MDL | 6,300 | 80 |
| Dog‑wet food | | | | | | | | Cat‑wet food | | | | | | |
| ΣPCBs | 810 | 700 | 640 | 220 | 2,900 | 100 | | 850 | 1,200 | 200 | 37 | 4,400 | 100 |
| HCBz | 16 | 17 | 10 | <MDL | 55 | 74 | | 26 | 49 | 4.3 | <MDL | 180 | 54 |
| ΣHCHs | 11 | 24 | <MDL | <MDL | 70 | 17 | | 33 | 72 | <MDL | <MDL | 260 | 23 |
| ΣCHLs | 30 | 140 | <MDL | <MDL | 680 | 4.3 | | 53 | 130 | <MDL | <MDL | 530 | 19 |
| ΣDDTs | 530 | 410 | 440 | 170 | 2,200 | 100 | | 450 | 700 | 95 | <MDL | 2,800 | 65 |
| ΣPBDEs | 2.3 | 6.7 | <MDL | <MDL | 31 | 17 | | 42 | 132 | <MDL | <MDL | 640 | 35 |
| PBEB | 4.8 | <MDL | 4.8 | 4.8 | 4.8 | 4.3 | | 4.3 | 6.5 | 1.2 | 1.0 | 14 | 15 |
| BTBPE | <MDL | <MDL | <MDL | <MDL | <MDL | 0 | | <MDL | <MDL | <MDL | <MDL | <MDL | 0 |
| DBDPE | <MDL | <MDL | <MDL | <MDL | <MDL | 0 | | <MDL | <MDL | <MDL | <MDL | <MDL | 0 |
| ΣMeO-PBDEs | 38 | 130 | <MDL | <MDL | 610 | 17 | | 420 | 860 | 45 | <MDL | 4,200 | 65 |
<MDL: Below Method detection limit
a) DF: Detection Frequency
The concentrations of PCBs, DDT, CHL, and HCBz in dry pet food measured in this study are consistent with contamination levels reported in previous research (Kunisue et al., 2005; Mizukawa et al., 2016). These findings suggest that contamination levels have not shown improvement over time, despite the prohibition of OHCs under the Stockholm Convention. This underscores the ongoing presence of these compounds in the environment and their persistence in pet food.
Regarding PBDE concentrations in dry cat food (Table S23), they align with levels found in pet foods from Sweden (Norrgran et al., 2017) and Thailand (Shimasaki et al., 2022), and are notably 2−20 times lower than PBDE concentrations in dry food in the references of USA (Dye et al., 2007). Additionally, the median DBDPE concentration in dry cat food (89 pg/g ww; Table 3) in this study was found to be 5-fold lower than that in Swedish dry cat food (Norrgran et al., 2017). These variations in BFRs concentrations among different countries can be attributed to factors such as historical usage patterns. Notably, larger quantities of PBDEs were used in North America (Ward et al., 2008), and regulatory decisions, such as the earlier regulation of deca-BDE and its replacement with DBDPE in Europe (European Court of Justice, 2008), contribute to differences in BFR levels.
It is important to mention that the maximum allowable levels of DDTs and HCHs in pet foods distributed in Japan are defined by the Pet Food Safety Act (Ministry of Agriculture and Environment, 2018). Specifically, this regulation sets the limit at 100 ng/g for DDTs (including decomposition products of p,p'-DDT) and 10 ng/g for HCHs (α-, β-, ɤ-, Δ-HCH) for dry food. In this study, the maximum concentrations of DDTs and HCHs in the dog dry pet food were found to be 37 and 21 ng/g ww, respectively (Table S18 and S19), and while DDT was below the maximum acceptable level, HCHs in some foreign pet foods were above the maximum acceptable level.
In the case of cat wet food (Table S25), the concentrations of PBDEs and MeO-PBDEs were notably 1−2 orders of magnitude lower than those reported in a previous study conducted by Mizukawa et al., 2016. This decline in PBDE levels is likely indicative of the impact of recent regulations pertaining to the production, use, and distribution of PBDEs. It suggests that regulatory measures have had a positive effect in reducing the presence of these compounds in cat wet food. In addition, it is important to note that the previous study primarily analyzed cat wet foods made primarily from fish, while the current study analyzed pet foods composed of a broader range of raw materials, including both meat and seafood. These variations in the composition of raw materials used in the pet foods could explain the observed lower PBDEs concentrations. MeO-PBDEs are typically more prevalent in marine-derived products, which implies that the differences in concentration levels could be attributed to the varying raw materials used in the different studies. These will be discussed later.
OHCS PROFILES IN DOG AND CAT FOODS
Significant differences in OHC composition were observed between dry and wet pet foods. However, the composition of OHCs was not found to be significantly different between dry cat and dog food. The profiles of PCB congeners are illustrated in Fig. S2. Among these, hexa-chlorinated PCBs were the predominant congeners in dry foods, while both hexa-chlorinated and penta-chlorinated PCBs dominated in wet foods, constituting approximately 50–60% of the profile. Specifically, CB-153, -138, -180, -118, and -149 were the primary congeners detected in dry food (Table S14–S15). The prevalence of these congeners in dry food may be attributed to factors such as their stability and resistance to degradation processes. Lower-chlorinated PCBs are relatively more volatile and may have undergone volatilization due to the heating involved in the processing of dry pet food. This volatilization phenomenon could potentially contribute to a higher proportion of higher-chlorinated PCB congeners in the dry food products (Saktrakulkla et al., 2020).
In this study, DDT was detected in 91% of the pet food samples analyzed, with p,p'-DDE emerging as the primary component (Table S18–S21). The ratios of p,p'-DDT to the total DDTs (ΣDDTs) were generally quite low, not exceeding 0.12 for many pet foods (Fig. S3). The lower ratio in these cases likely indicates residual contamination from historical use of DDT formulations. The detection frequency of HCHs was 90% in cat dry food and 64% in dog dry food (Table 3). This suggests that dry pet food was widely contaminated with HCHs, mirroring the contamination pattern observed for DDTs. Among the HCH isomers, β-HCH was the dominant component, found in 95% of dry cat food samples and 59% of dry dog food samples (Table S18 and S19).
The congener profiles of PBDEs are depicted in Fig. S4. In dry pet food, the predominant congener was BDE-209, constituting 60% of the profile. In contrast, tetra- and penta-BDEs made up around 90% of the profile in wet pet food. It’s noteworthy that higher contributions of BDE-47 were found in dry cat food produced in Australia, and BDE-99 was more prominent in some dog foods manufactured in the USA compared to other countries (Table S22 and S23). This might be indicative of country-specific contamination patterns. The composition of PBDEs in pet foods is influenced by various factors. In dry foods, characteristic raw materials such as fishmeal, grains, and eggs are employed (Fig. S1), which often contain a high proportion of BDE-209 (ranging from 50% to 84%) (Li et al., 2018; Zacs et al., 2021). Consequently, the composition of PBDEs in dry foods could reflect the contamination levels present in these raw materials. On the other hand, deca-BDE was not detected in wet food samples (Table S24 and S25). This discrepancy aligns with the contamination profile of the primary raw material, seafood (Bendig et al., 2013). Moreover, differences in the manufacturing process could also contribute to variations in PBDE composition. The production of dry food typically involves more manufacturing steps and greater contact with machinery compared with wet food processing. Consequently, the manufacturing process for dry food could potentially introduce PBDE contamination. In addition, relatively high levels of BTBPE and DBDPE have been detected in dry cat food from the EU and USA (Table 3). Consequently, the contamination of BTBPE and DBDPE in cat dry foods could reflect the contamination levels present in these raw materials.
The analysis revealed significant positive correlations between the concentrations of OCPs such as DDTs, CHLs, and HCBz, and PCBs across both dry cat and dog foods (Tables S12–13). This implies that these contaminants likely share similar sources of origin. However, it is worth noting that HCHs did not exhibit correlations with other OCPs or PCBs. This result suggests that HCHs might have distinct sources or pathways of contamination compared with other contaminants. Interestingly, there were no correlations observed between the concentrations of BDE-209 or DBDPE and the other OHCs in both dry cat and dog food samples. This lack of correlation points to potential differences in the contributions of these compounds from various raw materials or the possibility of additional sources of contamination beyond what was considered in this study.
CHARACTERISTICS OF PET FOOD CONTAMINATION BY PRODUCED COUNTRY
The concentrations of OHCs categorized by the country of production are illustrated in Fig. 2 and 3, revealing higher levels of ΣDDTs, ΣPCBs, and ΣPBDEs in dry pet food samples originating from the USA. This disparity in contamination levels in US pet foods could be attributed to the historical production and usage of persistent organic pollutants (POPs) in the past, as previous research indicates (Ward et al., 2008). In addition, concentrations of DDT and PCBs have been found in Japanese wet food at levels comparable to those found in the wet food from USA. The EU also tends to have high levels of DDTs, PCBs, and HCHs in pet food. It is estimated that these also reflect the past use of POPs as a developed country. This is supported by the relatively low levels of these POPs in Thailand pet foods.

Fig. 2 Difference of OHCs concentration in dry pet foods by produced country. 127×81 mm (300×300 DPI)

Fig. 3 Difference of OHCs concentration in wet pet foods by produced country. 127×84 mm (300×300 DPI)
Interestingly, wet dog food and dry cat food from Australia consistently exhibited higher levels of ΣHCHs compared to other countries. The common factor among these Australian pet foods is the presence of meat as a raw material (Table 1 and 2). This suggests that the elevated levels of contaminants are likely originating from the raw materials used in these products. Moreover, wet cat foods produced in Thailand displayed higher concentrations of ΣMeO-PBDEs (Fig. 3). This trend is likely associated with the use of fish as a primary raw material. MeO-PBDEs have been linked to natural production by marine algae or cyanobacteria (Teuten et al., 2005). The transformation of MeO-PBDEs through demethylation by cytochrome P450 (CYP) can lead to the formation of OH-PBDEs, differing from the conventional metabolism of parent PBDEs in some species. Previous research involving cat liver microsomes has demonstrated the production of 6-OH-BDE-47 and 2'-OH-BDE-68 through the demethylation of 6-MeO-BDE-47 and 2'-MeO-BDE-68, respectively (Mizukawa et al., 2016, 2017).
These findings underscore the importance of considering both anthropogenic and naturally produced OHCs in assessing the potential health effects on pet cats. Compounds such as 6-OH-BDE-47, which structurally resemble thyroid hormones (T4) and can disrupt thyroid hormone homeostasis, oxidative phosphorylation, and induce neurotoxicity, warrant particular attention due to their potential adverse impacts on pets’ well-being (Hamers et al., 2008; van Boxtel et al., 2008; Ucán-Marin et al., 2009; Hendriks et al., 2010).
CHARACTERISTICS OF OHCS CONTAMINATIONS BY PET FOOD RAW MATERIALS
Fig. 4 and 5 provide a comprehensive depiction of OHC concentrations based on different raw materials. In dry fish-based pet food, the concentrations of ΣDDTs, ΣPCBs, HCBz, ΣMeO-PBDEs, and ΣCHLs were notably elevated (Fig. 4). Specifically, HCBz displayed significantly higher levels in dog food, ΣHCHs were more concentrated in meat-based pet food, and ΣCHLs exhibited greater prevalence in dried fish-based pet food. It’s worth noting that the OHC profiles of pet food based on salmon raw material differed from other types of pet food (Easton et al., 2002). Salmon has been recognized for its higher PCB concentration in human foods, with canned tuna following suit (Ferrante et al., 2020). During the salmon spawning season, fat accumulation occurs, leading to higher concentrations of persistent organic pollutants such as PCBs (Lukyanova et al., 2016). Additionally, farmed salmon can contain elevated levels of OHCs in their feed, potentially leading to contamination (Easton et al., 2002). Consequently, pet food primarily composed of salmon as a raw material tends to exhibit high levels of POPs.

Fig. 4 Difference of OHCs concentration in dry pet foods by raw materials. 127×81 mm (300×300 DPI)

Fig. 5 Difference of OHCs concentration in wet pet foods by raw materials. 127×88 mm (300×300 DPI)
Moreover, the study further investigated wet food products primarily composed of fish, differentiating them into categories based on the main fish source, such as “fish,” “tuna,” and “salmon” (Fig. 5). Additionally, wet pet foods with meat as their main raw material were categorized into “meat,” “chicken,” and “turkey.” The findings revealed that wet food products containing salmon as the primary raw material exhibited notably elevated concentrations of ΣDDTs, ΣPCBs, HCBz, and ΣCHLs. Furthermore, turkey meat-based pet food originating from the United States displayed high levels of ΣPBDEs. These outcomes likely mirror historical trends in the production and usage of POPs in the respective producing countries. Salmon-based wet foods and turkey-based pet foods from the United States should be approached with caution due to the higher levels of these contaminants. This information highlights the significance of considering the composition and origin of raw materials in assessing potential exposure to OHCs in pet food.
ESTIMATION OF RAW MATERIALS CONTRIBUTING TO OHCS CONTAMINATIONS IN DRY FOODS
Dry pet food constitutes a complex mixture, encompassing cereals, vegetables, fish oil, and animal-based raw materials such as fish and meat. This intricate composition presents the potential for a range of OHC contaminations. To assess the role of raw materials in dry pet food and to explore other potential contamination pathways, such as manufacturing processes, the concentrations of OHCs were estimated based on the combined raw materials. Through this estimation process, a comparison was made between the calculated concentrations and the measured concentrations of OHCs in dry pet food. The results were depicted in Fig. 6. Despite certain limitations in estimating dry food contamination due to factors such as information availability, the order of median concentrations based on different raw materials remained consistent between the estimated and measured samples. Additionally, concentrations of PCBs, DDTs, and CHLs in fish-based dry food, as well as HCHs in meat-based dry food, were estimated to be higher compared to these concentrations in different food groups. This finding suggests a potential contribution of these OHCs from seafood sources. Consequently, the estimation method employed here holds promise as a valuable tool for comparing OHC concentrations across various raw materials. However, the detection rate and concentration of other BFRs, excluding BDE-209, in pet food were low, making it difficult to compare measured and estimated concentrations.

Fig. 6 Comparison of Calculated and Measured Concentrations of OHCs in Dry Pet Food Based on raw materials combinations. 127×118 mm (300×300 DPI)
The process of estimation revealed that the calculated concentrations of PCBs and OCPs were notably higher than their measured concentrations (Fig. 6). This discrepancy could arise from the fact that reports on food contamination with PCBs and OCPs were often confined to specific time periods and geographic regions. These limitations contributed to the disparity between the contamination levels in the raw materials of analyzed and estimated dry food. However, the abundance of recent data regarding the contamination of food with BDE-209 allowed for more accurate estimation, resulting in alignment between the calculated and measured concentrations.
An interesting observation emerged from the analysis, particularly regarding BDE-209 in JPN-CF-D7 (Table 1 and Table S2) and DBDPE in certain cereal-based dry foods (Fig. 6). Measured concentrations of BDE-209 exhibited extraordinarily high levels, significantly surpassing the estimated concentrations. On the other hand, the contamination level of DBDPE was much lower than the estimated value. When compared with the measured concentrations, only a fraction—7.0% of BDE-209 and 1.6% of DBDPE—could be accounted for based on the raw material content. This discrepancy of BDE-209 strongly suggests the presence of contamination in the manufacturing process. On the other hand, this discrepancy in DBDPE could arise from the fact that reports on food contamination with DBDPE were relatively scarce. Previous study has also highlighted the potential for BFRs contamination in both human and pet processed foods during the manufacturing phase (Venier and Hites, 2011; Poma et al., 2018). Although this study provides insights into the contamination, the exact route of this manufacturing-related contamination remains uncertain. Future investigations could shed light on this aspect. If similar analyses involving chemical assessments of concentrations in real raw materials and end products are conducted, it could prove valuable for implementing quality control measures in the manufacturing process.
The estimation of PCB contamination from different raw materials yielded intriguing findings (Fig. S5a). In fish-based dry food, the median concentrations of PCBs were relatively elevated, with salmon making a particularly substantial contribution, accounting for over 95%. This aligns with a study by Hites et al. (2004)that explored PCB contamination in wild and farmed salmon from various regions. The research revealed that farmed salmon, due to their feed composed of fish oil and fish meal tainted with PCBs, exhibited greater PCB accumulation compared to their wild counterparts. Notably, PCB contamination levels were more pronounced in European farmed salmon compared to those in the United States and Canada. This study suggests that dry pet foods containing European salmon as a key ingredient could potentially have very high PCB levels. Moreover, it’s important to acknowledge that in worst-case scenarios, contamination can be significant not only from European salmon but also from fish oil and chicken-based dry foods (Fig. S6a).
Moving forward, the estimation of OCPs and BFRs concentrations in dry food from various raw materials offered additional insights. Animal-based foods such as chicken and salmon played a substantial role in contamination (Fig. S5 and S6 b–f). Particularly for HCHs and BDE209, meat was more influential than fish in terms of dry food contamination, even though animal fats constitute only a small percentage—between 4.1% and 9.2% on a wet weight basis—in the mixture of raw materials. This underscores the non-negligible contribution of animal fats to OCPs and BFRs contamination in dry pet food.
This approach provides insights into the potential pathways and sources of OHC contamination in pet food, contributing to our understanding of the complex dynamics at play in the composition and potential risks associated with different types of pet food.
DAILY INTAKES and HAZARD QUOTIENTS OF OHCS
The calculation of daily OHCs intake was derived from pet food consumption (Table 4). Notably, the daily intakes of ΣDDTs, ΣPCBs, and HCBz from wet food were several times higher than those from dry food. This discrepancy is primarily attributed to the difference in the amount of food consumed in each case. For instance, a 4-kg dog would consume 520 g of wet food compared with 100 g of dry food. Despite generally lower OHC concentrations in wet foods compared to dry foods, the daily intake of OHCs was greater in wet foods due to their substantially larger feeding volumes.
Table 4 Estimated Daily intake of OHCs in dogs and cats
| Dry food for dog
(light weight)a) | Dry food for dog
(heavy weight)b) | Dry food for cat* |
|---|
| ng/kg/day | Med. | Max | Min. | Med. | Max | Min. | Med. | Max | Min. |
|---|
| DDTs | 10 | 110 | 0.0 | 7.0 | 77 | 0.0 | 9.3 | 110 | 2.1 |
| PCBs | 2.4 | 200 | 0.0 | 1.7 | 140 | 0.0 | 5.4 | 210 | 0.0 |
| HCBz | 1.4 | 6.9 | 0.4 | 1.0 | 4.8 | 0.2 | 0.8 | 18 | 0.0 |
| MeO-PBDEs | 0.7 | 190 | 0.0 | 0.5 | 130 | 0.0 | 4.4 | 110 | 0.0 |
| PBDEs | 5.9 | 29 | 0.0 | 4.1 | 20 | 0.0 | 5.6 | 28 | 0.0 |
| HCHs | 2.0 | 49 | 0.0 | 1.4 | 34 | 0.0 | 2.8 | 39 | 0.0 |
| CHLs | 0.0 | 21 | 0.0 | 0.0 | 15 | 0.0 | 0.0 | 33 | 0.0 |
| Total OCPs | 19 | 140 | 0.5 | 13 | 96 | 0.4 | 18 | 170 | 5.8 |
| g-HCH | 0.0 | 0.0 | 0.0 | 0.0 | 0.0 | 0.0 | 0.0 | 6.1 | 0.0 |
| Wet food for dog
(light weight)* | Wet food for dog
(heavy weight)* | Wet food for cat* |
|---|
| ng/kg/day | Med. | Max | Min. | Med. | Max | Min. | Med. | Max | Min. |
|---|
| DDTs | 58 | 260 | 22 | 37 | 180 | 14 | 7.5 | 480 | 0.0 |
| PCBs | 76 | 340 | 28 | 53 | 240 | 18 | 20 | 460 | 4.0 |
| HCBz | 1.3 | 6.4 | 0.0 | 0.9 | 4.6 | 0.0 | 0.3 | 30 | 0.0 |
| MeO-PBDEs | 0.0 | 78 | 0.0 | 0.0 | 51 | 0.0 | 5.7 | 250 | 0.0 |
| PBDEs | 0.0 | 2.9 | 0.0 | 0.0 | 2.0 | 0.0 | 0.0 | 36 | 0.0 |
| HCHs | 0.0 | 11 | 0.0 | 0.0 | 51 | 0.0 | 0.0 | 12 | 0.0 |
| CHLs | 0.0 | 79 | 0.0 | 0.0 | 56 | 0.0 | 0.0 | 90 | 0.0 |
| Total OCPs | 58 | 340 | 22 | 40 | 240 | 14 | 7.5 | 600 | 0.0 |
| g-HCH | 0.0 | 0.0 | 0.0 | 0.0 | 0.0 | 0.0 | 0.0 | 0.0 | 0.0 |
a) This table provides the estimated daily intake of various OHCs in dogs and cats, considering different body weights. The “Light weight” category represents a weight of 4 kg for dogs, while the
b) “Heavy weight” category represents a weight of 14 kg. Cats are considered at a weight of 4 kg. The estimated daily intake values for each OHC are presented in nanograms per kilogram of body weight per day for both dry and wet food categories.
The HQs were calculated and are depicted in Fig. 7 for dry and wet foods, respectively. BDE-47, BDE-99, BDE-153, BDE-209, CHLs, and DDTs all yielded HQs below 1. However, 48 samples had PCB HQs exceeding 1. Further analysis revealed that 6 dry dog foods and 4 dry cat foods, along with 25 wet dog foods and 13 wet cat foods, had PCBs HQs exceeding 1. Therefore, the association between PCBs HQ levels and raw materials was also explored. Among dry dog foods, those with salmon as the main raw material consistently yielded HQs exceeding 1, whereas those with meat as the primary component-maintained HQs below 1. In the context of dry cat food, samples with salmon as the predominant ingredient exceeded HQs of 1, while others remained below this threshold. Moving to wet dog food, all samples exhibited HQs above 1, with those containing meat as the main raw material registering the highest levels. Similarly, in wet cat food, products made from salmon exceeded an HQ of 1, and approximately 70% of those produced from turkey and meat also surpassed this threshold. These observations underscore the importance of considering potential PCBs exposure associated with the consumption of salmon or turkey-based pet foods, warranting caution in these instances.

Fig. 7 HQ in dry and wet food by raw materials. The order is 4 kg for dogs, 14 kg for dogs, and 4 kg for cats. The “Light weight” category represents a weight of 4 kg for dogs, while the “Heavy weight” category represents a weight of 14 kg for dogs. Cats are considered at a weight of 4 kg. 127×55 mm (300×300 DPI)
Caution should also be exercised with exposure at a young age when body weight is light. Based on the recommended intake for each body weight of cats listed on the product labels of these pet foods, HQs of PCBs were calculated for cats weighing between 1 and 6 kg (Fig. S7). Special attention should be paid to young cats with light body weight, as the lower the body weight, the higher the percentage of HQs exceeding 1.
However, these results have some points to consider. The threshold values for PCBs employed in the present study were determined by orally administering AROCLOR 1254 to rhesus monkeys with immunotoxicity as the endpoint. This value was determined because rhesus monkeys are particularly susceptible to PCBs and immunotoxicity manifests at comparatively low doses than other toxicities. On the other hand, when male rats were orally exposed to PCBs for 4 days and the HQ was recalculated using a study with hepatotoxicity as an endpoint, a NOAEL of 0.5 mg/kg/day (ATSDR) was adopted (data not shown). As a result, PCBs HQ did not exceed 1 in any pet food, and no health effects were observed. The sensitivity of dogs and cats to environmental contaminants, such as PCBs, is currently unknown. Large species differences in sensitivity suggest that pet animals may be particularly vulnerable to these contaminants. Further studies should be conducted to assess the response of dogs and cats to targeted environmental contaminants.
CONCLUSION
In this study, contaminants such as PCBs, DDTs, and PBDEs were detected in both dry and wet pet foods, emphasizing the pervasive nature of OHC exposure in pet foods. In addition, the study highlighted the importance of considering the raw materials used in pet food production. Estimations were made to assess OHC concentrations based on food ingredients, revealing the potential for contamination beyond ingredient-related sources. The manufacturing process emerged as another potential route of contamination, especially for certain compounds such as BDE-209 and DBDPE.
Risk assessments indicated that the levels of PBDEs, CHLs, and DDTs in pet food generally posed low risks. However, attention was drawn to the elevated HQs associated with PCBs, particularly in pet foods containing salmon as a primary ingredient. These results underscore the need for cautious selection of pet foods, with a focus on avoiding products from certain countries and those featuring specific ingredients.
In conclusion, this study highlights the persistent presence of OHCs in pet food and their potential impact on companion animals’ health. Continued vigilance, monitoring, and regulatory efforts are crucial to ensuring the safety and well-being of pets and guiding responsible pet food manufacturing and consumption practices.
CONFLICT OF INTEREST
The authors declare that they have no known competing financial interests or personal relationships that could have appeared to influence the work reported in this paper.
ACKNOWLEDGEMENTS
This work was supported by the Ministry of Education, Culture, Sports, Science, and Technology, Japan (MEXT) as part of a project on Joint Usage/Research Center-Leading Academia in Marine and Environment Pollution Research (LaMer) (No. 29-01), Ehime University and by Grants-in-Aid (KAKENHI) for Young Scientists (No. 20K19975), Scientific Research (S) (No. 26220103), and Scientific Research (B) (No. 16H02989) from the Japan Society for the Promotion of Science.
SUPPLEMENTARY MATERIAL
Table S1, Detailed sample information of dry food for dog analyzed in this study; Table S2, Detailed sample information of dry food for cat analyzed in this study; Table S3, Detailed sample information of wet food for dog analyzed in this study; Table S4, Detailed sample information of wet food for cat analyzed in this study; Table S5, Summary of literature on the concentrations of PCBs in food; Table S6, Summary of literature on the concentrations of DDTs in food; Table S7, Summary of literature on the concentrations of HCHs in food; Table S8, Summary of literature on the concentrations of HCBz in food; Table S9, Summary of literature on the concentrations of BDE-209 in food; Table S10, Summary of literature on the concentrations of DBDPE in food; Table S11, Tolerable daily intake (TDI) of OHCs (DDTs, CHLs, PCBs, and PBDEs) and Endpoints Used; Table S12, Spearman’s rank correlation coefficients between the concentrations of OHCs [lipid wt.] in dry cat food; Table S13, Spearman’s rank correlation coefficients between the concentrations of OHCs [lipid wt.] in dry dog food; Fig. S1, Mixing ratio of ingredients in manufacturing process of dry food divided by raw materials. This graph was made based on the component in patent [1]–[4] and ingredients of dry food written in the package labels. [1] US20180042270 A1 [2] JP6423983 B1 [3] WO2018/175259 A1 [4] US20180255825 A1; Fig. S2, Composition of PCBs in dog dry food, cat dry food, dog wet food and cat wet food; Fig. S3, The ratios of p,p'-DDT (4,4’-DDT) to the total DDTs (ΣDDTs) in the dry and wet pet foods; Fig. S4, Composition of PBDEs in dog dry food, cat dry food, dog wet food and cat wet food; Fig. S5, Comparison of analyzed (median concentration) and estimated OHC concentrations in dry pet foods by different raw materials; Fig. S6, Comparison of analyzed (maximum concentrations) and estimated OHC concentrations in dry pet foods by different raw materials; Fig. S7, Hazard quotient (HQ) of PCBs for each pet food by body weight. The red line indicates HQ=1; Table S14, Concentrations (pg/g ww) of PCBs in dog dry foods; Table S15, Concentrations (pg/g ww) of PCBs in cat dry foods; Table S16, Concentrations (pg/g ww) of PCBs in dog wet foods; Table S17, Concentrations (pg/g ww) of PCBs in cat wet foods; Table S18, Concentrations (pg/g ww) of OCPs in dog dry foods; Table S19, Concentrations (pg/g w.w.) of OCPs in cat dry foods; Table S20, Concentrations (pg/g w.w.) of OCPs in dog wet foods; Table S21, Concentrations (pg/g w.w.) of OCPs in cat wet foods; Table S22, Concentrations (pg/g w.w.) of BFRs and MeO-PBDEs in dog dry food; Table S23, Concentrations (pg/g w.w.) of BFRs and MeO-PBDEs in cat dry foods; Table S24, Concentrations (pg/g w.w.) of BFRs and MeO-PBDEs in dog wet foods; Table S25, Concentrations (pg/g w.w.) of BFRs and MeO-PBDEs in cat wet foods.
This material is available on the Website at https://doi.org/10.5985/emcr.20230009.
REFERENCES
- Ali, N., Malik, R.N., Mehdi, T., Eqani, S.A.M.A.S., Javeed, A., Neels, H., Covaci, A., 2013. Organohalogenated contaminants (OHCs) in the serum and hair of pet cats and dogs: biosentinels of indoor pollution. Sci. Total Environ. 449, 29–36. doi: 10.1016/j.scitotenv.2013.01.037.
- Alharbi, O.M.L., Basheer, A.A., Khattab, R.A., Ali, I., 2018. Health and Environmental Effects of Persistent Organic Pollutants. J. Mol. Liq. 263, 442–453. doi: 10.1016/j.molliq.2018.05.029.
- Bendig, P., Hägele, F., Blumenstein, M., Schmidt, J., Vetter, W., 2013. Fate of polybrominated diphenyl ethers during cooking of fish in a new model cooking apparatus and a household microwave. J. Agric. Food Chem. 61(27), 6728–6733. doi: 10.1021/jf4013696.
- Chow, K., Hearn, L.K., Zuber, M., Beatty, J.A., Mueller, J.F., Barrs, V.R., 2015. Evaluation of polybrominated diphenyl ethers (PBDEs) in matched cat sera and house dust samples: investigation of a potential link between PBDEs and spontaneous feline hyperthyroidism. Environ. Res. 136, 173–179. doi: 10.1016/j.envres.2014.09.027.
- Dirtu, A.C., Niessen, S.J., Jorens, P.G., Covaci, A., 2013. Organohalogenated contaminants in domestic cats’ plasma in relation to spontaneous acromegaly and type 2 diabetes mellitus: A clue for endocrine disruption in humans? Environ. Int. 57, 60–67. doi: 10.1016/j.envint.2013.04.004.
- Dye, J.A., Venier, M., Zhu, L., Ward, C.R., Hites, R.A., Birnbaum, L.S., 2007. Elevated PBDE levels in pet cats: sentinels for humans? Environ. Sci. Technol. 41(18), 6350–6356. doi: 10.1021/es0708159.
- Easton, M.D.L., Luszniak, D., Von der Geest, E., 2002. Preliminary examination of contaminant loadings in farmed salmon, wild salmon and commercial salmon feed. Chemosphere 46(7), 1053–74. doi: 10.1016/s0045-6535(01)00136-9.
- EFSA Panel on Contaminants in the Food Chain (CONTAM), Knutsen, H.K., Alexander, J., Barregård, L., Bignami, M., Brüschweiler, B., ... Grasl-Kraupp, B., 2018. Risk for animal and human health related to the presence of dioxins and dioxin-like PCBs in feed and food. EFSA J. 16(11), e05333. doi: 10.2903/j.efsa.2018.5333.
- European Court of Justice, 2008. Cases C-14/06 and C-295/06, Judgement Court, 1 April 2008, Directive 2002/95/EC and Commission Decision 2005/717/EC. http://curia.europa.eu (accessed January 2020)
- Ferrante, M.C., Di Vaio, P., Magli, E., Frecentese, F., Meli, R., Caliendo, G., Corvino, A., Fiorino, F., Giordano, F., Monnolo, A., Saccone, I., Santagada, V., Severino, B., Calabria, G., Manzo, C., Perissutti E., 2020. PCB levels in adipose tissue of dogs from illegal dumping sites in Campania region (Italy). Chemosphere 244, 125478. doi: 10.1016/j.chemosphere.2019.125478.
- Guo, W., Park, J.S., Wang, Y., Gardner, S., Baek, C., Petreas, M., Hooper, K., 2012. High polybrominated diphenyl ether levels in California house cats: house dust a primary source? Environ. Toxicol. Chem. 31(2), 301–306. doi: 10.1002/etc.1700.
- Guo, W., Gardner, S., Yen, S., Petreas, M., Park, J.S., 2016. Temporal changes of PBDE levels in California house cats and a link to cat hyperthyroidism. Environ. Sci. Technol. 50(3), 1510–1518. doi: 10.1021/acs.est.5b04252.
- Hamers, T., Kamstra, J.H., Sonneveld, E., Murk, A.J., Visser, T.J., Van Velzen, M.J.M., Brouwer, A., Bergman, Å., 2008. Biotransformation of brominated flame retardants into potentially endocrine-disrupting metabolites, with special attention to 2, 2', 4, 4'-tetrabromodiphenyl ether (BDE-47). Mol. Nutr. Food Res. 52(2), 284–298. doi: 10.1002/mnfr.200700104.
- Haraguchi, K., Hisamichi, Y., Kotaki, Y., Kato, Y., Endo, T., 2009. Halogenated bipyrroles and methoxylated tetrabromodiphenyl ethers in tiger shark (Galeocerdo cuvier) from the southern coast of Japan. Environ. Sci. Technol. 43(7), 2288–2294. doi: 10.1021/es802999k.
- Hendriks, H.S., Antunes Fernandes, E.C., Bergman, Å., van den Berg, M., Westerink, R.H., 2010. PCB-47, PBDE-47, and 6-OH-PBDE-47 Differentially modulate human GABAA and α4β2 nicotinic acetylcholine receptors. Toxicol. Sci. 118(2), 635–642. doi: 10.1093/toxsci/kfq284.
- Henríquez-Hernández, L.A., Carretón, E., Camacho, M., Montoya-Alonso, J.A., Boada, L.D., Bernal Martín, V., Falcón Cordón, Y., Falcón Cordón, S., Zumbado, M., Luzardo, O.P., 2017. Potential role of pet cats as a sentinel species for human exposure to flame retardants. Front. Vet. Sci. 4, 79. doi: 10.3389/fvets.2017.00079.
- Hites, R.A., Foran, J.A., Carpenter, D.O., Hamilton, M.C., Knuth, B.A., Schwager, S.J., 2004. Global assessment of organic contaminants in farmed salmon. Science 303, 226–229. doi: 10.1126/science.1091447.
- Ibhazehiebo, K., Iwasaki, T., Kimura-Kuroda, J., Miyazaki, W., Shimokawa, N., Koibuchi, N., 2011. Disruption of thyroid hormone receptor-mediated transcription and thyroid hormone-induced Purkinje cell dendrite arborization by polybrominated diphenyl ethers. Environ. Health Perspect. 119(2), 168–175. doi: 10.1289/ehp.1002065.
- Japan pet food industry, 2018, [Online] (in Japanese). https://www.maff.go.jp/j/chikusan/sinko/lin/l_siryo/cyosa/attach/pdf/kako-73.pdf (accessed July 2023)
- Joint FAO/WHO Expert Committee on Food Additives (JECFA), 1995. Evaluation of certain food additives and contaminants: forty-fourth report of the Joint FAO/WHO Expert Committee on Food Additives. https://apps.who.int/iris/handle/10665/37246 (accessed July 2023)
- Joint FAO/WHO Expert Committee on Food Additives (JECFA), 2000. Evaluation of certain food additives and contaminants: fifty-third report of the Joint FAO/WHO Expert Committee on Food Additives. https://apps.who.int/iris/handle/10665/42378 (accessed July 2023)
- Kunisue, T., Nakanishi, S., Watanabe, M., Abe, T., Nakatsu, S., Kawauchi, S., Sano, A., Horii, A., Kano, Y., Tanabe, S., 2005. Contamination status and accumulation features of persistent organochlorines in pet dogs and cats from Japan. Environ. Pollut. 136(3), 465–476. doi: 10.1016/j.envpol.2004.12.039.
- Kunisue, T., Goto, A., Sunouchi, T., Egashira, K., Ochiai, M., Isobe, T., Tajima, Y., Yamada, T.K., Tanabe, S., 2021. Anthropogenic and natural organohalogen compounds in melon-headed whales (Peponocephala electra) stranded along the Japanese coastal waters: Temporal trend analysis using archived samples in the environmental specimen bank (es-BANK). Chemosphere 269, 129401. doi: 10.1016/j.chemosphere.2020.129401.
- Lau, G., Walter, K., Kass, P., Puschner, B., 2017. Comparison of polybrominated diphenyl ethers (PBDEs) and polychlorinated biphenyls (PCBs) in the serum of hypothyroxinemic and euthyroid dogs. Peer J. 5, e3780. doi: 10.7717/peerj.3780.
- Lea, R.G., Byers, A.S., Sumner, R.N., Rhind, S.M., Zhang, Z., Freeman, S.L., Moxon, R., Richardson, H.M., Green, M., Craigon, J., England, G.C.W., 2016. Environmental chemicals impact dog semen quality in vitro and may be associated with a temporal decline in sperm motility and increased cryptorchidism. Sci. Rep. 6(1), 31281. doi: 10.1038/srep31281.
- Li, X., Dong, S., Zhang, W., Fan, X., Li, Y., Wang, R., Su, X., 2018. Global occurrence of polybrominated diphenyl ethers and their hydroxylated and methoxylated structural analogues in an important animal feed (fishmeal). Environ. Pollut. 234, 620–629. doi: 10.1016/j.envpol.2017.11.059.
- Lukyanova, O.N., Tsygankov, V.Y., Boyarova, M.D., Khristoforova, N.K., 2016. Bioaccumulation of HCHs and DDTs in Organs of Pacific Salmon (Genus Oncorhynchus) from the Sea of Okhotsk and the Bering Sea. Chemosphere 157, 174–180. doi: 10.1016/j.chemosphere.2016.05.039.
- Mensching, D.A., Slater, M., Scott, J.W., Ferguson, D.C., Beasley, V.R., 2012. The feline thyroid gland: a model for endocrine disruption by polybrominated diphenyl ethers (PBDEs)? J. Toxicol. Environ. Health A 75(4), 201–212. doi: 10.1080/15287394.2012.652054.
- Ministry of the Agriculture, Forestry and Fisheries, 2014, [Online] (in Japanese). https://www.maff.go.jp/j/syouan/tikusui/petfood/pdf/140825_pf_seizou.pdf (accessed January 2020)
- Ministry of the Environment, 2016. [Online] (in Japanese). http://www.env.go.jp/chemi/kurohon/tebiki/mat01.pdf (accessed July 2023)
- Ministry of Agriculture and Environment, 2018. [Online] (in Japanese). https://elaws.e-gov.go.jp/search/elawsSearch/elaws_search/lsg0500/detail?lawId=421M60001200001 (accessed July 2023)
- Mizukawa, H., Nomiyama, K., Nakatsu, S., Iwata, H., Yoo, J., Kubota, A., Yamamoto, M., Ishizuka, M., Ikenaka, Y., Nakayama, S.M.M., Kunisue, T., Tanabe, S., 2016. Organohalogen compounds in pet dog and cat: Do pets biotransform natural brominated products in food to harmful hydroxlated substances? Environ. Sci. Technol. 50(1), 444–452. doi: 10.1021/acs.est.5b04216.
- Mizukawa, H., Nomiyama, K., Nakatsu, S., Yamamoto, M., Ishizuka, M., Ikenaka, Y., Nakayama, S.M.M., Tanabe, S., 2017. Anthropogenic and naturally produced brominated phenols in pet blood and pet food in Japan. Environ Sci Technol. 51(19), 11354–11362. doi: 10.1021/acs.est.7b01009.
- Nomiyama, K., Eguchi, A., Mizukawa, H., Ochiai, M., Murata, S., Someya, M., Isobe, T., Yamada, T.K., Tanabe, S., 2011. Anthropogenic and naturally occurring polybrominated phenolic compounds in the blood of cetaceans stranded along Japanese coastal waters. Environ. Pollut. 159(12), 3364–3373. doi: 10.1016/j.envpol.2011.08.035.
- Nomiyama, K., Yamamoto, Y., Eguchi, A., Nishikawa, H., Mizukawa, H., Yokoyama, N., Ichii, O., Takiguchi, M., Nakayama, S.M.M., Ikenaka, Y., Ishizuka, M., 2022. Health impact assessment of pet cats caused by organohalogen contaminants by serum metabolomics and thyroid hormone analysis. Sci. Total Environ. 842, 156490. doi: 10.1016/j.scitotenv.2022.156490.
- Norrgran, J., Jones, B., Bignert, A., Athanassiadis, I., Bergman, Å., 2015. Higher PBDE serum concentrations may be associated with feline hyperthyroidism in Swedish cats. Environ Sci Technol. 49, 5107–5114. doi: 10.1021/acs.est.5b00234.
- Norrgran, J., Bignert, A., Jones, B., Athanassiadis, I., Bergman, Å., Weiss, J.M., 2017. Cats’ internal exposure to selected brominated flame retardants and organochlorines correlated to house dust and cat food. Environ Sci Technol. 51(5), 3012–3020. doi: 10.1021/acs.est.6b05025.
- Poma, G., Sales, C., Bruyland, B., Christia, C., Goscinny, S., Van Loco, J., Covaci, A., 2018. Occurrence of organophosphorus flame retardants and plasticizers (PFRs) in Belgian foodstuffs and estimation of the dietary exposure of the adult population. Environ Sci Technol. 52(4), 2331–2338. doi: 10.1021/acs.est.7b06395.
- Saktrakulkla, P., Lan, T., Hua, J., Marek, R.F., Thorne, P.S., Hornbuckle, K.C., 2020. Polychlorinated biphenyls in food. Environ. Sci. Technol. 54(18), 11443–11452. doi: 10.1021/acs.est.0c03632.
- Shimasaki, M., Mizukawa, H., Takaguchi, K., Saengtienchai, A., Ngamchirttakul, A., Pencharee, D., Khidkhan, K., Ikenaka, Y., Nakayama, S.M.M., Ishizuka, M., Nomiyama, K., 2022. Contamination status of pet cats in Thailand with organohalogen compounds (OHCs) and their hydroxylated and methoxylated derivatives and estimation of sources of exposure to these contaminants. Animals (Basel) 12(24), 3520. doi: 10.3390/ani12243520.
- Sumner, R.N., Tomlinson, M., Craigon, J., England, G.C.W., Lea, R.G., 2019. Independent and combined effects of diethylhexyl phthalate and polychlorinated biphenyl 153 on sperm quality in the human and dog. Sci. Rep. 9(1), 3409. doi: 10.1038/S41598-019-39913-9.
- Sumner, R.N., Byers, A., Zhang, Z., Agerholm, J.S., Lindh, L., England, G.C.W., Lea, R.G., 2021. Environmental chemicals in dog testes reflect their geographical source and may be associated with altered pathology. Sci. Rep. 11(1), 7361.doi: 10.1038/S41598-021-86805-Y.
- Teuten, E.L., Xu, L., Reddy, C.M., 2005. Two abundant bioaccumulated halogenated compounds are natural products. Science 307(5711), 917–920. doi: 10.1126/science.1106882.
- Tue, N.M., Sudaryanto, A., Minh, T.B., Isobe, T., Takahashi, S., Viet, P.H., Tanabe, S., 2010. Accumulation of polychlorinated biphenyls and brominated flame retardants in breast milk from women living in Vietnamese e-waste recycling sites. Sci. Total Environ. 408(9), 2155–2162. doi: 10.1016/j.scitotenv.2010.01.012.
- Ucán-Marin, F., Arukwe, A., Mortensen, A.S., Gabrielsen, G.W., Fox, G.A., Letcher, R.J., 2009. Recombinant transthyretin purification and competitive binding with organohalogen compounds in two gull species (Larus argentatus and Larus hyperboreus). Toxicol. Sci. 107(2), 440–450. doi: 10.1093/toxsci/kfn240.
- US.EPA, Integrated Risk Information System (IRIS) Assessment [Online]. https://cfpub.epa.gov/ncea/iris_drafts/AtoZ.cfm (accessed July 2023)
- van Boxtel, A.L., Kamstra, J.H., Cenijn, P.H., Pieterse, B., Wagner, J.M., Antink, M., Krab, K., van der Burg, B., Marsh, G., Brouwer, A., Legler, J., 2008. Microarray analysis reveals a mechanism of phenolic polybrominated diphenylether toxicity in zebrafish. Environ. Sci. Technol. 42(5), 1773–1779. doi: 10.1021/es0720863.
- Van den Berg, M., Birnbaum, L.S., Denison, M., De Vito, M., Farland, W., Feeley, M., Fiedler, H., Hakansson, H., Hanberg, A., Haws, L., Rose, M., Safe, S., Schrenk, D., Tohyama, C., Tritscher, A., Tuomisto, J., Tysklind, M., Walker, N., Peterson, R.E., Rose, M., 2006. The 2005 World Health Organization reevaluation of human and mammalian toxic equivalency factors for dioxins and dioxin-like compounds. Toxicol. Sci. 93, 223–241. doi: 10.1093/toxsci/kfl055.
- Venier, M., Hites, R.A., 2011. Flame retardants in the serum of pet dogs and in their food. Environ. Sci. Technol. 45(10), 4602–4608. doi: 10.1021/es1043529.
- Wan, Y., Liu, F., Wiseman, S., Zhang, X., Chang, H., Hecker, M., Jones P.D., Lam, M.H.W., Giesy, J.P., 2010. Interconversion of hydroxylated and methoxylated polybrominated diphenyl ethers in Japanese medaka. Environ. Sci. Technol. 44(22), 8729–8735. doi: 10.1021/es102287q.
- Ward, J., Mohapatra, S.P., Mitchell, A., 2008. An overview of policies for managing polybrominated diphenyl ethers (PBDEs) in the Great Lakes basin. Environ. Int. 34(8), 1148–1156. doi: 10.1016/j.envint.2008.05.003.
- WHO, 2003. Concise International Chemical Assessment Document 55. http://www.inchem.org/documents/cicads/cicads/cicad55.htm#10.2 (accessed July 2023)
- Zacs, D., Perkons, I., Abdulajeva, E., Pasecnaja, E., Bartkiene, E., Bartkevics, V., 2021. Polybrominated diphenyl ethers (PBDEs), hexabromocyclododecanes (HBCDD), dechlorane-related compounds (DRCs), and emerging brominated flame retardants (EBFRs) in foods: The levels, profiles, and dietary intake in Latvia. Sci. Total Environ. 752, 141996. doi: 10.1016/j.scitotenv.2020.141996.
