ABSTRACT
Three monitoring methods, including manual monitoring methods based on active and passive samplings and an automatic active monitoring method, for atmospheric mercury (Hg) concentrations are recommended in the guidance on monitoring Hg based on Article 22 of the Minamata Convention on Mercury, which entered into force in 2017. However, among these methods, the dataset obtained by manual monitoring based on active sampling and automatic active monitoring has not yet been verified. Parallel observations using these two methods were conducted in one month for each season from May 2021 to February 2022 at urban and rural sites in Japan. The main objective of this study was to evaluate the comparability of the observations obtained using the two methods. Because the sampling duration of the manual monitoring method based on active sampling using the Japanese monitoring network was 24 h, the data on the daily mean concentrations of atmospheric Hg obtained by both methods were compared, and their consistency was evaluated using t-test, correlation analysis, and Bland–Altman analysis.
The observation values obtained by the two methods were consistent (correlation coefficients=0.99 or higher) in all seasons, despite the large seasonal variation in meteorological conditions, and the unpaired t-test indicated that there were no differences between them in each season. Moreover, the Bland–Altman analysis showed that more than 96% of the data points were found to be within the 95% limit of agreement. Therefore, the manual monitoring method based on active sampling used in this study was in better agreement with the automatic active monitoring method. These results indicate that the data obtained by both methods are comparable. Additionally, manual monitoring based on active sampling can be used to build mercury monitoring networks at a lower cost than automatic active monitoring. Overall, the data obtained by both methods were proven to be beneficial for the effectiveness evaluation of the Minamata Convention.
INTRODUCTION
Mercury (Hg), with an atomic number of 80 and atomic weight of 200.59, is the only metal existing in a liquid state at normal temperature and pressure (melting point: −39°C, boiling point: 357°C) (Schroeder and Munthe, 1998). It has been released into the atmosphere by volcanic activity and crustal deformation since ancient times and has existed and circulated in various natural environments, including air, soil, land, and sea areas (UNEP, 2002). The total amount of Hg emitted into the atmosphere is estimated to be 35–45.4 Mmol yr−1, of which 10% is naturally released because of volcanic activity, 29%–33% is emitted by anthropogenic sources, and the remaining 60% is believed to be the re-emission of deposited and accumulated Hg on terrestrial and sea areas over a long period (UNEP, 2019). Major anthropogenic Hg sources, originating from both direct Hg use or emissions as a byproduct, include coal combustion; disposal of Hg-based thermometers, barometers, fluorescent lamps, and other waste products; artisanal and small-scale gold mining; and the production of Hg itself, which is used as a catalyst to manufacture caustic soda and other industrial products (UNEP, 2002). However, Hg and Hg compounds are highly toxic and harmful to living organisms, as observed in Minamata Disease (Eto et al., 2010).
Most of the total atmospheric Hg is gaseous elemental Hg (GEM), whereas gaseous oxidized Hg (GOM) and particulate-bound Hg (PBM) typically account for only a small percentage of the total atmospheric Hg (Schroeder and Munthe, 1998). The residence time of GEM in the atmosphere is approximately 0.5 years (Weiss-Penzias et al., 2003), during which it circulates extensively worldwide. However, the residence times of GOM and PBM range from a few hours to weeks (Fitzgerald et al., 1998; Huang et al., 2013). Further, GEM is converted to GOM and PBM through various physical and chemical reactions during transport, and GOM and PBM are easily deposited via wet and dry processes on land and sea surfaces far from emission sources. Therefore, monitoring atmospheric GEMs is important for evaluating Hg circulation in the environment.
In Japan, the Air Pollution Control Law was revised in 1996 by the Ministry of the Environment; consequently, Hg and its compounds in the air were listed as priority substances to be addressed as hazardous air pollutants. Additionally, the “guideline value for reducing health risks due to hazardous air pollutants” was set at 40 ng Hg m−3 (Ministry of the Environment, Japan, 2003). The “Manual of Methods for Measuring Hazardous Air Pollutants: Gold Amalgam Collection, Heating, Vaporization, and Cold Atomic Absorption Method” was issued as the official monitoring method for atmospheric Hg concentrations in the air. In this method, sampling is performed using a gold amalgamation cartridge for 24 h, and the atmospheric Hg collected by the cartridge is then analyzed in the laboratory to simply and affordably obtain an average daily concentration. This method is conducted regularly at 281 sites throughout Japan (Ministry of the Environment, Japan, 2011).
Manual monitoring methods based on active sampling using a suction pump and passive sampling where Hg gas is collected by molecular diffusion on an adsorbent, as well as an automatic monitoring method using a continuous air Hg monitor, have been recommended in guidance on Hg monitoring for evaluating the effectiveness of the Convention based on Article 22 of the Minamata Convention on Mercury, which became effective in 2017. The official Japanese method is categorized as manual monitoring based on active sampling. To use monitoring data provided by each country to evaluate the effectiveness of the Minamata Convention, it is necessary to verify that the data from the three methods are comparable. It has already been confirmed by McLagan et al. (2018) that the data obtained by the manual monitoring method based on passive sampling and the automatic monitoring method are consistent. However, there is no evidence of a comparative verification of data between manual monitoring based on active sampling and automatic active monitoring.
Therefore, to bridge this gap, in this study, we monitored atmospheric Hg concentrations using the official Japanese method in parallel with the automatic active monitoring method at urban and rural sites where Tekran’s automatic speciated Hg monitoring system (Tekran Inc., Toronto, ON, Canada) had already been installed. This system is widely used for monitoring atmospheric Hg worldwide (Gay et al., 2013; Slemr et al., 2015; Sprovieri et al., 2016). However, the system is usually operated on a 2 or 3 h cycle with 1 or 2 h of GEM measurements (5 min interval) and GOM and PBM2.5 preconcentration, followed by 1 h of analysis. Therefore, even with the same 24-hour monitoring period, the GEM sampling duration of this system is shorter than that of the official Japanese method. Thus, it is necessary to examine whether the data obtained using these two methods are comparable.
MATERIALS AND METHODS
SAMPLING SITES
Information on the sampling and related sites is presented in Fig. 1. Fukuoka station (33.62°N, 130.41°E, Altitude: 27 m) is located in the urban area of Fukuoka City in the northern Kyushu region, which is susceptible to air pollutants transported from the Asian continent (Hatakeyama et al., 2004; Naja and Akimoto, 2004; Takami et al., 2005, 2016; Yoshino et al., 2021, 2022). Many potential Hg emission sources, such as the arterial road (Route No.3) and expressway, large waste incinerators, concrete manufacturing plants, and liquefied petroleum gas reservoirs, exist around the station.

Fig. 1 Locations of the sampling sites
Alternatively, Oga station (39.89°N, 139.85°E, Altitude: 23 m) is located in the northern part of the Japanese islands and is influenced by air pollutants transported from Russia and northeastern China. The station is surrounded by mountains from west to north and faces the inner bay from east to south. Lumber processing plants and seafood-processing factories exist along the bay coast. They are potential sources of Hg emissions because imported lumber is sometimes coated with Hg compounds for use as antiseptics (Fuse, 1961), and Hg in seafood is likely to be released by heat treatment during processing. Additionally, three small waste incinerators are located in the north and northeast within 10 km of the site.
Atmospheric Hg was continuously monitored at both stations using a Tekran automatic speciated Hg monitoring system. Meteorological parameters, including wind direction and speed, air temperature, relative humidity, air pressure, and precipitation depth, were also observed. Additionally, the concentrations of carbon monoxide (CO) were continuously observed at both stations using a continuous monitor (APMA-370; Horiba Co. Ltd., Kyoto, Japan). CO was useful for distinguishing whether atmospheric Hg pollution was because of long-range transportation from the Asian region or local emission sources (Jaffe et al., 2005; Choi et al., 2009; Sheu et al., 2010; Marumoto et al., 2015). However, CO data could not be obtained in winter at Fukuoka station due to a CO monitor malfunction.
MANUAL MONITORING BASED ON ACTIVE SAMPLING, “GOLD AMALGAM COLLECTION, HEATING, VAPORIZATION, AND COLD ATOMIC ABSORPTION METHOD” (METHOD A; MINISTRY OF THE ENVIRONMENT, JAPAN, 2011)
Fig. 2 shows a schematic of the atmospheric Hg sampling unit. In this method, atmospheric Hg was collected via air suction using a gold amalgamation cartridge, in which a quartz tube (160 mm length and 6 mm outer diameter) was filled with an absorbent composed of gold-coated diatomaceous earth particles. After sampling, atmospheric Hg on the gold amalgamation cartridge was measured using dual gold amalgamation–cold vapor atomic absorption spectrometry (MA3000+RH-MA3, Nippon Instrument Co. Ltd., Osaka, Japan). The detection limit of this method was below 0.1 ng m−3, which was approximately one-tenth lower than the Hg concentrations in background air when the recommended sampling condition (flow rate: 0.5 L min−1, sampling duration: 24 h) was adopted.

Fig. 2 Schematic of the sampling equipment by the Japanese official method, Method A
In this study, duplicate sampling was conducted under the above sampling conditions at Fukuoka and Oga stations in each season from May 11 to June 8 (spring), August 3 to September 4 (summer), November 2 to 30 (autumn) in 2021, and January 18 to February 15 (winter) in 2022. At both locations, the air inlet was placed approximately 3 m away from the air inlet of the automatic speciated Hg monitoring system. Sampling was started at 10:00 (JST) each day and was completed at 10:00 (JST) the next day. In total, 226 gold cartridges (113 samples each from Fukuoka and Oga) were collected. A soda-lime column, comprising soda-lime particles in a Teflon tube (80 mm length, 6 mm inner diameter, and 8 mm outer diameter) covered at both ends with quartz wool, was installed in front of the gold amalgamation cartridge to minimize the adhesion of interfering substances to the cartridge, although the use of soda lime is not described in the official manual of the Japanese method (Ministry of the Environment, Japan, 2011). Because almost all atmospheric GOM and PBM2.5 are trapped in quartz wool (Lyman and Jaffe, 2012), only GEM could be measured by the method used in this study. The soda-lime column was changed for each sampling. The mean relative errors by the duplicate measurements (defined as absolute difference of duplicate/Average of duplicate×100 [%]) was 1.7%±1.6% (N=113) at Fukuoka and 3.5%±2.6% (N=113) at Oga. The maximum relative error was 10.4%, which was lower than the criterion (30%) of the official Japanese method for measuring duplicate.
The lower limit of quantification (LOQ) was defined as 10 times the standard deviation obtained when a known amount of Hg standard gas (20 μL at 22.8°C; 0.332 ng Hg) in a standard gas box (MB-1, Nippon Instrument Co. Ltd.) was measured five times for each batch measurement. The Hg concentration was calculated assuming that 720-L air was sampled under the above sampling conditions. The lower LOQ ranged from 0.029 to 0.074 ng m3, which is one-tenth of the air Hg level in the background concentrations (Sprovieri et al., 2016). The travel blank and tests were performed as follows. Three gold cartridges were shipped to the sampling sites and the laboratory, and the blanks (N=24; three cartridges×four times×two sites) were measured in the laboratory during each of the four seasonal surveys. All travel blanks were below the lower LOQ. The recovery test was conducted for 24-h air sampling using six cartridges, of which a known amount of Hg was added to three cartridges in advance, whereas Hg was not added to three cartridges. The recovery, which was calculated from the differences between their average values, was 100.0%±1.4% (N=3).
AUTOMATIC ACTIVE MONITORING USING A TEKRAN AUTOMATIC SPECIATED Hg MONITORING SYSTEM (METHOD B; TEKRAN INC., 2002)
The atmospheric concentrations of GEM, GOM, and PBM2.5 have been continuously measured at the Fukuoka and Oga stations since June 2013 and August 2014, respectively, using a Tekran automatic speciated Hg monitoring system (MODELS 2537X, 1130, and 1135). The operating conditions have been comprehensively described in previous studies (Marumoto et al., 2015, 2019). The system was operated on a 3-h cycle with 2 h of GEM measurements and GOM and PBM2.5 preconcentration followed by 1 h of analysis. During the 2-h GEM measurements, GEM concentrations were measured every 5 min using two parallel pure gold amalgamation cartridges. The Tekran cold vapor atomic fluorescence detector (MODEL 2537X) was automatically calibrated for 40 min every 24 h with an internal standard gas generator. To check the auto-calibration system, saturated Hg standard gas (MB-1, Nippon Instruments Co. Ltd.) was externally injected manually three times at each station using Method A. The recoveries of the measured values were acceptable (99%–104%). Additionally, the maintenance of the instruments and exchange of a KCl-coated denuder for collecting GOM were performed once a week. Therefore, an average of 184 data point, corresponding to approximately 16 h of observation time, were obtained within a 24-hour period. The method detection limit (MDL) of GEM was less than 0.1 ng m−3 (Tekran Inc., 2002). In the current study, all measured values were 10 times higher than the MDL. The MDLs for GOM and PBM2.5 were approximately 0.001 ng m−3 as determined from their blank values recorded from the third reading during the zero-air flush.
STATISTICAL ANALYSIS
The relative error between both methods was calculated as follows:
|
a-b
(
a+b
)
/2
×100 (
%
) ,
|
where a and b are the air Hg concentrations obtained using Methods A and B, respectively. The b values were calculated as the average of the 5-min data obtained by Method B during the sampling period of Method A.
To evaluate the differences in the values measured by Methods A and B, an unpaired t-test was conducted using MS Excel for Office 2019 based on the hypothesis that the average values of the two methods were not different. Additionally, regression and Bland–Altman analyses (Bland and Altman, 1986) were conducted. The Bland–Altman analysis compared the degree of agreement between the two methods by plotting the average values of the two methods on the horizontal axis and the difference between the two methods on the vertical axis. The mean and standard deviation (SD) of the difference between the two methods were calculated, and the range of mean±1.96×SD was defined as the 95% limit of agreement (LOA). If 95% of the data converged within this range, the degree of agreement was good, and the results of the two methods can be considered compatible (Bland and Altman, 1986; Kotake and Sato, 2009).
RESULTS
FUKUOKA STATION (URBAN)
Fig. 3 shows the observation results of atmospheric GEM concentrations obtained by Methods A and B and CO concentrations for each season at Fukuoka station. The mean concentrations using Methods A and B during the entire study period were 2.01 and 1.98 ng m−3, respectively. The mean concentrations of GOM and PBM2.5 were 0.005±0.009 and 0.008±0.010 ng m−3, which were less than 1% of the GEM. This indicates that almost all atmospheric Hg was GEM at Fukuoka station. Based on the data obtained by Method B, the higher GEM concentration events coincided with high CO-concentration events, as shown by the arrows in Fig. 3. Additionally, in some of these concurrent pollution events, significant positive correlations (P<0.05) were found between hourly averaged GEM and CO concentrations during the event period. The analysis based on the slope of the correlation between GEM and CO (Sheu et al., 2010; Marumoto et al., 2015) indicated that some of these events were caused by influence of long-range transport from the Asian region, as represented by the black arrows in Fig. 3.

Fig. 3 Time series of atmospheric GEM concentrations obtained by Methods A and B and CO concentrations at Fukuoka station. The 5-min data of GEM obtained by Method B and the 1-h CO data. The black open squares show the sampling days when the relative errors between the two methods according to the Brand–Altman analysis deviated from the range of the limit of agreement, as described in “DISCUSSION” section. The arrows indicate concurrent higher-concentration events of GEM and CO, and the black and white arrows indicate significant positive correlations between the two components and a lack of correlation during the event periods, respectively
The mean, maximum, and minimum values, and standard deviations for the GEM concentrations and relative errors for each season are presented in Table 1. The mean relative error between the two methods was 1.3%, ranging from −19.6% to 22.3%. Comparing the mean concentrations between the two methods, no significant difference was observed between seasons (t-test, P<0.05). Additionally, the slopes of the regression lines comparing the two methods in each season were virtually identical (0.969–1.026), and the correlation coefficients of the lines for each season were close to unity, ranging from 0.9984 to 0.9998. The regression line from the datasets obtained by Methods A and B for all seasons is shown in Fig. 4.
Table 1 Mean, maximum, and minimum values and standard deviations for Hg concentrations and relative errors of both methods at Fukuoka station
| Spring
(28 days) | Summer
(29 days) | Fall
(28 days) | Winter
(28 days) | All seasons |
|---|
| Method A | Method B | Method A | Method B | Method A | Method B | Method A | Method B | Method A | Method B |
|---|
| Air Hg Concentration (ng m−3) | Mean | 2.24 | 2.15 | 1.78 | 1.81 | 1.88 | 1.85 | 2.16 | 2.13 | 2.01 | 1.98 |
| Maximum | 5.48 | 5.82 | 2.73 | 3.32 | 2.71 | 2.65 | 3.03 | 3.01 | 5.48 | 5.82 |
| Minimum | 1.72 | 1.65 | 1.35 | 1.43 | 1.49 | 1.48 | 1.69 | 1.65 | 1.35 | 1.43 |
| S.D. | 0.71 | 0.77 | 0.30 | 0.34 | 0.32 | 0.31 | 0.35 | 0.35 | 0.48 | 0.50 |
| Relative Errors (%) | Mean | | 4.6 | | −2.5 | | 1.9 | | 1.4 | | 1.3 |
| Maximum | | 12.9 | | 22.3 | | 2.7 | | 3.3 | | 22.3 |
| Minimum | | −6.0 | | −19.6 | | 1.5 | | −2.2 | | −19.6 |
| S.D. | | 4.0 | | 6.5 | | 0.3 | | 1.4 | | 4.8 |

Fig. 4 Regression lines from the data obtained by both methods at Fukuoka station. The dashed line represents unity
Fig. 5 presents the Bland–Altman analysis results for the observational data. As shown in the Fig. 5, 28 or 29 data points were plotted, and if 27 points of 28 (27/28×100=96.7%) or 28 points of 29 (28/29×100=96.6%) converged within the LOA, the agreement was high, and the two methods were judged to be compatible. We observed that more than 95% of the data points were plotted within the LOA for all seasons except summer. However, one point in spring (May 14, 2021), one point in summer (August 8, 2021), and one point in winter (January 26, 2022) was lower than the lower limit of the LOA, indicating that the data obtained by Method B were higher than those obtained by Method A. Contrastingly, one point in summer (September 2, 2021) was higher than the upper limit of the LOA, indicating that the data obtained by Method A were higher. Although the factors affecting these differences are discussed in “DISCUSSION” section, almost all data points obtained at Fukuoka station using both methods showed good agreement.

Fig. 5 Results of the Bland–Altman analysis at Fukuoka station in each season. The black and dashed lines represent the mean and upper and lower LOA, respectively
Fig. 6 shows the observation results for the atmospheric Hg concentration at Oga station. The mean concentrations using Methods A and B during the entire study period were 1.57 and 1.54 ng m−3, respectively. The mean concentrations of GOM and PBM2.5 were 0.002±0.003 and 0.004±0.008 ng m−3, which were less than 1% of the GEM. Therefore, almost all of the atmospheric Hg at the Oga station was GEM. Higher GEM and CO-concentration events also occurred at this station as well as at Fukuoka station.

The mean, maximum, and minimum values, and standard deviations for Hg concentrations and relative errors for each season are presented in Table 2. The mean relative error between the two methods was 2.1%, ranging from −7.1% to 14.0%. There were no significant differences in the mean concentrations between the two methods in each season (t-test, P<0.05). Additionally, the regression lines comparing the two methods in each season were virtually identical (0.954–1.002), and the correlation coefficients of the lines for each season were nearly unity, ranging from 0.9990 to 0.9994. The regression line from the datasets obtained by Methods A and B for all seasons is shown in Fig. 7.
Table 2 Mean, maximum, and minimum values, standard deviations for the Hg concentrations, and relative errors of both methods at the Oga station
| Spring
(28 days) | Summer
(29 days) | Fall
(28 days) | Winter
(28 days) | All seasons |
|---|
| Method A | Method B | Method A | Method B | Method A | Method B | Method A | Method B | Method A | Method B |
|---|
| Air Hg Concentration (ng m-3) | Mean | 1.70 | 1.68 | 1.49 | 1.50 | 1.47 | 1.42 | 1.64 | 1.57 | 1.57 | 1.54 |
| Maximum | 2.07 | 2.14 | 1.94 | 1.94 | 1.84 | 1.74 | 2.52 | 2.20 | 2.52 | 2.20 |
| Minimum | 1.31 | 1.34 | 1.07 | 1.05 | 1.23 | 1.23 | 1.44 | 1.33 | 1.07 | 1.05 |
| S.D. | 0.21 | 0.20 | 0.24 | 0.24 | 0.16 | 0.13 | 0.24 | 0.23 | 0.23 | 0.23 |
| Relative Errors (%) | Mean | | 0.8 | | −0.3 | | 3.4 | | 4.6 | | 2.1 |
| Maximum | | 6.9 | | 9.0 | | 8.1 | | 14.0 | | 14.0 |
| Minimum | | −4.2 | | −7.1 | | −6.8 | | −2.7 | | −7.1 |
| S.D. | | 3.3 | | 2.9 | | 3.3 | | 3.5 | | 3.7 |
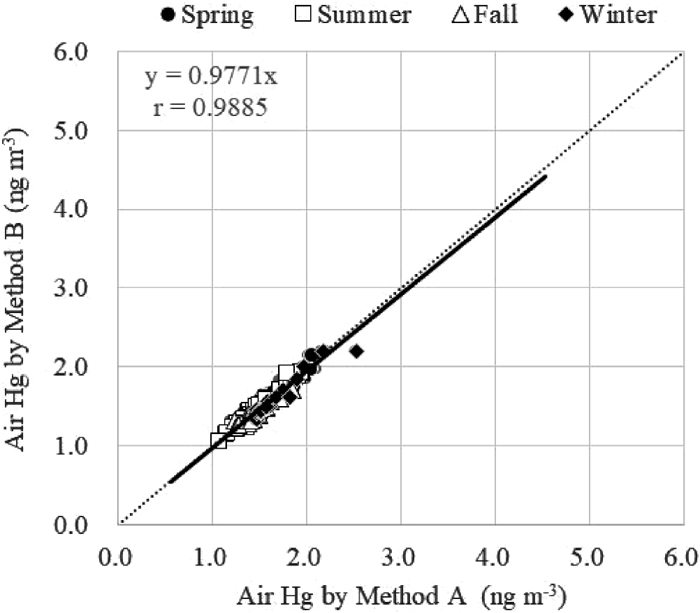
Fig. 7 Regression lines from the data obtained from both methods at the Oga station. The dashed line represents unity
Fig. 8 presents the Bland–Altman analysis results for the observational data. More than 95% of the data points were plotted within the LOA for all seasons except summer. However, four points deviated from the scope of the LOA, but to a lesser extent than those at Fukuoka station. One point each in summer (August 30, 2021) and autumn (November 2, 2021) was lower than the lower limit of the LOA, indicating that the data obtained using Method B were higher. In contrast, one point in summer (August 16, 2021) and one point in winter (January 25, 2022) was higher than the upper limit of the LOA, indicating that the data obtained using Method A were higher. The factors affecting these differences are discussed in “DISCUSSION” section; nonetheless, most of the data obtained at Oga station, acquired through the two methods, were in good agreement.

Fig. 8 Results of the Bland–Altman analysis at Oga station in each season. The black and dashed lines represent the mean and the upper and lower LOA, respectively
DISCUSSION
Statistical analyses, including the t-test, regression analysis, and Brand–Altman analysis, suggested that comparable data could be obtained using both Methods A and B in each season, even though the sampling durations of the both method is not consistent. Figs. 9 and 10 show box-whisker plots compiled by hours based on 5-min data obtained by Method B for each season at Fukuoka and Oga stations. The median, 25th and 75th percentile values slightly varied over time in each season at both stations, although higher concentrations were sometimes observed. Thus, the small diurnal variation in atmospheric GEM concentrations is one of the reasons why there is little difference in the daily mean values of both monitoring data despite the different sampling durations.

Fig. 9 Box-whisker plots compiled by hours on the basis of 5-min data obtained by Method B for each season at Fukuoka. The mean values are indicated by “×” marks. The numbers represent maximum values outside the axis

Fig. 10 Box-whisker plots compiled by hours on the basis of 5-min data obtained by Method B for each season at Oga. The mean values are indicated by “×” marks. The numbers represent maximum values outside the axis
However, in the Brand–Altman analysis, the mean values (bias) of the difference, as shown in Figs. 5 and 8, shifted to the positive area in each season, except in summer, indicating that the data obtained by Method A were slightly higher than those obtained by Method B. Additionally, the Bland–Altman analysis revealed that eight datasets (N=226) deviated from the scope of the LOA (Table 3). In general, the lower the concentration, the more likely it is to deviate from the LOA range, due to the influence of blank values and the lack of sensitivity (Bland and Altman, 1986). However, the results showed no concentration dependence on the degree of deviation from the LOA. A case analysis was conducted to determine the conditions that contributed to the differences in the measurement values obtained using the two methods.
Table 3 Cases where the difference between the two methods deviated from the LOA scope
| Station | Date | Air Hg concentration (ng m−3) | Relative errors between the two methods (%) | Relative errors in duplicate analysis using Method A (%) |
|---|
| Method A | Method B |
|---|
| Fukuoka | 14–15 May 2021 | 5.48 | 5.82 | −6.0 | 0.5 |
| Fukuoka | 17–18 August 2021 | 2.73 | 3.32 | −19.6 | 2.2 |
| Fukuoka | 2–3 September 2021 | 2.47 | 1.98 | 22.3 | 1.6 |
| Fukuoka | 26–27 January 2022 | 2.78 | 2.84 | −2.1 | 1.9 |
| Oga | 16–17 August 2021 | 1.36 | 1.24 | 9.2 | 1.6 |
| Oga | 30–31 August 2021 | 1.79 | 1.92 | −7.1 | 1.2 |
| Oga | 2–3 November 2021 | 1.23 | 1.32 | −9.9 | 7.1 |
| Oga | 25–26 January 2022 | 2.52 | 2.19 | 14.0 | 0.3 |
First, on May 14–15 and August 17–18, 2021, when the measurement values by Method B were higher than those by Method A, extremely high GEM concentrations were observed at Fukuoka station over an extremely short period (Fig. 3). The maximum GEM concentration was 327 ng m−3 in 5 min from 5:55, and 209 ng m−3 of GEM was observed in the next 5 min on May 15. Concentrations exceeding 100 ng m−3 were also observed at 10 min from 16:15 on August 17. There were no correlations between GEM and CO concentrations during these periods. The wind direction (SSW) and speed (1.5 to 3.5 m s−1) at higher GEM concentrations indicated that polluted air could flow from local emission sources in urban centers. Slightly higher GEM concentrations persisted for more than 1 h from 15:55 to 17:15 on January 26, 2022, at Fukuoka. These higher GEM events occurred over a short period, and the concentrations immediately returned to baseline. At one point in Method B, the GEM concentrations were not observed for a discontinuous 8 h period during the 24-h sampling in Method A because of the GOM and PBM2.5 measurements. Therefore, if the GEM concentrations in these periods were equal to the baseline level, the 24-h average concentrations calculated from the data obtained using Method B were overestimated. Indeed, the 24-h average concentrations calculated assuming that the GEM concentrations during the no-measurement periods of Method B were equal to the baseline were approximately consistent with those of Method A. Contrary to these cases, on August 30–31, the low concentrations at the Oga station, when GEM was not measured by Method B, may have caused the difference in the 24-h average concentrations obtained by the two methods. According to the 5-min measurements by Method B, the GEM concentrations fluctuated between 1.6 and 2.4 ng m−3 from 10:00 on August 30 to 3:45 in the next day; however, approximately 1.1 ng m−3 of concentrations were observed in the remaining period. During 4.5 h of these 6.5 h, GEM concentrations were not measured because of detector calibration and equipment maintenance. Assuming that the Hg concentration in the period when GEM was not measured was 1.1 ng m−3, the 24-h average concentration on August 30–31 obtained by Method B was recalculated to be 1.73 ng m−3 (original 24-h average concentration was 1.92 ng m−3), which was close to 1.79 ng m−3 obtained by Method A. Therefore, the 24-h average concentration acquired by Method B may occasionally be overestimated even when the concentration is low when GEM is not measured.
However, the measurement values obtained by Method A were higher than those obtained by Method B on September 2–3, 2021 at Fukuoka and on January 25–26, 2022 at Oga, with 22.3% and 14% of the relative errors, respectively, of both methods being higher on these days than on other days. On September 2–3, the GEM concentrations in the 5-min dataset increased from approximately 2.0 ng m−3 to a maximum of 4.5 ng m−3 before and after the GOM and PBM2.5 measurements and calibrations (Fig. 11a). Assuming that the GEM concentration in the period when it was not measured by Method B was 4.5 ng m−3, the daily average value was calculated as 2.34 ng m−3, which was close to the value obtained using Method A (2.47 ng m−3). Therefore, the concentration obtained by Method A may have been higher than that obtained by Method B. In addition, a heavy rainfall event, in which the maximum hourly precipitation was 51.5 mm h−1, occurred on the morning of September 3. Consequently, highly humid air likely passed through the soda-lime column and reached the gold cartridge. If the column and cartridge receive high moisture levels, this can result in positive and negative errors in Hg measurements because it makes the flow rate of the suction pump unstable despite the pump’s mass flow controller. Method B was probably less affected by highly humid air because the Tekran instrument minimized the influence of moisture condensation by heating the air inlet and sampling line. Conversely, on January 25–26, the GEM concentrations at Oga in the 5-min dataset fluctuated greatly from night to the next early morning (Fig. 11b). Therefore, the large difference between the values obtained by both methods may have occurred because of the relatively large fluctuations in the GEM concentration when GEM was not measured.

Fig. 11 Five-min observation data in GEM concentrations on September 2–3, 2021, at Fukuoka (a) and on January 25–26, 2022, at Oga (b). The gray bars indicate the period when there were no GEM observations due to the GOM and PBM2.5 measurements and calibration
A higher mean concentration of GEM acquired using Method A was also observed on August 16–17 in Oga. The factors causing the difference in the values obtained by the two methods remain unclear; however, the GEM concentrations were slightly higher before the GOM and PBM2.5 measurements. Therefore, the difference between the two methods may have occurred for the same reason on September 2–3, 2021 in Fukuoka and January 25–26, 2022 in Oga. Meanwhile, it was difficult to determine the reasons for the lower mean GEM concentration using Method A on November 2–3 in Oga. However, the relative error of the duplicate analysis using Method A during this period was relatively large (7.1%), indicating that fluctuations in Method A influenced the differences in the values obtained by the two methods.
At the Fukuoka and Oga stations, the diurnal and seasonal variations of GEM concentrations were not large. Therefore, the GEM concentrations are considered nearly stable throughout the year, despite occasional large fluctuations. Table 4 shows the annual data variability for both stations obtained using Method B for FY2021, when parallel observations by both methods were conducted in this study. The interquartile range (IQ range), defined as the difference between the 25th and 75th percentile values and often used as a measure of variability, was low at 0.44 and 0.27 ng m−3 at the Fukuoka and Oga stations, respectively. The ranges from the 5th to 95th percentile values (0.05–0.95 range) at the Fukuoka and Oga stations were also 1.13 and 0.94 ng m−3, respectively, and these 0.05–0.95 ranges were approximately half the mean values, indicating that the concentration fluctuations were small throughout the year at both stations. Because the Fukuoka station is located in an urban area and close to the Asian continent, it is expected to have more variability than Oga because of the influence of nearby emission sources and regional pollution by long-range transportation, but there was little difference between Methods A and B.
Table 4 Statistical summary (means; standard deviations; and percentiles 5
th, 25
th, 50
th, 75
th, and 95
th ) of GEM measurements for fiscal year 2021 obtained by method B at the Fukuoka and Oga stations
| Station | N | Mean | SD | 5th percentile | 25th percentile | 50th percentile | 75th percentile | 95th percentile |
|---|
| Fukuoka | 66,815 | 1.94 | 1.72 | 1.47 | 1.66 | 1.84 | 2.09 | 2.60 |
| Oga | 67,417 | 1.56 | 1.27 | 1.16 | 1.35 | 1.46 | 1.62 | 2.10 |
Seventeen of 23 stations in the GMOS network, which deploys stations worldwide, and 18 of 21 stations in AMNet, which deploys stations within the United States, had the smaller IQ and 0.05–0.95 ranges than the Fukuoka station (Gay et al., 2013; Sprovieri et al., 2016). In addition, the IQ ranges of all 11 sites deployed in the Canadian network, CAMNet, were smaller than those of Fukuoka station (Sprovieri et al., 2010). In these networks, the same method as in Method B was used at most stations. It can be inferred that GEM concentrations at such sites show variations that are at least similar to those at Fukuoka and Oga, and the difference in daily mean values between Method A and Method B may be small. The stations with higher IQ and 0.05–0.95 ranges than Fukuoka were located in mountainous and urban areas, and especially in mountainous areas, relatively larger diurnal variations are expected to be caused by the influence of emission sources located at the foot of the mountain through daytime updrafts and nighttime downdrafts (Gay et al., 2013; Sprovieri et al., 2016). There is a possibility that the values obtained using Methods A and B may not agree with each other at such locations, and it is necessary to confirm the comparability between the methods through simultaneous observation.
CONCLUSION
The relative errors between the manual monitoring method based on active sampling in this study and the automatic active monitoring method (Tekran’s automatic speciated Hg monitoring system) widely used around the world, ranged from −19.6% to 20.3%. These values were less than ±30%, which is the criterion for duplicate measurements using the official Japanese method. Only 8 of the 226 data points deviated from the LOA range of the Bland–Altman analysis, and these discrepancies may be mainly due to extremely large and persistent concentration fluctuations when GEM is not measured by the Tekran system. Nevertheless, more than 96% of the data points showed good agreement between the two methods in both urban and rural areas. Overall, the atmospheric GEM concentration data obtained from the two methods were found to be comparable. In addition, this comparability has the potential to be valid at many stations worldwide and indicates that the use of a manual monitoring method based on active sampling allows for an effective monitoring network that is easier to establish and less expensive. Thus, the information obtained in this study can make a significant contribution to the Minamata Convention, which promotes worldwide atmospheric Hg monitoring and evaluates the convention’s effectiveness.
ACKNOWLEDGEMENTS
The atmospheric speciated Hg data at Oga station in Akita Prefecture used in this study were acquired from the “Background Monitoring Survey for Atmospheric Mercury and Other Metal Element Concentrations in Aerosols” conducted by the Ministry of the Environment, Japan. We would like to thank the anonymous reviewers for their constructive and helpful comments, which have improved our manuscript.
REFERENCES
- Bland, J.M., Altman, D.G., 1986. Statistical methods for assessing agreement between two methods of clinical measurement. Lanset 327, 307–310. doi: 10.1016/S0140-6736(86)90837-8.
- Choi, E.-M., Kim, S.-H., Holsen, T.M., Yi, S.-M., 2009. Total gaseous concentrations in mercury in Seoul, Korea: Local sources compared to long-range transport from China and Japan. Environ. Pollut. 157, 816–822. doi: 10.1016/j.envpol.2008.11.023.
- Eto, K., Marumoto, M., Takeya, M., 2010. The pathology of methylmercury poisoning (Minamata disease). Neuropathology 30, 471–479. doi: 10.1111/j.1440-1789.2010.01119.x.
- Fitzgerald, W.F., Engstrom, D.R., Mason, R.P., Nater, E.A., 1998. The case for atmospheric mercury contamination in remote areas. Environ. Sci. Technol. 32, 1–7. doi: 10.1021/es970284w.
- Fuse, G., 1961. Studies on the organo mercuric and tin compounds as the wood preservatives. II. On the relation between the chemical construction and their toxicity of the organo mercuric compounds against wood-decaying fungies. Wood Res.; Bull. Wood Res. Inst., Kyoto Univ. 26, 20–33. (in Japanese, the abstract is in English)
- Gay, D.A., Schmeltz, D., Prestbo, E., Olson, M., Sharac, T., Tordon, R., 2013. The Atmospheric Mercury Network: measurement and initial examination of an ongoing atmospheric mercury record across North America. Atmos. Chem. Phys. 13, 11339–11349. doi: 10.5194/acp-13-11339-2013.
- Hatakeyama, S., Takami, A., Sakamaki, F., Mukai, H., Sugimoto, N., Shimizu, A., 2004. Aerial measurement of air pollutants and aerosols during 20–22 March 2001 over the East China Sea. J. Geophys. Res. 109, D13304. doi: 10.1029/2003JD004271.
- Huang, J., Miller, M.B., Weiss-Penzias, P., Gustin, M.S., 2013. Comparison of gaseous oxidized Hg measured by KCl-coated denuders, and nylon and cation exchange membranes. Environ. Sci. Technol. 47, 7307–7316. doi: 10.1021/es4012349.
- Jaffe, D., Prestbo, E., Swartzendruber, P., Weiss-Penzias, P., Kato, S., Takami, A., Hatakeyama, S., Kaiji, Y., 2005. Export of atmospheric mercury from Asia. Atmos. Environ. 39, 3029–3038. doi: 10.1016/j.atmosenv.2005.01.030.
- Kotake, Y., Sato, N., 2009. Bland-Altman analysis for the accuracy evaluation of the cardiac output monitor. J. Jpn. Soc. Intensive Care Med. 16, 263–272. doi: 10.3918/jsicm.16.263. (in Japanese, the abstract is in English)
- Lyman, S.N., Jaffe, D.A., 2012. Formation and fate of oxidized mercury in the upper troposphere and lower stratosphere. Nat. Geosci. 5, 114–117. doi: 10.1038/ngeo1353.
- Marumoto, K., Hayashi, M., Takami, A., 2015. Atmospheric mercury concentrations at two sites in the Kyushu Islands, Japan, and evidence of long-range transport from East Asia. Atmos. Environ. 117, 147–155. doi: 10.1016/j.atmosenv.2015.07.019.
- Marumoto, K., Suzuki, N., Shibata, Y., Takeuchi, A., Takami, A., Fukuzaki, N., Kawamoto, K., Mizohata, A., Kato, S., Yamamoto, T., Chen, J., Hattori, T., Nagasaka, H., Saito, M., 2019. Long-term observation of atmospheric speciated mercury during 2007–2018 at Cape Hedo, Okinawa, Japan. Atmosphere 10, 362. doi: 10.3390/atmos10070362.
- McLagan, D.S., Mitchell, C.P.J., Steffen, A., Hung, H., Shin, C., Stupple, G.W., Olson, M.L., Luke, W.T., Kelley, P., Howard, D., Edwards, G.C., Nelson, P.E., Xiao, H., Sheu, G.-R., Dreyer, A., Huang, H., Abdul Hussain, B., Lei, Y.D., Tavshunsky, I., Wania, F., 2018. Global evaluation and calibration of a passive air sampler for gaseous mercury. Atmos. Chem. Phys. 18, 5905–5919. doi: 10.5194/acp-18-5905-2018.
- Ministry of the Environment, Japan, 2003. Future policy for measures of hazardous air pollutants (Seventh recommendation by the Central Environment Council). MOEJ, Tokyo, Japan. https://www.env.go.jp/council/toshin/t07-h1503.html (accessed 20 August 2023)(in Japanese)
- Ministry of the Environment, Japan, 2011. Manual Method of Hazardous Air Pollutants, Air Environmental Division of the Environmental Management Bureau for Water and Air Environmental Fields. MOEJ, Tokyo, Japan. https://www.env.go.jp/air/osen/manual2/ (accessed 20 August 2023)(in Japanese)
- Naja, M., Akimoto, H., 2004. Contribution of regional pollution and long-range transport to the Asia-Pacific region: Analysis of long-term ozone sonde data over Japan. J. Geophys. Res. 109, D21306. doi: 10.1029/2004JD004687.
- Schroeder, W.H., Munthe, J., 1998. Atmospheric mercury—An overview. Atmos. Environ. 32(5), 809–822. doi: 10.1016/S1352-2310(97)00293-8.
- Sheu, G.-R., Lin, N.-H., Wang, J.-L., Lee, C.-T., Yang, C.-F., Wang, S.-H., 2010. Temporal distribution and potential sources of atmospheric mercury measured at a high-elevation background station in Taiwan. Atmos. Environ. 44, 2393–2400. doi: 10.1016/j.atmosenv.2010.04.009.
- Slemr, F., Angot, H., Dommergue, A., Magand, O., Barret, M., Weigelt, A., Ebinghaus, R., Brunke, E.-G., Pfaffhuber, K.A., Edwards, G., Howand, D., Powell, J., Keywood, M., Wang, F., 2015. Comparison of mercury concentrations measured at several sites in the Southern Hemisphere. Atmos. Chem. Phys. 15, 3125–3133. doi: 10.5194/acp-15-3125-2015.
- Sprovieri, F., Pirrone, N., Ebinghaus, R., Kock, H., Dommergue, A., 2010. A review of worldwide atmospheric mercury measurements. Atmos. Chem. Phys. 10, 8245–8265. doi: 10.5194/acp-10-8245-2010.
- Sprovieri, F., Pirrone, N., Bencardino, M., D’Amore, F., Carbone, F., Cinnirella, S., Mannarino, V., Landis, M., Ebinghaus, R., Weigelt, A., Brunke, E.-G., Labuschagne, C., Martin, L., Munthe, J., Wängberg, I., Artaxo, P., Morais, F., Barbosa, H.D.M.J., Brito, J., Cairns, W., Barbante, C., Diéguez, M.D.C., Garcia, P.E., Dommergue, A., Angot, H., Magand, O., Skov, H., Horvat, M., Kotnik, J., Read, K.A., Neves, L.M., Gawlik, B.M., Sena, F., Mashyanov, N., Obolkin, V., Wip, D., Feng, X.B., Zhang, H., Fu, X., Ramachandran, R., Cossa, D., Knoery, J., Marusczak, N., Nerentorp, M., Norstrom, C., 2016. Atmospheric mercury concentrations observed at ground-based monitoring sites globally distributed in the framework of the GMOS network. Atmos. Chem. Phys. 16, 11915–11935. doi: 10.5194/acp-16-11915-2016.
- Takami, A., Miyoshi, T., Shimono, A., Hatakeyama, S., 2005. Chemical composition of fine aerosol measured by AMS at Fukue Island, Japan during APEX period. Atmos. Environ. 39, 4913–4924. doi: 10.1016/j.atmosenv.2005.04.038.
- Takami, A., Miyoshi, T., Irei, S., Yoshino, A., Sato, K., Shimizu, A., Hayashi, M., Hara, K., Kaneyasu, N., Hatakeyama, S., 2016. Analysis of Organic Aerosol in Fukuoka, Japan Using a PMF Method. Aero. Air Qual. Res. 16, 314–322. doi: 10.4209/aaqr.2015.03.0145.
- Tekran Inc., 2002. MODEL 2537A Mercury Vapor Analyzer User Manual. Tekran Inc., Toronto, ON, Canada.
- UNEP, 2002. Chemicals and Health Branch. “Global Mercury Assessment”, United Nations Environmental Programme. Geneva, Switzerland. https://www.unep.org/resources/report/global-mercury-assessment-2002-0 (accessed 21 August 2023)
- UNEP, 2019. Chemicals and Health Branch. “Global Mercury Assessment 2018”, United Nations Environmental Programme. Geneva, Switzerland. https://www.unep.org/globalmercurypartnership/resources/report/global-mercury-assessment-2018 (accessed 21 August 2023)
- Weiss-Penzias, P., Jaffe, D., McClintick, A., Prestbo, E.M., Landis, M.S., 2003. Gaseous elemental mercury in the marine boundary layer: Evidence for rapid removal in anthropogenic pollution. Environ. Sci. Technol. 37, 3755–3763. doi: 10.1021/es0341081.
- Yoshino, A., Takami, A., Hara, K., Nishita-Hara, C., Hayashi, M., Kaneyasu, N., 2021. Contribution of Local and Transboundary Air Pollution to the Urban Air Quality of Fukuoka, Japan. Atmosphere 12, 431. doi: 10.3390/atmos12040431.
- Yoshino, A., Takami, A., Shimizu, A., Sato, K., Hayakawa, K., Tang, N., Pham, K.-O., Hara, A., Nakamura, H., Odajima, H., 2022. Analysis of Chemical Components of Fine Particulate Matter Observed at Fukuoka, Japan, in Spring 2020 and Their Transport Paths. Appl. Sci. 12, 11400. doi: 10.3390/app122211400.

