Introduction
Current global ocean circulation was established during the Miocene and, in the North Pacific region, biological production by diatoms was enhanced at that time (Keller and Barron, 1983). The high productivity in this region led to the deposition of organic-rich siliceous sediments that became petroleum source rocks. On the Japan Sea coast, the Onnagawa and Teradomari formations were deposited in the Akita and Niigata basins, respectively, during the middle to late Miocene (Fig. 1). These formations consist of siliceous sediments and mudstone with high organic matter content, respectively (Waseda et al., 1995; Sampei et al., 2003). These formations are the source rocks for the oil and gas fields in these basins (Sampei et al., 2003), and thus have been extensively evaluated (e.g., Suzuki et al., 1995). To further elucidate the conditions for source rock formation, Akita Basin marine and sedimentary environments have also been studied (Tsuji et al., 1991; Tada, 1991, 1994, 1995; Yamamoto and Watanabe, 1994, 1995; Martizzi et al., 2020, 2021).
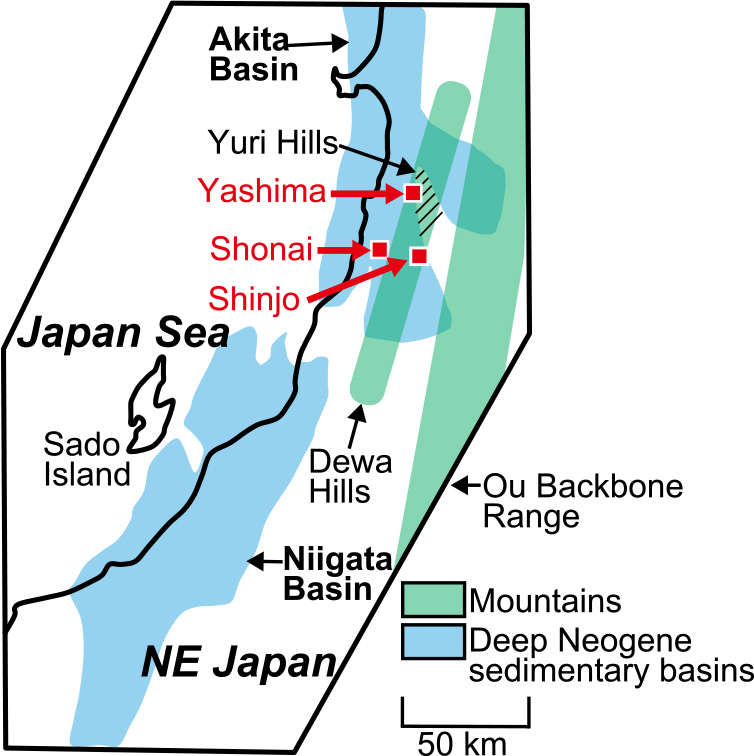
Changes in the marine environment affect primary productivity and organic matter preservation, which can influence the formation of petroleum source rocks (Tada, 1994, 1995; Yamamoto and Watanabe, 1995). Stein (1991) proposed two models for the formation of source rocks. The first is a productivity model in which high biological production in surface water promoted by upwelling results in the deposition of organic-rich sediments. The second is a stagnation model: circulation between surface and bottom waters stagnates, which leads to anoxic bottom water that enhances organic matter preservation. The Akita and Niigata basins are rift grabens that formed during the last stage of rifting (16.5–13.5 Ma) in the Japan Sea (Nakajima, 2018). During the post-rift period, these basins became troughs, and sediments comprising the Onnagawa and Teradomari formations were deposited (Nakajima, 2018). In the Yashima area (southwestern Akita Prefecture, Japan), most of the Onnagawa Formation is exposed and has been studied in detail in terms of sedimentology, paleontology and geochemistry. Bottom water conditions gradually shifted to anoxia from 12 to 10.5 Ma (Tsuji et al., 1991; Yamamoto and Watanabe, 1994, 1995), and subsequently became oxic from 9 to 5 Ma, coinciding with the Middle to Upper Onnagawa Formation, but primary production was high as a result of upwelling (Tsuji et al., 1991; Yamamoto and Watanabe, 1994, 1995; Yamamoto et al., 1999). Based on these previous studies (Yamamoto et al., 1999), paleoceanographic conditions during deposition of the Onnagawa Formation were interpreted to switch from a stagnation model in the lower to middle strata to a productivity model in the middle to upper strata.
However, the cause of the formation of stratified and anoxic bottom waters in the Akita Basin is not yet clear; why the source rock formation mechanism changed from a stagnation model to a production model is also unclear. To fully elucidate the source rock formation mechanism in the Akita Basin, it is necessary to also consider tectonics and paleogeography. Paleoceanographic reconstructions from organic biomarkers have only been produced for the Yashima and Shinjo areas (Taguchi et al., 1986; Yamamoto and Watanabe, 1995). Additionally, it is difficult to provide age constraints for the Onnagawa and Kusanagi formations using diatom biostratigraphy because the tests are generally affected by diagenesis (i.e., dissolution). Paleoenvironmental studies incorporating precise ages for the Onnagawa Formation have been reported only from outcrops in the Yashima area (Tsuji et al., 1991; Yamamoto and Watanabe, 1994, 1995; Yamamoto et al., 1999). Therefore, it is not clear if paleoenvironmental changes were simultaneous throughout the entire Akita Basin or differed locally. Accordingly, it is necessary to clarify the temporal and spatial distribution of the Akita Basin environments overall, which requires detailed age correlations between the Yashima and other Akita Basin areas.
The objective of this study was to describe the evolutionary history of the redox environment and primary production in the Akita Basin, and to determine the source rock formation mechanism(s) in the basin. We described regional paleoceanographic changes based on biomarker analysis of the Onnagawa Formation (Yashima area) in the central Akita Basin and the Kusanagi Formation (Shonai Plain, Yamagata Prefecture) in the southern part of the basin.
Materials and Methods
Geological setting and samples
The middle to late Miocene petroleum source rocks in the Akita Basin (Fig. 1) include the Onnagawa Formation (northern to central basin area) and the Kusanagi Formation (southern area). The central Akita Basin is divided into coastal and inland areas by the Yuri Hills, which were submerged (i.e., Yuri Bank) in the Miocene. The Yashima area is on the eastern margin of the coastal basin on the western side of the Yuri Hills. In Yamagata Prefecture, the Akita Basin intrudes inland. The eastern margin of the Shonai Plain was originally located close to the center of the sedimentary basin. Thrust faults formed between the Dewa Hills and the Shonai Plain through uplift of the Dewa Hills that began in the Pliocene (5 Ma; Moriya et al., 2008). As a result of this uplift, the Kusanagi Formation was exposed on the eastern margin of the Shonai Plain.
In this study, samples from the Onnagawa Formation were collected along the Koyoshi River (Fig. 2a), an area that was studied previously (Tsuji et al., 1991; Yamamoto and Watanabe, 1994, 1995; Yamamoto et al., 1999). The outcrop lithology along the Jinego River, the lowest part of the Koyoshi River route, is mudstone with glauconite and corresponds to unit C in Tsuji et al. (1991). In the Koyoshi River route of the Onnagawa Formation, the lower and upper strata correspond to units B and A, respectively, in Tsuji et al. (1991). These strata consist of alternations of hard and soft mudstone, with the upper strata also containing massive soft mudstone with shells. Tsuji et al. (1991) and Yamamoto et al. (1999) identified the entire Koyoshi River route as the Onnagawa Formation based on radiolarian biochronology (12.1–8.4 Ma). However, Takahashi et al. (2020a) reconsidered this chronostratigraphy and dated the base of unit B at 12.6 ± 0.5 Ma and the lower part of unit A at 10.2 ± 0.6 Ma. According to these new age constraints, the lowermost unit of the Onnagawa Formation (unit C) would be older than 12.3 Ma (Japanese Association for Petroleum Technology, 2014). Thus, unit C corresponds to the Nishikurosawa Stage (Takahashi et al., 2020a) because it shows characteristics of the upper Nishikurosawa Formation, including abundant glauconite (Yanagisawa and Watanabe, 2017). Furthermore, units B and A can be correlated with the Lower and Middle Onnagawa Formation, respectively. Therefore, the materials in this study were assigned, in ascending order, to the Nishikurosawa Stage, lower Onnagawa Formation, and middle Onnagawa Formation (Fig. 2a). We collected three samples dating from the Nishikurosawa Stage, six samples from the Lower Onnagawa Formation, and four samples from the Middle Onnagawa Formation (Fig. 2a). We also collected samples of the alternating hard and soft mudstones from each stratigraphic interval.
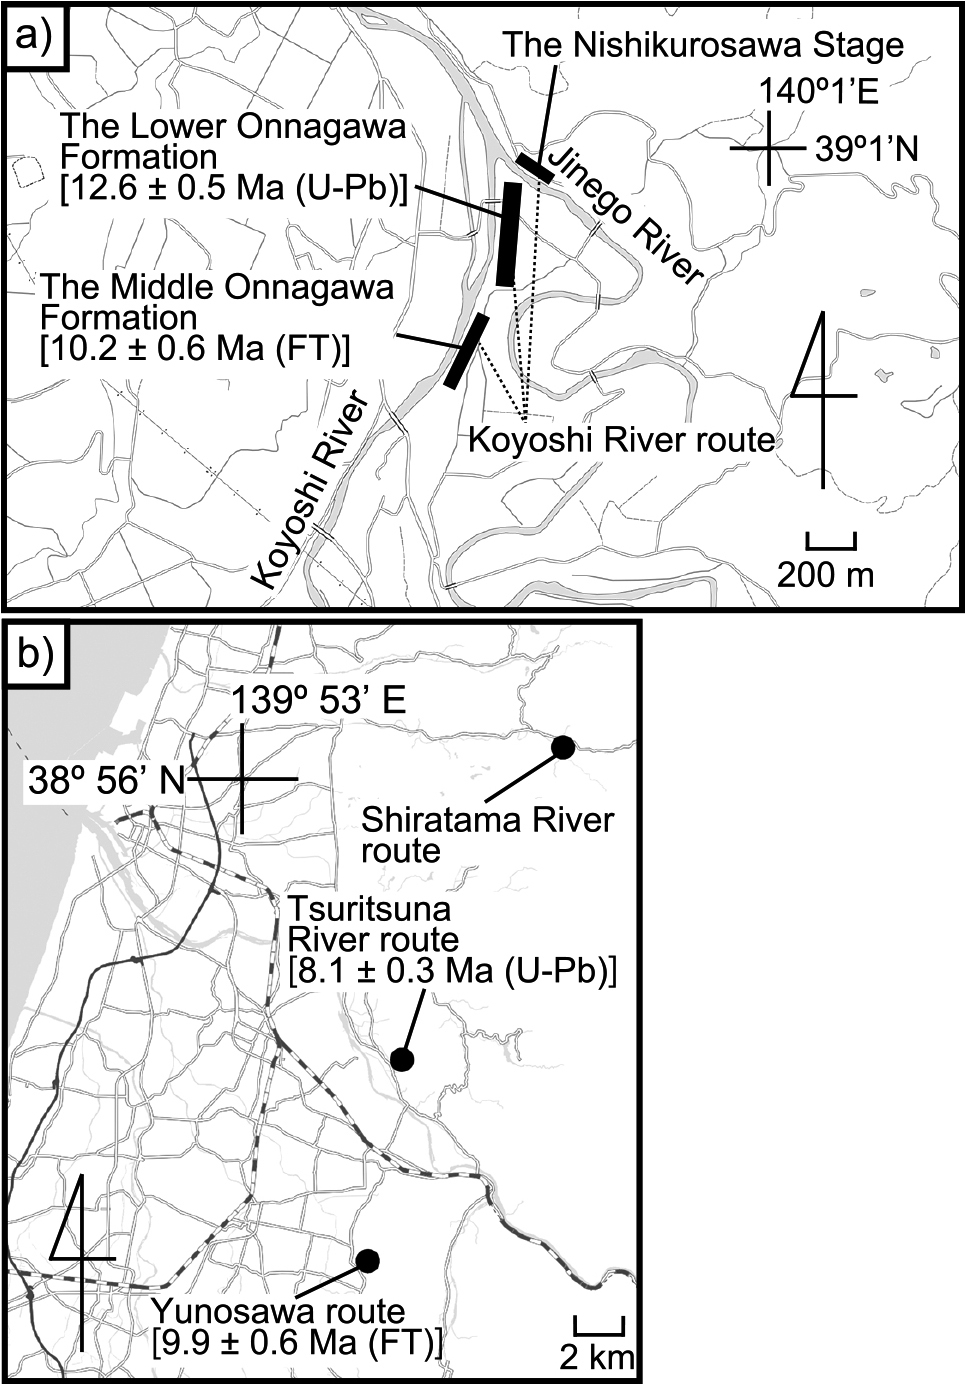
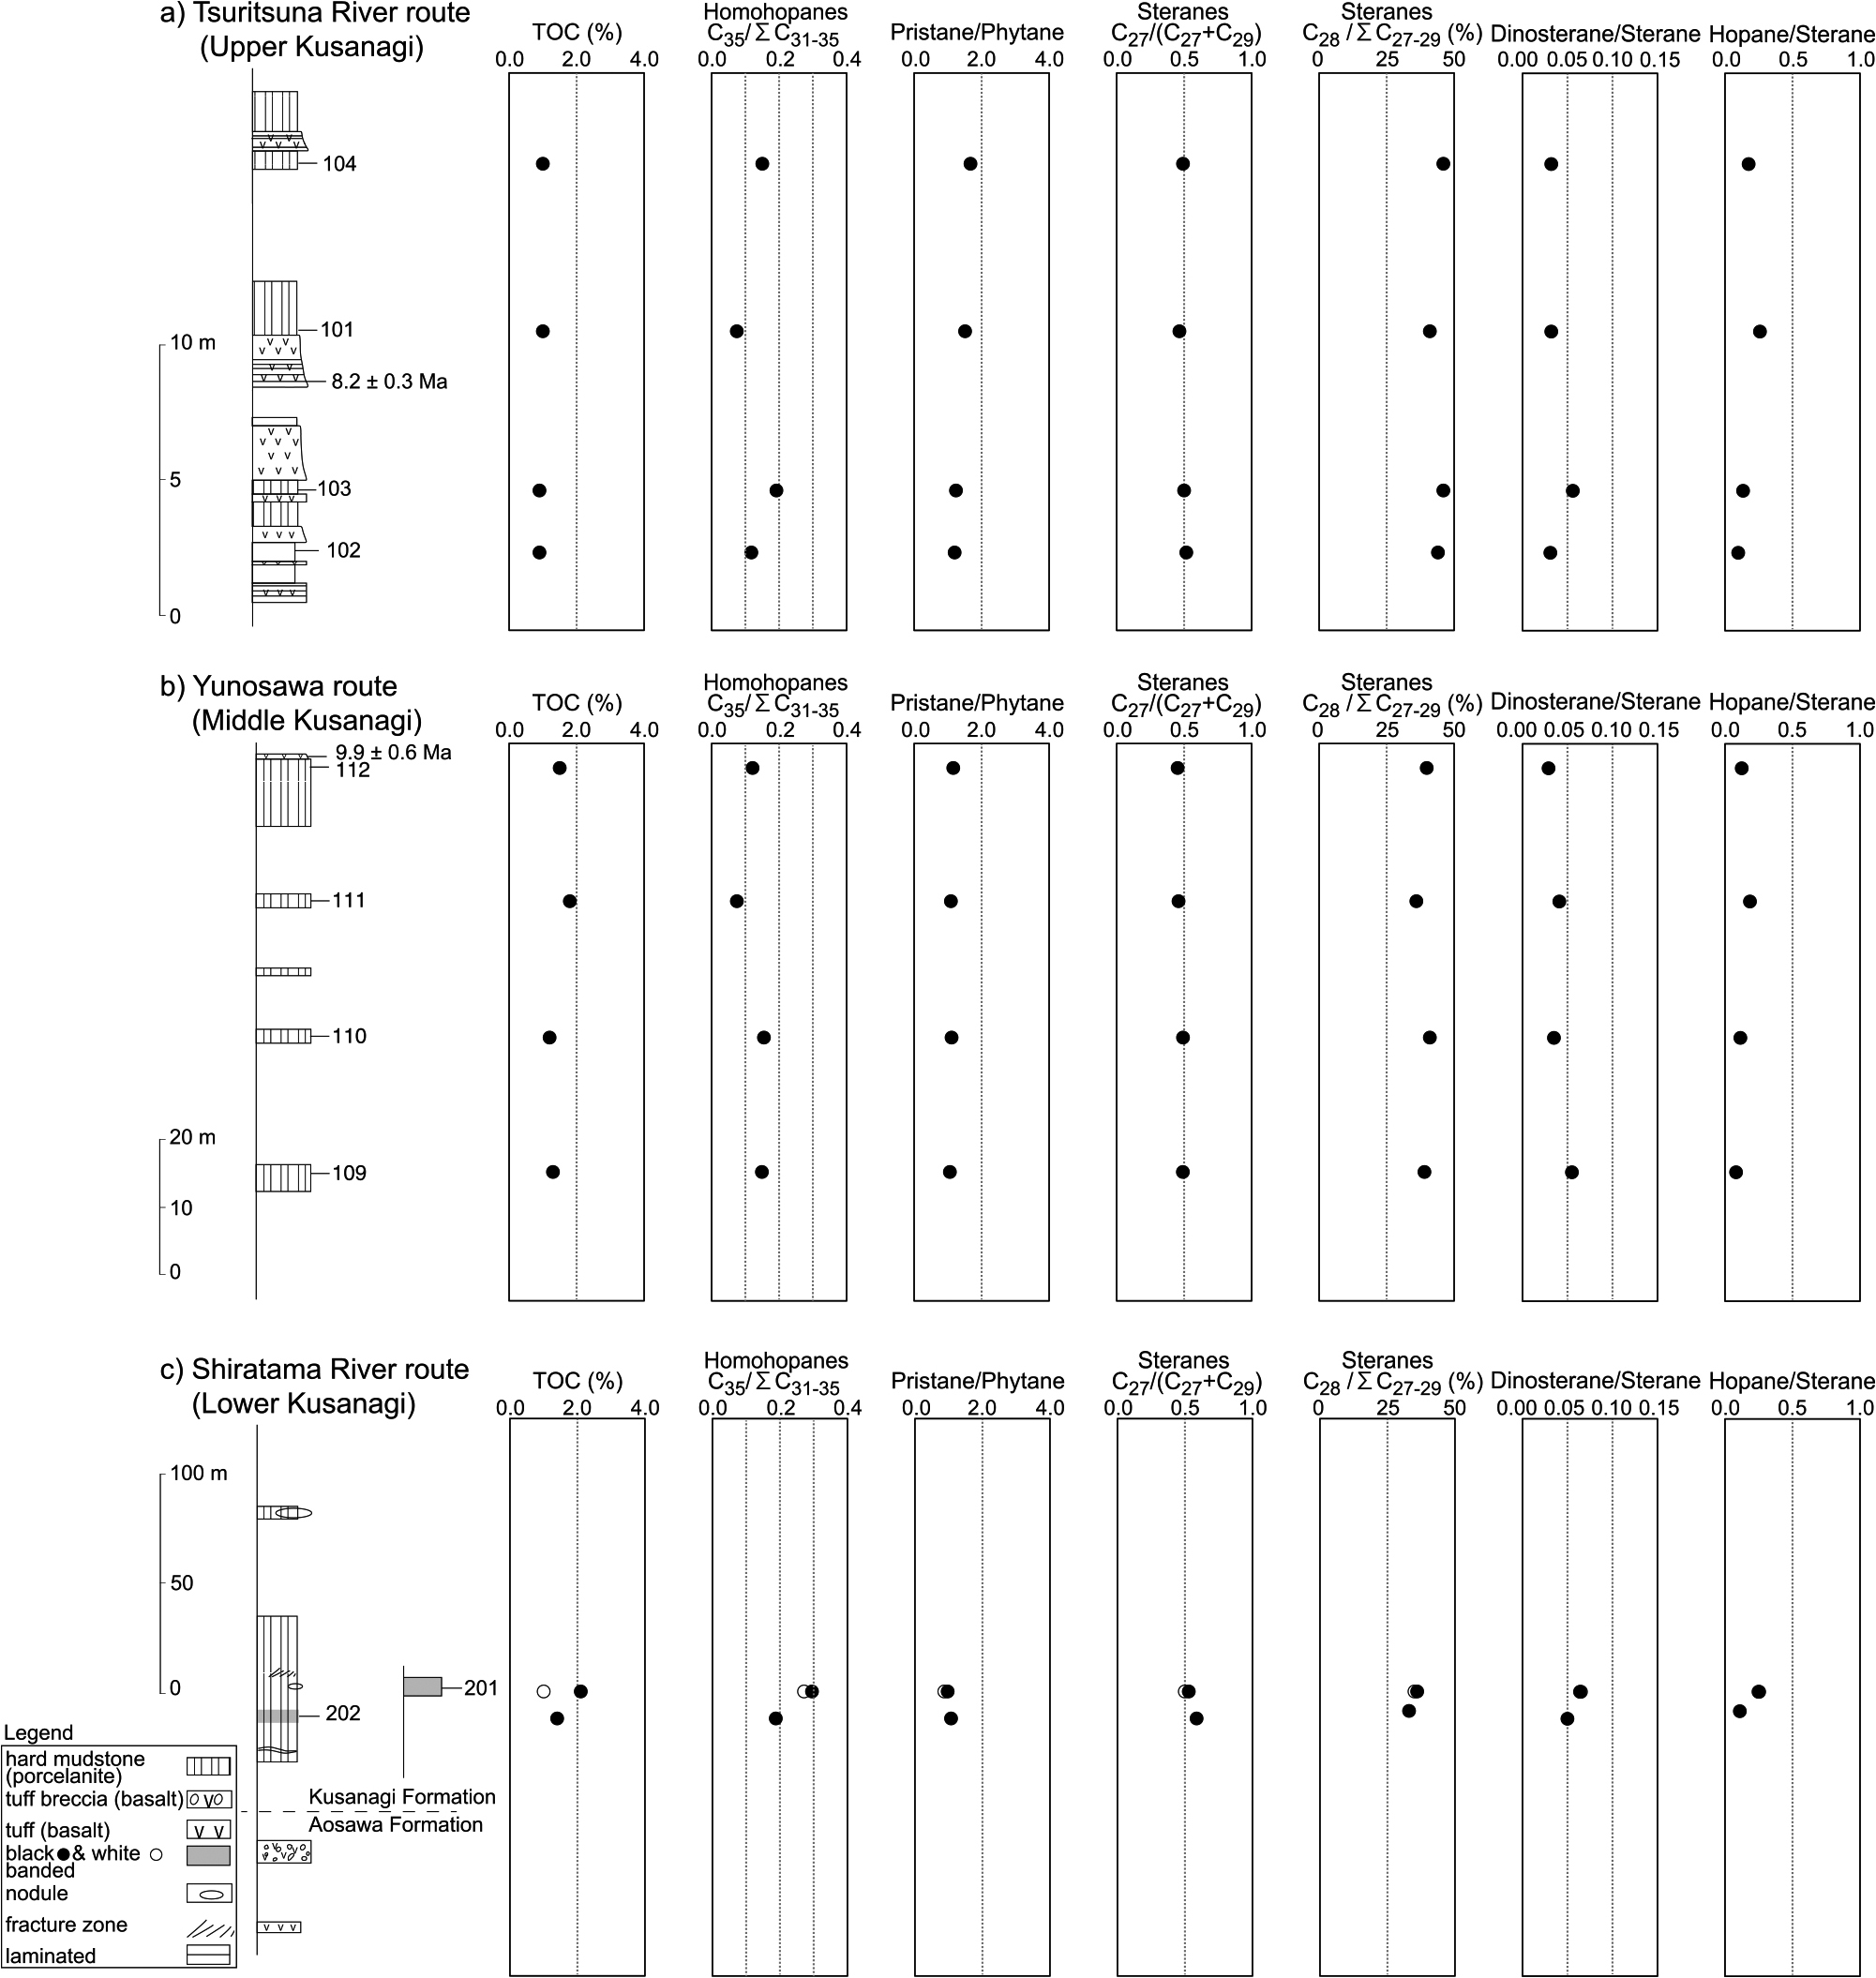
Kusanagi Formation samples were collected along the Shiratama and Tsuritsuna rivers and near Yunosawa (Fig. 2b; Takahashi et al., 2020a), which represent exposure areas along thrust faults. In the Shiratama River route, hard mudstone overlies Aosawa Formation basalt that has been correlated with the Nishikurosawa Stage. Black and white bands and nodules were observed in the Kusanagi Formation in some areas of the Shiratama River route. The Shiratama River route is correlated with the Lower Kusanagi Formation because it directly overlies the Aosawa Formation. Here, mudstones were collected from two sites, including black and white banded mudstones at one site. The top of the Kusanagi Formation at Yunosawa has been dated at 9.9 ± 0.6 Ma (Takahashi et al., 2020a), and is correlated with the Middle Kusanagi Formation. Four samples were collected from the hard mudstone along this route. The Kusanagi Formation along the Tsuritsuna River consists of alternating hard and soft mudstone, intercalated with several tuff layers. This route is correlated with the Upper Kusanagi Formation because a tuff layer within it has been dated at 8.2 ± 0.3 Ma (Takahashi et al., 2020a). Here, we collected three samples from hard mudstone and one sample from soft mudstone.
Sample preparation
Each powdered sample (10 g) was extracted sequentially with methanol/dichloromethane (3:1, v/v, 30 mL), methanol/dichloromethane (1:1, v/v, 30 mL), and dichloromethane (30 mL) by sonication (0°C, 15 min), after which the extracts were combined. The concentrated extracts were separated chromatographically along a silica gel (Kanto Chemical Silicagel 60N, 63–210 μm, 1 g) column (150 mm × 6 mm i.d.) by elution with n-hexane (6 mL) to isolate the aliphatic fraction. This fraction was analyzed using gas chromatography-mass spectrometry (GC-MS).
GC-MS (7890B-5977B MSD, Agilent, Tokyo, Japan) was performed using a fused silica DB-5 column (30 m × 0.25 mm i.d., 0.25 μm film thickness, Agilent) with helium as the carrier gas at 0.7 mL/min. The oven temperature was increased from 40°C (5.0 min) to 310°C (hold for 10 min) at 4°C/min. Total organic carbon (TOC) analysis was performed at the JAPEX Technical Research Institute; and the detailed procedure is described in Takahashi et al. (2020b).
Results and Discussion
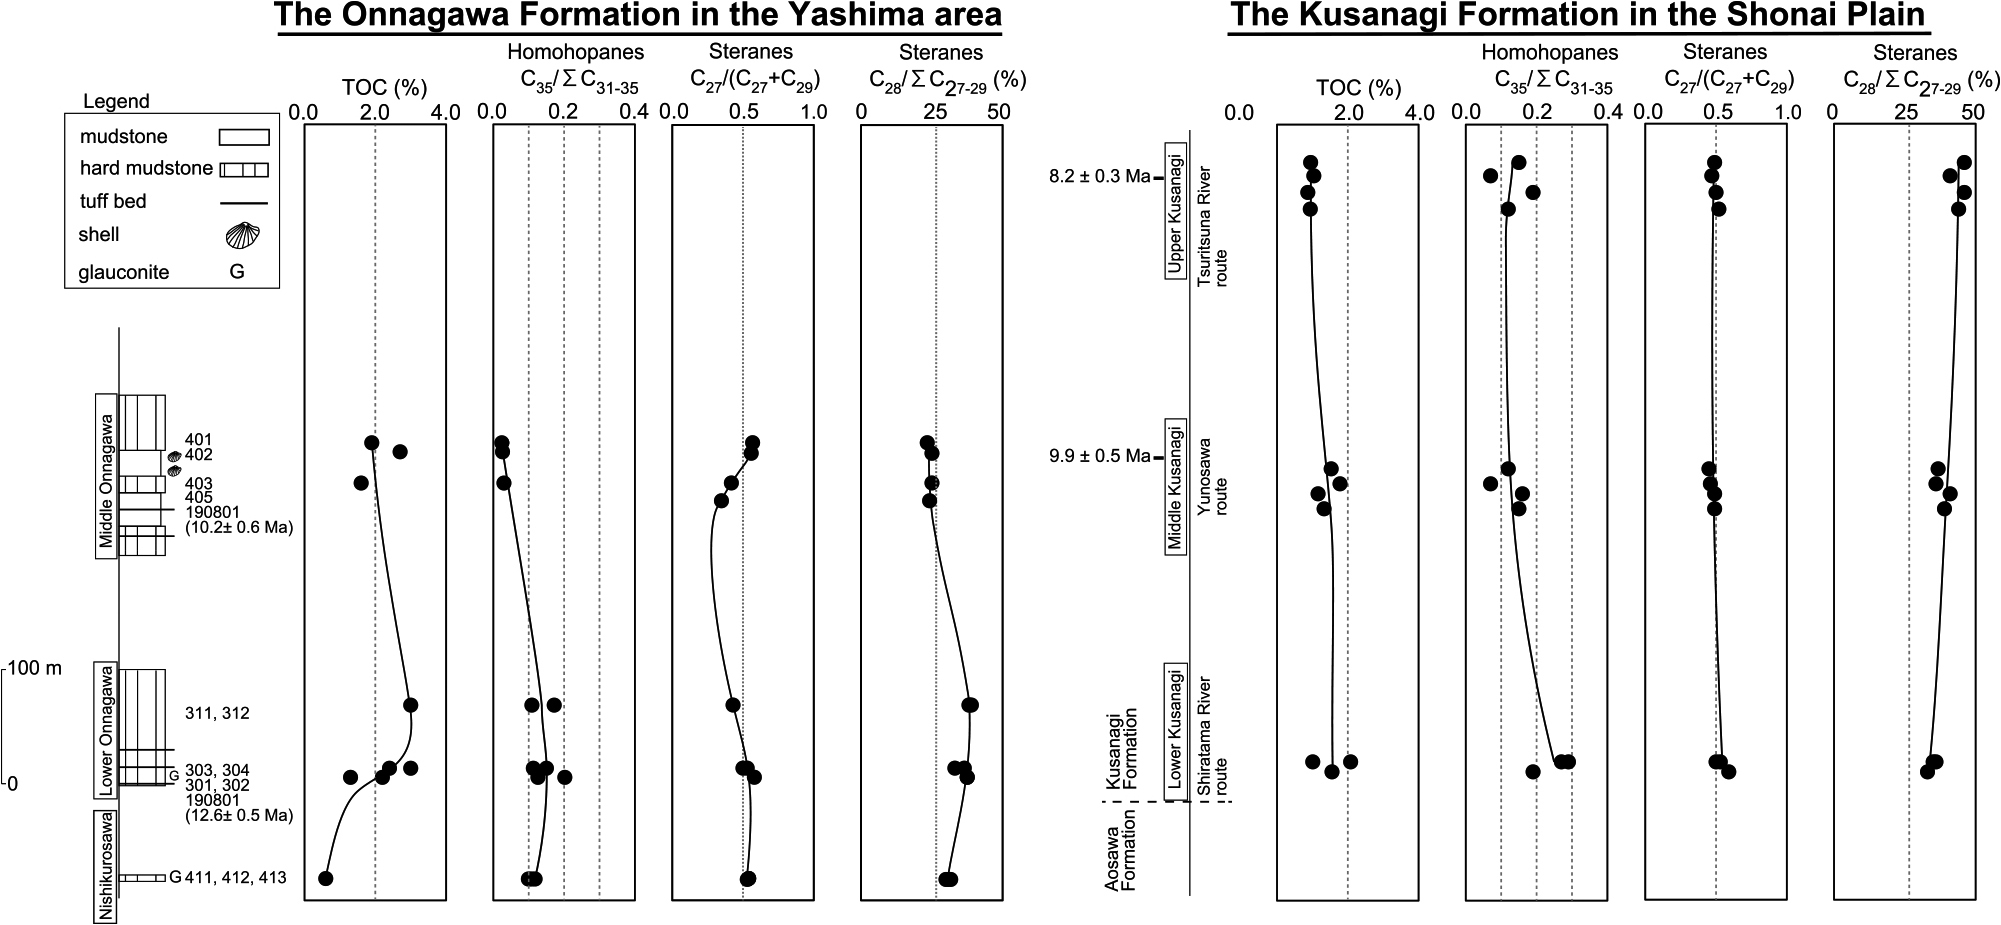
The analytical data for the samples are listed in Table 1. The total ion current (TIC) chromatogram, as well as m/z 217 sterane, m/z 231 dinosterane and m/z 191 hopane mass fragments of representative samples, are shown in Fig. 3. Stratigraphic variations in TOC, the C27/C27 + C29 sterane ratio, proportions (%) of C28 steranes to C27–29 steranes and C35 homohopanes to C31–35 homohopanes, as well as the pristane/phytane (Pr/Ph) ratio are plotted for the Yashima area (Fig. 4) and the Shonai Plain (Fig. 5).
Table 1.
Sedimentary geochemical data from the Onnagawa and Kusanagi formations.
| No. |
Formation |
Area |
Route |
TOC (%) |
Pr/Phy |
Regular steranes |
Homohopane index
C35/ΣC31–35 |
Dinosterane/Sterane |
Hopane/Sterane |
| 20S/(20S + 20R) C29 |
C27/(C27 + C28) |
C28/ΣC27–29 (%) |
| 401 |
Middle Onnagawa |
Yashima |
Koyoshi River |
1.87 |
0.58 |
0.03 |
0.65 |
32.7 |
0.02 |
0.06 |
0.08 |
| 402 |
Middle Onnagawa |
Yashima |
Koyoshi River |
2.67 |
0.65 |
0.02 |
0.64 |
34.8 |
0.03 |
0.04 |
0.03 |
| 403 |
Middle Onnagawa |
Yashima |
Koyoshi River |
1.57 |
1.19 |
0.04 |
0.50 |
35.1 |
0.03 |
0.03 |
0.13 |
| 405 |
Middle Onnagawa |
Yashima |
Koyoshi River |
0.25 |
1.22 |
0.03 |
0.43 |
34.2 |
0.03 |
0.04 |
0.12 |
| 311 |
Lower Onnagawa |
Yashima |
Koyoshi River |
2.98 |
0.96 |
0.04 |
0.45 |
51.3 |
0.17 |
0.06 |
0.14 |
| 312 |
Lower Onnagawa |
Yashima |
Koyoshi River |
3.02 |
0.96 |
0.03 |
0.50 |
50.0 |
0.11 |
0.02 |
0.12 |
| 301 |
Lower Onnagawa |
Yashima |
Koyoshi River |
1.32 |
1.84 |
0.04 |
0.59 |
44.7 |
0.13 |
0.06 |
0.17 |
| 302 |
Lower Onnagawa |
Yashima |
Koyoshi River |
2.19 |
1.92 |
0.04 |
0.58 |
44.6 |
0.20 |
0.07 |
0.16 |
| 303 |
Lower Onnagawa |
Yashima |
Koyoshi River |
2.43 |
1.38 |
0.03 |
0.60 |
43.7 |
0.15 |
0.05 |
0.12 |
| 304 |
Lower Onnagawa |
Yashima |
Koyoshi River |
2.96 |
1.30 |
0.03 |
0.57 |
47.7 |
0.11 |
0.05 |
0.12 |
| 411 |
Nishikurosawa Stage |
Yashima |
Jinego River |
0.58 |
2.71 |
0.05 |
0.54 |
36.1 |
0.12 |
0.11 |
0.34 |
| 412 |
Nishikurosawa Stage |
Yashima |
Jinego River |
0.60 |
2.05 |
0.06 |
0.54 |
37.5 |
0.10 |
0.11 |
0.33 |
| 413 |
Nishikurosawa Stage |
Yashima |
Jinego River |
0.63 |
2.34 |
0.05 |
0.53 |
37.0 |
0.11 |
0.12 |
0.37 |
| 101 |
Upper Kusanagi |
Shonai |
Tsuritsuna River |
1.04 |
1.51 |
0.03 |
0.49 |
41.2 |
0.07 |
0.03 |
0.21 |
| 102 |
Upper Kusanagi |
Shonai |
Tsuritsuna River |
0.87 |
1.20 |
0.03 |
0.54 |
43.6 |
0.12 |
0.03 |
0.10 |
| 103 |
Upper Kusanagi |
Shonai |
Tsuritsuna River |
0.94 |
1.24 |
0.03 |
0.50 |
46.4 |
0.19 |
0.06 |
0.09 |
| 104 |
Upper Kusanagi |
Shonai |
Tsuritsuna River |
0.95 |
1.67 |
0.04 |
0.51 |
46.0 |
0.15 |
0.03 |
0.13 |
| 109 |
Middle Kusanagi |
Shonai |
Yunosawa |
1.33 |
1.06 |
0.02 |
0.53 |
38.6 |
0.15 |
0.06 |
0.08 |
| 110 |
Middle Kusanagi |
Shonai |
Yunosawa |
1.16 |
1.11 |
0.02 |
0.53 |
41.4 |
0.16 |
0.04 |
0.11 |
| 111 |
Middle Kusanagi |
Shonai |
Yunosawa |
1.78 |
1.09 |
0.02 |
0.46 |
36.1 |
0.07 |
0.04 |
0.19 |
| 112 |
Middle Kusanagi |
Shonai |
Yunosawa |
1.53 |
1.16 |
0.02 |
0.49 |
37.5 |
0.12 |
0.03 |
0.12 |
| 201 |
Lower Kusanagi |
Shonai |
Shiratama River |
2.08 |
0.97 |
0.05 |
0.55 |
35.6 |
0.29 |
0.06 |
0.25 |
| 201-2 |
Lower Kusanagi |
Shonai |
Shiratama River |
1.01 |
0.87 |
0.06 |
0.56 |
35.2 |
0.27 |
0.07 |
0.25 |
| 202 |
Lower Kusanagi |
Shonai |
Shiratama River |
1.42 |
1.07 |
0.03 |
0.57 |
32.8 |
0.19 |
0.05 |
0.11 |
Note: TOC = total organic carbon; Pr/Ph = pristane/phytane

Fig. 3.
Total ion current (TIC) chromatogram and mass fragment chromatograms of steranes (m/z 217), dinosterane (m/z 231) and hopanes (m/z 191) in the saturated hydrocarbon fraction of a representative sample (No. 311) from the Onnagawa Formation. Peaks in mass fragments were identified as: a: 5β,14α,17α,-24-norcholestane 20R (C26); b: 5α,14α,17α,-24-norcholestane 20R (C26); c: 5β,14α,17α-cholestane 20R (C27); d: 13β,17α-diastigmastane 20S; e: 5α,14α,17α-cholestane 20R (C27); f: 13β,17α-diastigmastane 20S; g: 5α,14α,17α-ergostane 20S (C28); h: 5β,14α,17α-ergostane 20R (C28); i: 5α,14α,17α-ergostane 20R (C28); j: 5α,14α,17α-stigmastane 20S (C29); k: 5β,14α,17α-stigmastane 20R (C29); l: 5α,14α,17α-stigmastane 20R (C29); m: 5α,14α,17α-propyl-cholestane 20S (C30); n: 5α,14α,17α-propyl-cholestane 20R (C30); o: 4α, 23S, 24S-trimethyl cholestane 20R; p: 4α, 23S, 24R-trimethyl cholestane 20R; q: 4α, 23R, 24R-trimethyl cholestane 20R; r: 4α, 23R, 24S-trimethyl cholestane 20R; 1: 17α,21β-homohopane 22S (C31); 2: 17α,21β-homohopane 22R (C31); 3: 17α,21β-bishomohopane 22S (C32); 4: 17α,21β-bishomohopane 22R (C32); 5: 17α,21β-trishomohopane 22S (C33); 6: 17α,21β-trishomohopane 22R (C33); 7: 17α,21β-tetrakishomohopane 22S (C34); 8: 17α,21β-tetrakishomohopane 22R (C34); 9: 17α,21β-pentakishomohopane 22S (C35); 10: 17α,21β-pentakishomohopane 22R (C35).
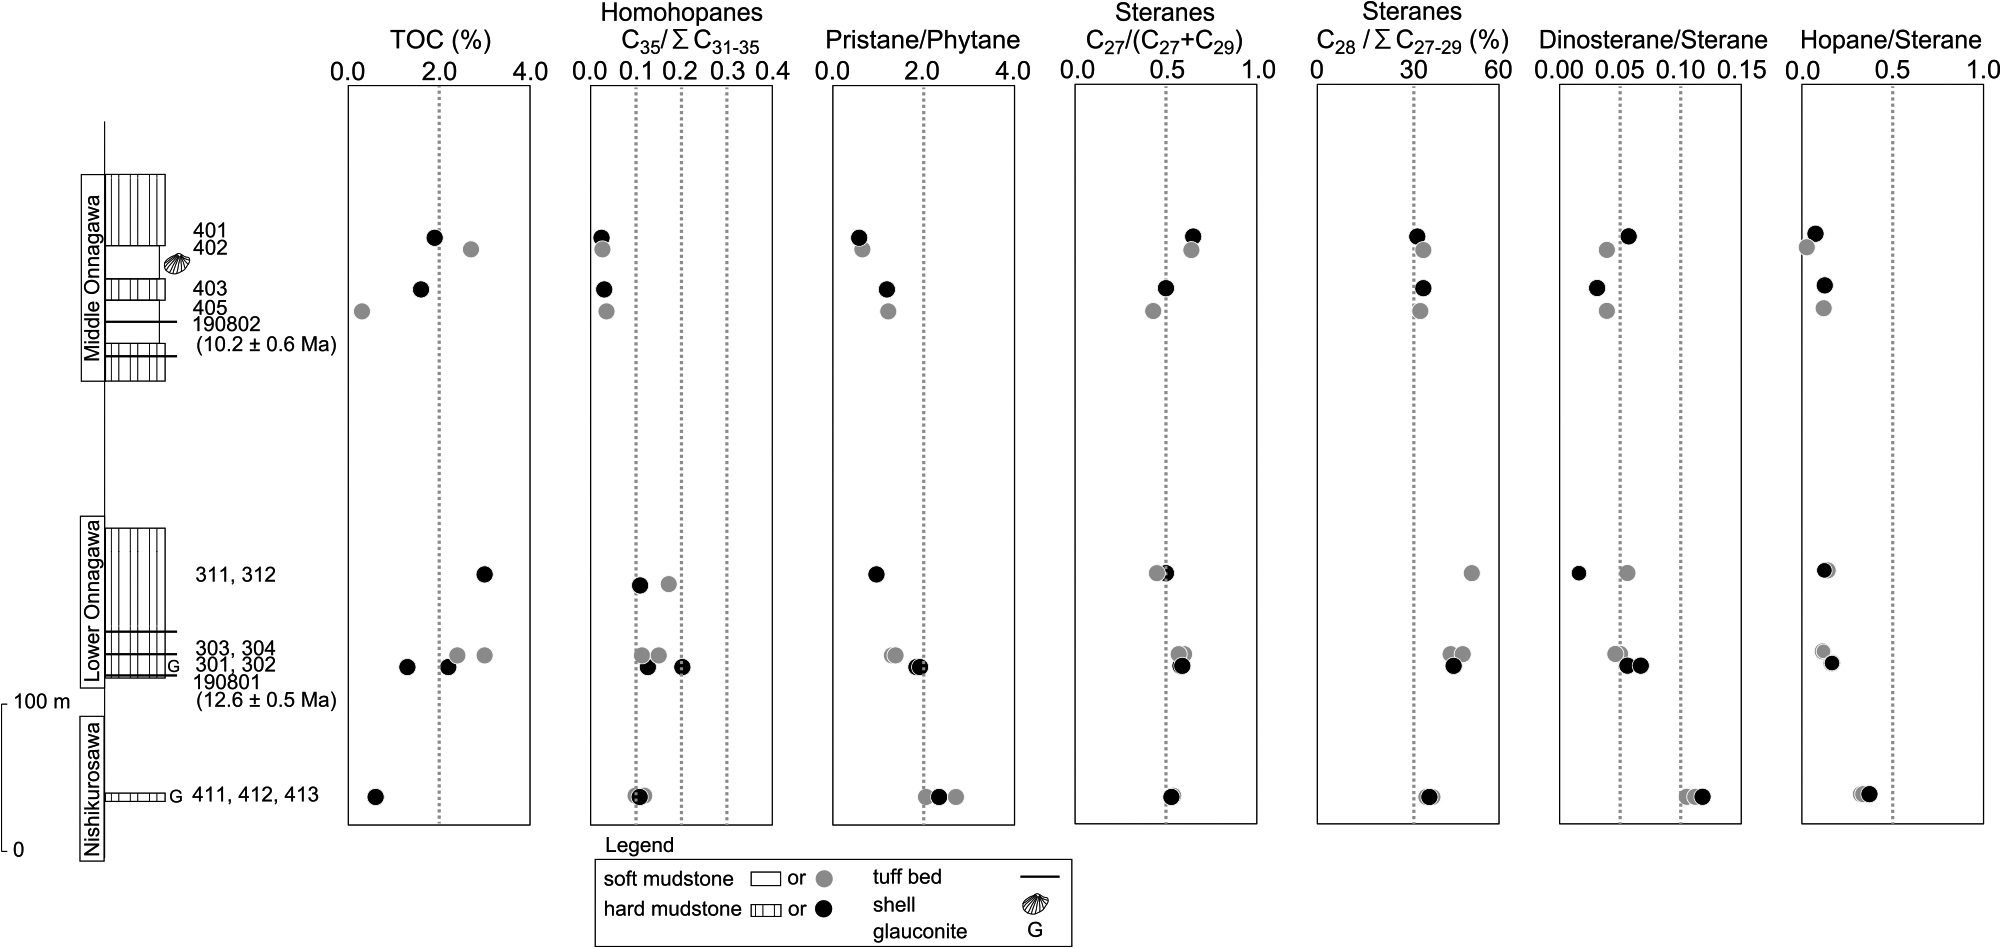
The TOC content in the Yashima area was generally 1.3%–3.0% (Table 1, Fig. 4), except for four samples from the Nishikurosawa Stage (No. 411–413; 0.58%–0.63%) and in the Middle Onnagawa Formation (No. 405; 0.25%). Bioturbation was visually identified in No. 405, so we attribute its low organic matter content to biodegradation. The TOC of the Nishikurosawa Stage averaged 0.6%, lower than that in the Onnagawa Formation (Table 1). Previous studies also reported that the TOC values of unit C, correlated with our Nishikurosawa Stage, were lower than those of units B and A in the Onnagawa Formation (Tsuji et al., 1991; Yamamoto and Watanabe, 1994; Yamamoto et al., 1999). Furthermore, an analysis of core samples from the Yurihara oil and gas field close to the Yashima area showed that the TOC of the Nishikurosawa Formation was lower than that of the Onnagawa Formation (Waseda and Omokawa, 1990). Yamamoto and Watanabe (1994) reported that the TOC values of the Funakawa and Tentokuji formations that overlie the Onnagawa Formation were 0.66%–0.98%, again lower than that of the Onnagawa Formation.
The hard mudstone of the Onnagawa Formation corresponds to porcellanite in Tsuji et al. (1991), and the soft mudstone corresponds to siliceous or dark shale (Tsuji et al., 1991). Waseda et al. (1995) reported that the TOC values of the siliceous shale were higher than that of porcellanite. In this study, the soft mudstone TOC was higher than that of the hard mudstone at the same stratigraphic levels in the Onnagawa Formation (Fig. 4). Our result is consistent with the TOC values reported in Tsuji et al. (1991) and Waseda et al. (1995). As other biomarker proxies are almost the same in both the hard and soft mudstones (Fig. 4), both types of mudstone probably had the same original depositional environment. The difference in TOC may be attributed to diagenetic silica migration from soft to hard mudstones, which resulted in concentration of TOC in the soft mudstone (Suzuki, 2021). In contrast, TOC values in the Nishikurosawa Stage did not markedly differ between the soft and hard mudstones (Fig. 4, No. 411–413).
Thermal maturity of the Onnagawa Formation
We used a ratio based on the epimerization of C29 steranes (20S/(20S + 20R)) as a thermal maturity indicator (Mackenzie et al., 1980; Taguchi et al., 1986; Yamamoto and Watanabe, 1994). The 20S/(20S + 20R) ratio was 0.02–0.06 (Table 1), indicating thermal immaturity (Suzuki et al., 1987). The Onnagawa Formation is located on the eastern margin of the Nikaho sub-basin (Kumada et al., 2018), which is a sedimentary basin that hosts thermally mature rocks in its center. Therefore, it is likely that the immature sedimentary rocks in the Yashima area can be attributed to low subsidence and shallow burial.
Organic matter source of the Onnagawa Formation
The C27/C27 + C29 sterane ratio is a proxy for the relative inputs of algae and higher plants (e.g., Huang and Meinshein, 1979). A relatively high C27/C27 + C29 sterane ratio indicates that algae were dominant; a relatively low value indicates that terrestrial higher plants dominated. The C27/C27 + C29 sterane ratio in the Yashima area was 0.4–0.6 (Table 1, Fig. 4). The ratio exhibited a relatively slight upward increase in the Middle Onnagawa Formation. Yamamoto and Watanabe (1994, 1995) and Yamamoto et al. (1999) reported relatively high ratios from the Middle Onnagawa to the Lower Funakawa Formations. The slight increase in the C27/C27 + C29 sterane ratio of the Middle Onnagawa Formation in this study may represent the initial part of this increase. Thus, algal input was high during deposition of the Middle Onnagawa to Lower Funakawa Formations.
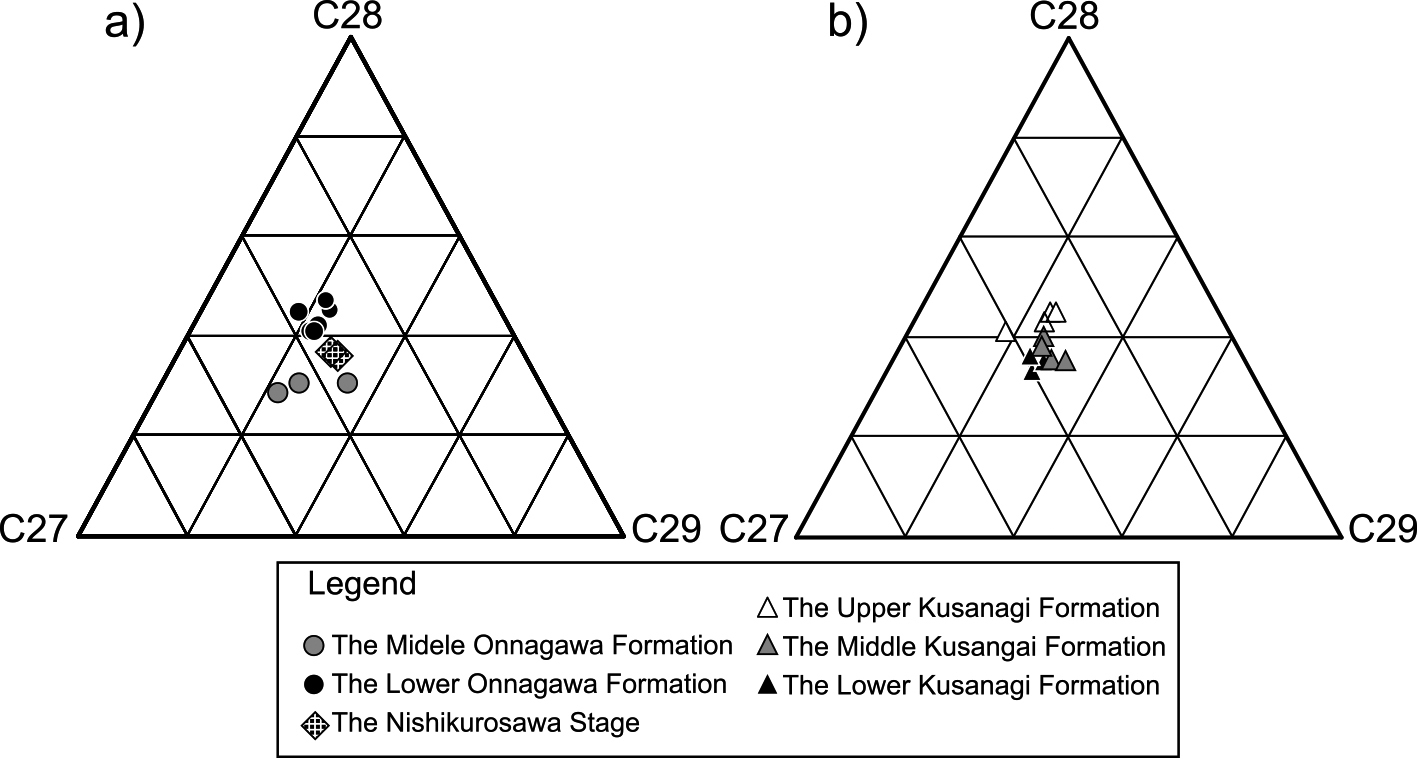
C28 steranes are generally derived from sterols produced by certain diatoms (Volkman, 1986). The relative abundance of C28 steranes increased from the Nishikurosawa Stage to the Lower Onnagawa Formation, and then decreased from the Lower to Middle Onnagawa Formation (Fig. 4). Previous studies also reported a high abundance of C28 steranes in the Lower Onnagawa Formation (Yamamoto and Watanabe, 1994, 1995). These results suggest that the diatom contribution to sediment was relatively high in the Lower Onnagawa Formation. Ternary diagrams of C27–29 steranes are commonly used to distinguish the dominant organic contribution (e.g., marine algae or terrestrial plants) in a source rock. The Onnagawa Formation samples generally plotted in the area for marine organic matter (Fig. 6a). In the Lower Onnagawa Formation C28 steranes were dominant; in the Middle Onnagawa Formation, C27 steranes dominated. The sterane composition of the Nishikurosawa Stage was intermediate and plotted between the Lower and Middle Onnagawa Formation. These results are essentially consistent with previous studies (Tsuji et al., 1991; Waseda et al., 1995).
The biogenic silica content in the Onnagawa Formation was higher than previously determined for the Funakawa and Tentokuji formations, but the aluminum oxide content of the Funakawa and Tentokuji formations was higher than that of the Onnagawa Formation (Yamamoto and Watanabe, 1994, 1995). The Onnagawa Formation had a relatively low contribution from terrestrial organic matter (Fig. 4), because debris was trapped by the adjacent Yuri Hills (Fig. 1), and so the total organic matter was not diluted by terrigenous input during deposition. In contrast, nutrients such as nitrate and phosphate supplied from land were transported to the Yashima area as plumes regardless of the presence of the Yuri Hills. Moreover, abundant dissolved silica, which is essential for diatom blooming, was supplied from the nutrient-rich Northern Pacific Intermediate Water, which intruded into the Japan Sea from the northern strait (Yamamoto et al., 1999). This input of silica is thought to be one factor that affected the formation of the organic-rich siliceous shale during the Onnagawa Stage.
The values of dinosterane/sterane were relatively high in the Nishikurosawa Stage (~13 Ma), and had decreased by 12 Ma, at the base of the Onnagawa Stage (Fig. 4). These results indicate that dinoflagellates were abundant at 13–12 Ma and diatoms became dominant after 12 Ma. Yamamoto et al. (1999) placed this transition at 10.5 Ma; however, herein we revise the age of the transition to 12 Ma, based on the results of new radiometric dating (Fig. 4 and Takahashi et al., 2020a).
Depositional environment of the Onnagawa Formation
The homohopane index (C35/ΣC31–35 homohopane ratio; Peters and Moldowan, 1991), which is a redox indicator for depositional environments, showed a wide range (0.02–0.20; Table 1, Fig. 4). In an oxidizing environment, the homohopane index is less than 0.1 (Peters and Moldowan, 1991). The index in the Nishikurosawa Stage (0.10–0.12) was slightly lower than that of the Lower Onnagawa Formation (0.11–0.20); there was then a gradual decrease from the Lower to the Middle Onnagawa Formation (0.02–0.03; Fig. 4). This result means that sediments of the Lower Onnagawa Formation were deposited in a relatively reducing environment, followed by a shift towards more oxidizing environments by the Middle Onnagawa Formation. These changes in depositional environment are consistent with the findings of Yamamoto and Watanabe (1994, 1995) and Yamamoto et al. (1999).
The ratio between pristane and phytane, which are derived from phytol in chlorophyll, has been used as a redox proxy because diagenesis affects these chemicals differently depending on the depositional environment (Didyk et al., 1978). High Pr/Ph indicates an oxidizing environment, whereas a low ratio indicates a reducing environment (Peters and Moldowan, 1991). Overall, Pr/Ph ratios are high in the Nishikurosawa Stage and then decrease up to the Middle Onnagawa Formation (Table 1, Fig. 4). Specifically, the Pr/Ph ratio decreases as the homohopane index increases from the Nishikurosawa Stage to the Lower Onnagawa Formation. Because the Pr/Ph decrease indicates a change to reducing conditions in the bottom water, this trend is consistent with our interpretation based on the homohopane index. However, the decrease in Pr/Ph from the Lower to Middle Onnagawa Formation contradicts our conclusions based on the homohopane index. The Pr/Ph results are also inconsistent with the presence of shells in the Middle Onnagawa Formation massive mudstone, as this is fairly clear evidence of sufficient bottom water oxygen to support benthic organisms (Fig. 4). In addition, Yamamoto and Watanabe (1994, 1995) concluded that deposition of the Middle Onnagawa Formation occurred in an oxidizing environment. This difference probably reflects changes in the organic matter source. Pristane can also be produced from α-tocopherol (e.g., Rontani et al., 2010), a compound that is relatively abundant in higher plants, so the relative amount of pristane tends to be higher in sediments rich in terrestrial organic matter (Rise et al., 1989; Schultz, 1990). In the Lower to Middle Onnagawa Formation, our results showed that the proportion of organic matter derived from algae increased up-strata with increasing biological productivity (see above; Fig. 4). This change could explain the decrease in Pr/Ph in the Middle Onnagawa Formation because if a notable proportion of pristane originated from α-tocopherol, the ratio would decrease owing to a lesser proportion of terrestrial input; the apparent conflict with the homohopane index could also be explained in this way.
The hopane/sterane ratio was high (0.33–0.37) in the Nishikurosawa Stage, but was low (0.03–0.17) in the Onnagawa Formation (Table 1). This difference may have resulted from an abundance of aerobic bacteria in the Nishikurosawa Stage because of the oxic seafloor and from an abundance of diatoms during deposition of the Onnagawa Formation (Yamamoto et al., 1999).
Changes in primary production and depositional environment in the Onnagawa Formation
We found that the TOC in the Nishikurosawa Stage was lower than in the Onnagawa Formation (Fig. 4). Based on the high abundance of dinosteranes, C30 steranes derived from dinoflagellates, and C28 steranes derived from diatoms, Yamamoto and Watanabe (1994) suggested that diatoms and dinoflagellates were the major primary producers during the Nishikurosawa Stage. This suggestion indicates that primary productivity in the Nishikurosawa Stage was not necessarily low.
Pr/Ph of the Nishikurosawa Stage was higher than that of the Lower Onnagawa Formation, even though the C27/C27 + C29 sterane ratio was constant (Fig. 4). The homohopane index of the Nishikurosawa Stage was slightly lower than that of the Lower Onnagawa Formation (Fig. 4). These results, the high hopane/sterane ratio and the high bioturbation degree (Yamamoto and Watanabe, 1994, 1995), together indicate that the Nishikurosawa Stage experienced more oxic bottom water conditions than did the Early Onnagawa Stage. Nakajima (2018) reported that the Japan Sea was an oxidizing environment unsuitable for the preservation of organic matter during the Nishikurosawa Stage, prior to 12.3 Ma Therefore, we suggest that the TOC in the Nishikurosawa Stage sediments was low because of higher organic matter degradation as a result of the oxidizing depositional environment.
The TOC in the Lower Onnagawa Formation was higher than in the Nishikurosawa Stage. The Pr/Ph and homohopane index indicate that the Lower Onnagawa Formation was deposited under more reducing conditions than those in the Nishikurosawa Stage (Fig. 4). The better organic matter preservation in the Early Onnagawa Stage, indicated by higher TOC, is a result of the lack of bottom water oxygen as supported by the preservation of lamination (Yamamoto and Watanabe, 1994, 1995).
The relative abundance of C28 steranes in the Lower Onnagawa Formation was the highest in all the Yashima area strata (Fig. 4). These results support higher primary production by diatoms during deposition of the Lower Onnagawa Formation than during the Nishikurosawa Stage. The high TOC values in the Lower Onnagawa Formation were attributed to a reducing environment as well as high primary productivity.
The Lower Onnagawa Formation was deposited during the period when the Japan Sea changed from an open to semi-closed marginal sea owing to uplift of the Ou Mountains (~12 Ma; Nakajima, 2018). As a result of this basin restriction, the Japan Sea is thought to have changed to a reducing environment. Kozaka et al. (2018) showed that the seawater inflow from the Pacific Ocean to the Japan Sea around 10 Ma was primarily from the Oyashio Current and the North Pacific Deep Water, which is anoxic and nutrient-rich. As part of this change, the inflow of warm surface currents from the Pacific Ocean into the Japan Sea decreased, while the inflow of nutrient-rich water through the northern straits increased. These oceanographic changes likely caused changes in diatom-dominated primary production, which led to a suitable depositional environment for organic matter preservation and, ultimately, siliceous shale formation.
The TOC of the Middle Onnagawa Formation was slightly lower than that of the Lower Onnagawa Formation (Table 1, Fig. 4), and the relatively low homohopane indexes suggest an oxidizing environment. The presence of shells in the Middle Onnagawa Formation also indicates that this unit was deposited under oxic conditions (Fig. 4). The C27/C27 + C29 sterane ratio of the Middle Onnagawa Formation was higher than those of the Nishikurosawa Stage and the Lower Onnagawa Formation (Table 1, Fig. 4). This increasing trend in the C27/C27 + C29 sterane ratio from the bottom to the top of the Onnagawa Formation was also reported in Yamamoto and Watanabe (1994, 1995). Yamamoto et al. (1999) also reported that the amount of biogenic silica was high from the Lower Onnagawa Formation to the Funakawa Formation. The aluminum oxide content of the Onnagawa Formation was generally constant (Yamamoto and Watanabe, 1994, 1995), indicating that a constant supply of terrestrial organic matter. The increase in C27 steranes (Fig. 4) can be attributed to an increase in primary production associated with increased diatom abundance and/or decreased supply of terrestrial organic matter. Therefore, we suggest that C27 steranes increased owing to increased primary production. Our results suggest that upwelling was the probable cause of the increase in primary production. Yamamoto et al. (1999) also demonstrated that primary production increased as a result of upwelling during deposition of the Middle Onnagawa Formation, and that TOC was high despite the oxidizing environment.
Kusanagi Formation TOC
The TOC for the Kusanagi Formation on the Shonai Plain was 0.9%–2.1% (Table 1, Fig. 5), slightly higher than the reported TOC values of 0.5%–1.5% for the Kusanagi Formation in the Shinjo area (Taguchi et al., 1986). The TOC of the Upper Kusanagi Formation was lower than those of the Lower and Middle Kusanagi Formation. Similarly, the TOC of the Kusanagi Formation in the Shinjo area showed a decreasing upward trend, but some Upper Kusanagi Formation samples showed anomalously high TOC (Taguchi et al., 1986). Black (No. 201) and white (No. 201-2) banding was sampled in the Lower Kusanagi Formation along the Shiratama River; TOC in the black bands was twice as high (2.1%) as that in the white bands (1.0%; Table 1). The difference in TOC can be attributed to diagenetic silica migration (Suzuki, 2021) from black to white bands because the other biomarker proxies are almost the same (Fig. 5c).
Thermal maturity of Kusanagi Formation organic matter
The 20S/20S + 20R ratio of C29 steranes was 0.02–0.06 (Table 1), indicating that the thermal maturity of the Kusanagi Formation is similar to that of the Onnagawa Formation. Furthermore, Taguchi et al. (1986) reported that the maximum 20S/20S + 20R ratio of the Kusanagi Formation in the Shinjo area was 0.55, much higher than that of the Shonai Plain. The Shinjo area experienced subsidence until the Quaternary (Moriya et al., 2008); as a result, the Kusanagi Formation there is deeply buried. In contrast, the eastern margin of the Shonai Plain was uplifted and eroded by the uplift of the Dewa Hills during the Pliocene (Moriya et al., 2008) and by subsequent thrust fault activity. These differences in the regional tectonic setting explain why the thermal maturity of sediments in the Shonai Plain is lower than that in the Shinjo area.
Organic matter source in the Kusanagi Formation
The low dinosterane/sterane ratio in the Kusanagi Formation (0.03–0.06) indicates that algae were the dominant primary producers throughout the formation (Fig. 4, Table 1). The C27/C27 + C29 sterane ratio was generally ~0.5, suggesting a constant contribution from higher plants and algae (Table 1, Fig. 5). The relative abundance of C28 steranes slightly increased from the Lower to Upper Kusanagi Formation (Table 1, Fig. 5), indicating that certain diatoms in the Upper Kusanagi Formation were more abundant than those in the Lower Kusanagi Formation. The sterane ternary diagram for the Kusanagi Formation showed a similar composition to the Onnagawa Formation (Fig. 6). However, there was less stratigraphic variation within the Kusanagi Formation than in the Onnagawa Formation.
Depositional environment of the Kusanagi Formation
The Kusanagi Formation homohopane index was 0.07–0.29, indicating a dysoxic environment (Table 1, Fig. 5). The Upper Kusanagi Formation was deposited under more oxidizing conditions than the Lower Kusanagi Formation. Overall, the index shows that the Middle to Upper Kusanagi Formation experienced a more reducing depositional environment than the Middle Onnagawa Formation (Table 1, Figs. 4, 5). The Pr/Ph ratio of the Kusanagi Formation was 0.87–1.67 (Table 1, Fig. 5) and gradually increased from the Lower to the Upper Kusanagi Formation. The Pr/Ph results were consistent with the homohopane index. Our results suggest that the Upper Kusanagi Formation was more oxic than the lower part of the formation. In the Shinjo area, Pr/Ph of the Lower Kusanagi Formation was relatively low, whereas the values of the Upper Kusanagi Formation and upward into the Furukuchi Formation were relatively high (Suzuki and Taguchi, 1982). The Lower Kusanagi Formation was interpreted to represent deposition under more reducing conditions than the Upper Kusanagi Formation (Suzuki and Taguchi, 1982). The hopane/sterane ratio in the Kusanagi Formation was relatively low (0.08–0.25), indicating that the activity of aerobic bacteria was depressed because of anoxic conditions (Fig. 4, Table 1).
Changes in primary production and depositional environment in the Kusanagi Formation
Based on the homohopane index and Pr/Ph results, the Lower Kusanagi Formation appears to have hosted the most reducing conditions during deposition of the entire formation on the Shonai Plain and in the Shinjo area (Suzuki and Taguchi, 1982). The TOC of the Lower Kusanagi Formation was higher than that of the Upper Kusanagi Formation because organic matter preservation was enhanced by the reducing depositional environment. In contrast, deposition of the Middle and Upper Kusanagi Formation took place under more oxidizing conditions. However, it may be more accurate to state that deposition of the Upper Kusanagi Formation occurred under dysoxic conditions because the homohopane index was generally >0.10 (except for No. 101). The relative abundance of C28 steranes increased from the Middle to the Upper Kusanagi Formation, suggesting that the relative contribution of certain diatoms to organic matter increased (Figs. 5, 6).
The TOC at the Shonai Plain eastern margin decreased from the Lower to Upper Kusanagi Formation. This decreasing TOC trend is consistent with the redox indices for the depositional environment. The TOC of the Kusanagi Formation in the Shinjo area showed the same trend. However, some Upper Kusanagi Formation samples exhibited high TOC values (Taguchi et al., 1986). The Shinjo area is located on the western margin of the Yuri Hills (Fig. 1). Therefore, primary production may have been higher during deposition of the Upper Kusanagi Formation as a consequence of upwelling.
Reconstruction of sedimentary environmental changes in the Akita Basin
A summary of the analytical results for the Onnagawa and Kusanagi formations and a schematic illustration showing paleoceanographic changes in the Akita Basin are shown in Figs. 7 and 8. In the Yashima area, the Nishikurosawa Stage (13 Ma; Japanese Association for Petroleum Technology, 2014) was dominated by marine organic matter produced by both dinoflagellates and diatoms. Thus, primary production was not low; however, the oxidizing seafloor environment promoted decomposition of organic matter (Fig. 7, 8b-4).
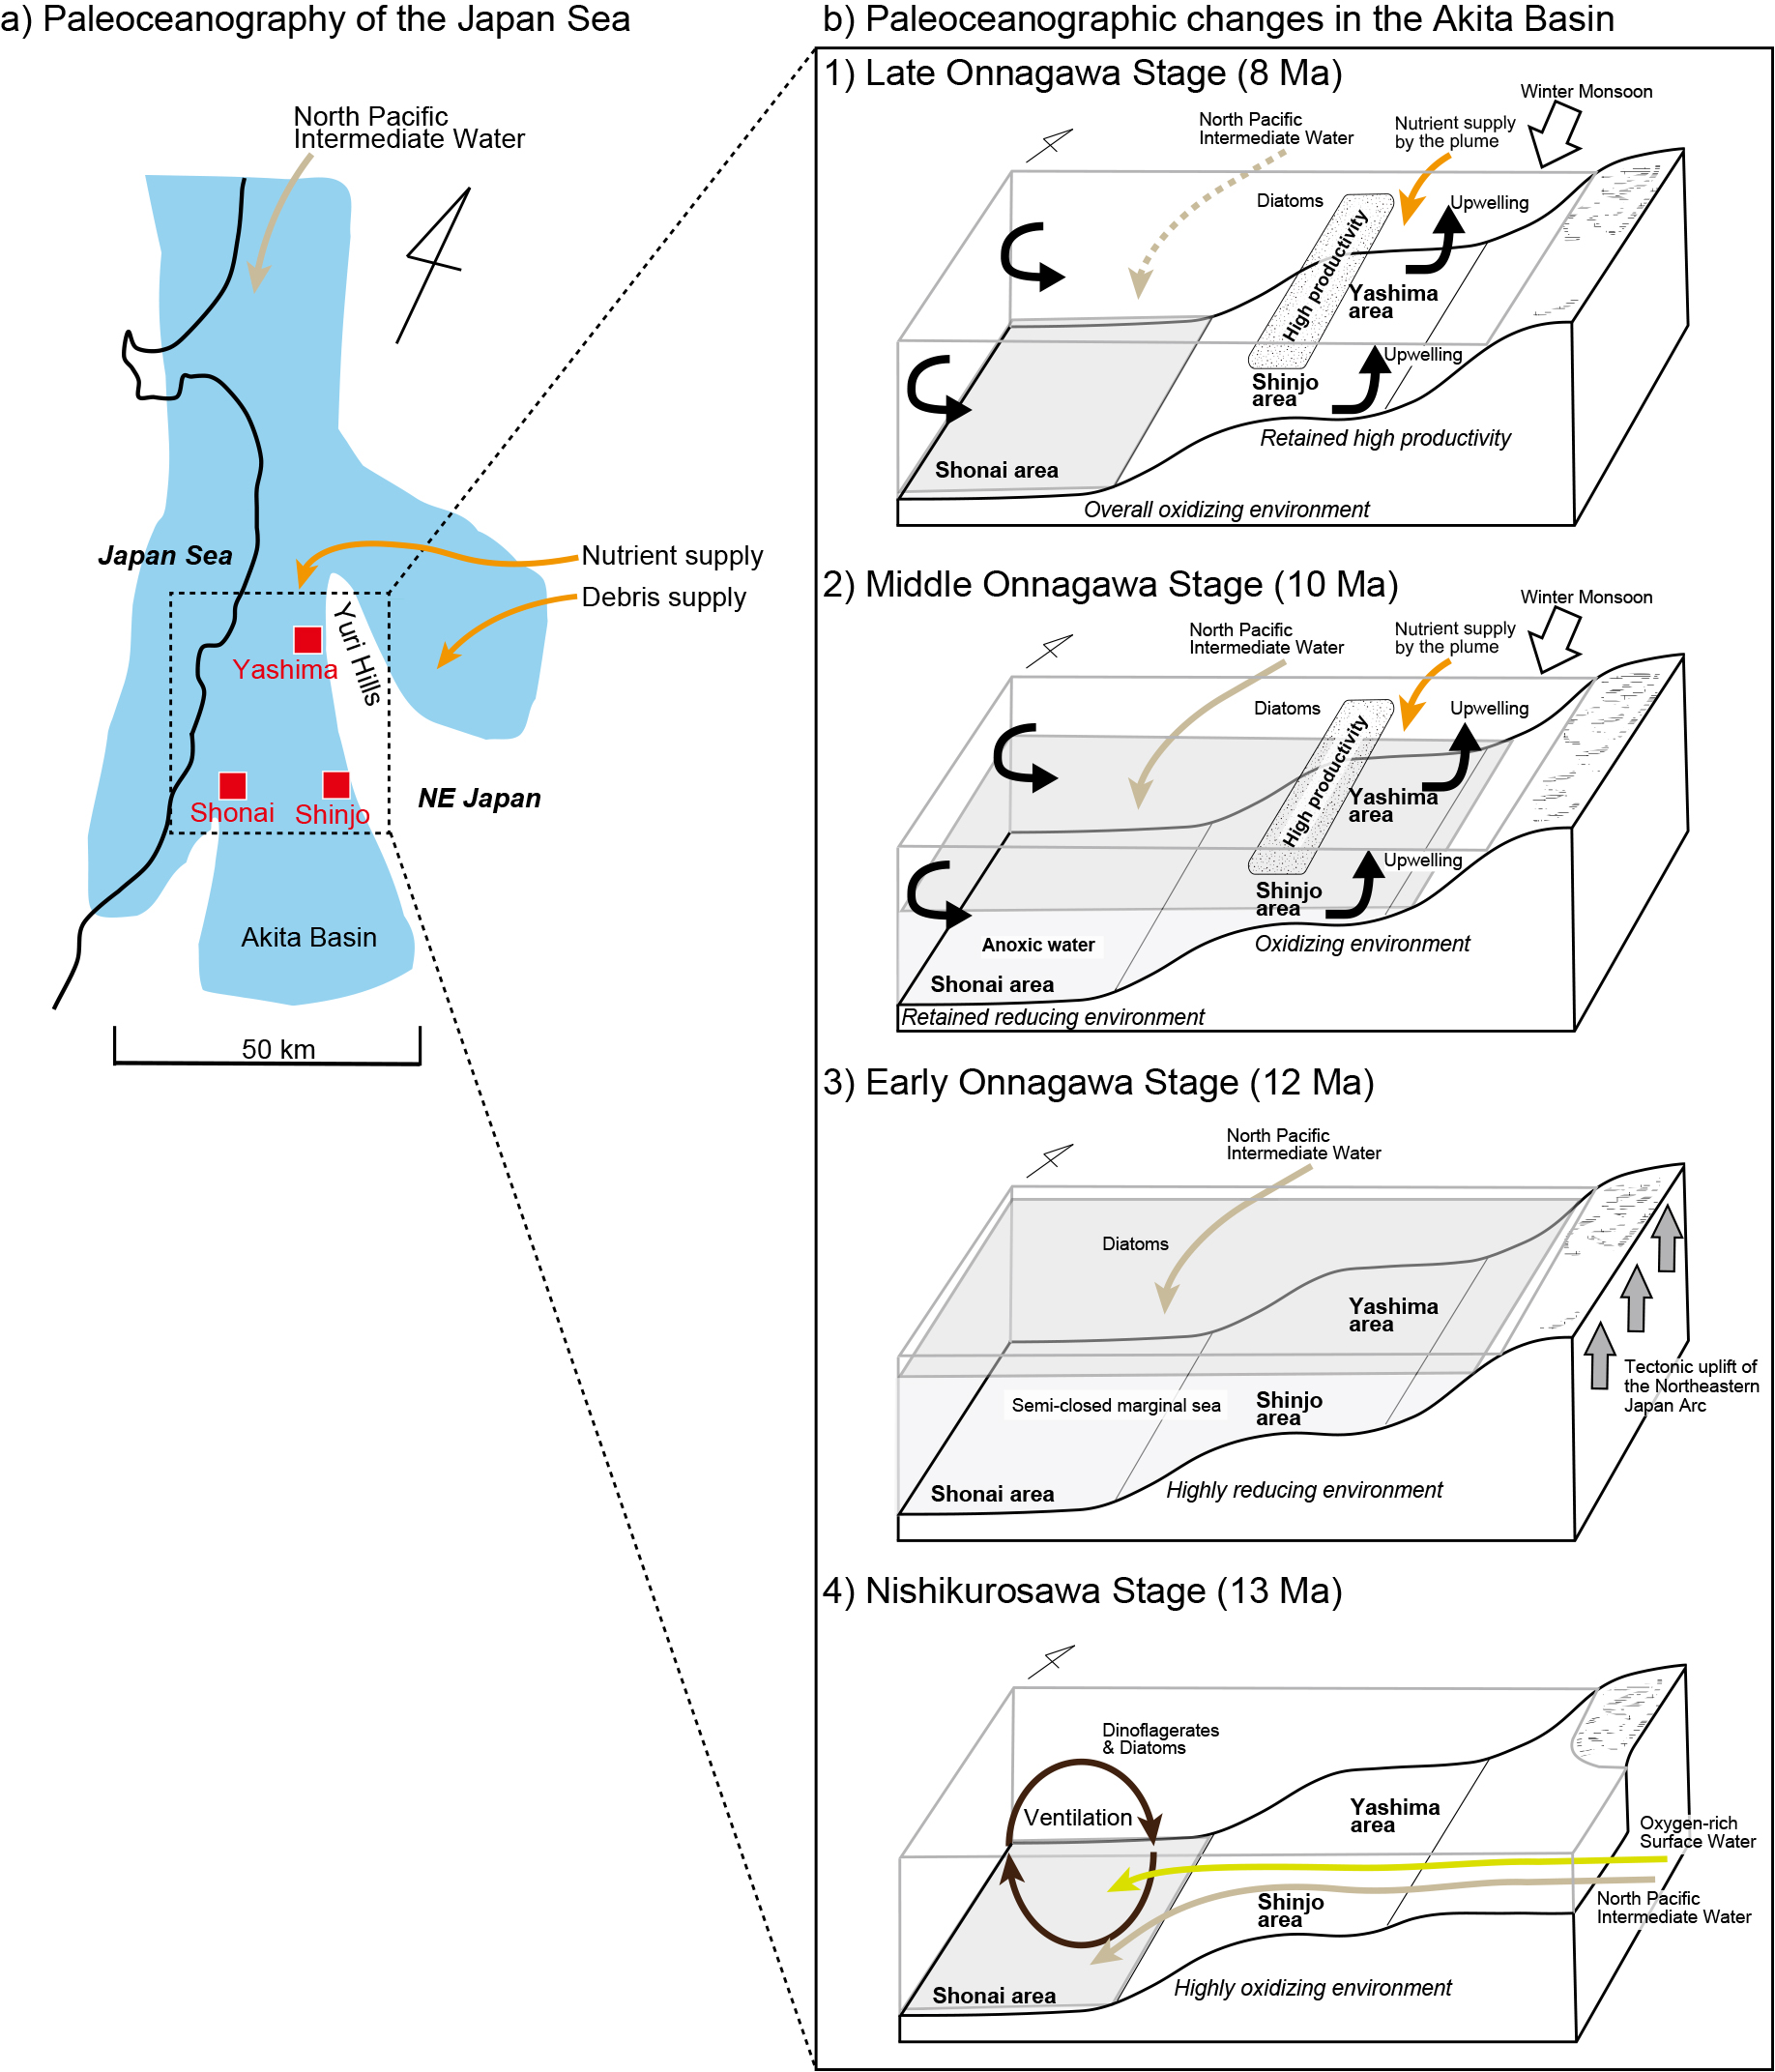
However, the Lower Onnagawa and Kusanagi formations were deposited under reducing conditions, suggesting that the entire Akita Basin likely experienced anoxia (Fig. 7, 8b-3). This shift from the oxic Nishikurosawa to the anoxic Early Onnagawa Stage indicates that the Japan Sea became a semi-closed basin with restricted circulation (Fig. 8b-3, 4). In the Akita Basin, the Dewa (Yuri) Hills subsided from an inner sublittoral zone to middle bathyal zone at 13.5 Ma. Following this subsidence, the proto-Northeastern Japan Arc was formed by uplift of the Ou Mountains around 12 Ma (Nakajima, 2013, 2018) and the Japan Sea changed from the open marginal sea of the Nishikurosawa Stage to a semi-enclosed sea that was only connected to the Pacific Ocean by northern straits (Fig. 8a; Nakajima, 2018). As a result, a depositional environment that facilitated organic matter preservation was established in the Akita Basin (Fig. 8b-3; cf. stagnation model of Stein, 1991). Concurrently, the major primary producers in this area changed from both dinoflagellates and diatoms to diatoms at around 12 Ma. This transition in the Akita Basin in the middle–late Miocene coincided with the global trend of decreasing dinoflagellate abundance with increasing diatom abundance (Falkowski et al., 2004). As the nutrient-rich North Pacific Intermediate Water flowed into the Japan Sea from the northern straits (Fig. 8a; Tada, 1994, 1995; Matsuzaki et al., 2018), the marine plankton assemblages in the Japan Sea should have experienced the same change as the global ocean assemblages and the silica-rich Intermediate Water should have enhanced diatom-dominated primary production. The transition from dinoflagellates to diatoms can be attributed to the increase in dissolved silica in the ocean from the increase in grasses on land during the Miocene (Falkowski et al., 2004; Kidder and Gierlowski-Kordesch, 2005), which accelerated the biologically catalyzed silica weathering process. The homohopane index and Pr/Ph results indicate that the depositional environment of the Lower Kusanagi Formation was more reducing than that of the Lower Onnagawa Formation (Fig. 7). The Shonai Plain, which is close to the center of the sedimentary basin, was a more reducing depositional environment than the Yashima area (Fig. 8b-3). Therefore, the Shonai Plain was a suitable environment for the deposition of source rocks because organic matter was not diluted by clastic material.
During the Middle Onnagawa Stage (~10 Ma; Fig. 8b-2), the eastern margin of the Shonai Plain experienced stable primary production, and siliceous mudstones with high TOC (>1%) were deposited under reducing conditions. However, deposition of the Onnagawa Formation in the Yashima area had shifted to an oxidizing environment with high TOC maintained by increased primary production (cf. production model of Stein, 1991). Tada (1994) reported that primary production decreased around 10.5 Ma in the deep Japan Sea (e.g., the Yamato and Japan basins). This finding indicates that primary productivity showed spatial variability, with reduced primary production in the center of the Japan Sea but enhanced local primary production in some areas. The northwestern monsoon, which started to intensify during this period (Sato et al., 1995), and the Yuri Hills topography caused coastal upwelling. The occurrence of this upwelling can explain the local increase of primary productivity during deposition of the Onnagawa Formation. Source rock deposition in the Tenpoku and Niigata basins was also influenced by coastal upwelling during the same period (Fukusawa et al., 1992; Sato et al., 1995). Because the Yashima area is close to land (Fig. 1; Usuta, 1989), it may also have been an environment where nutrients were easily supplied.
There are two possible reasons why the depositional environment of the Middle Onnagawa Formation changed to oxidizing conditions. The first is that the Yashima area, located at the margin of the Akita Basin, was affected by oxygen-rich surface water because the paleobathymetry during the Middle Onnagawa Stage was shallower than that during the Early Onnagawa Stage (Tsuji et al., 1991). The second explanation is that oxygen-rich seawater flowed to the seafloor in the Yashima area because vertical circulation associated with coastal upwelling occurred locally (Yamamoto et al., 1999; Fukusawa, 1992). Alternatively, this circulation may have occurred basin-wide between the upper and lower seawater of the Japan Sea because upwelling occurred in a broad area of the western coast of northern Japan (Fukusawa, 1992; Sato et al., 1995; Martizzi et al., 2021) and because bottom currents were intensified at 9 Ma (Watanabe, 1994) when similar changes from reducing to oxidizing environments appeared on Sado Island (Fig. 1; Sakamoto, 1992). The Middle Kusanagi Formation recorded a more reducing depositional environment than the Middle Onnagawa Formation, but the TOC was not higher. This difference probably arose because the Shonai Plain was a reducing depositional environment because of its depth but did not experience upwelling because of its position in the central basin; thus, although the depositional environment was suitable for the preservation of organic matter, there was less primary production and therefore less organic matter to preserve. There was a decrease in C28 sterane relative abundance in the Yashima area, but an increase on the eastern margin of the Shonai Plain, suggesting that primary production was not uniform within the Akita Basin.
In the Late Onnagawa Stage (8 Ma; Fig. 8b-1), the eastern margin of the Shonai Plain and the Shinjo area also shifted to relatively oxidizing depositional environments. Therefore, the TOC of the Shonai Plain eastern margin decreased owing to organic matter decomposition. In the deep Japan Sea (e.g., Yamato and Japan basins), benthic foraminiferal assemblages also indicate a slightly oxidizing seafloor environment in the Late Onnagawa Stage (Tada, 1994). Furthermore, it has been suggested that the contribution of anoxic North Pacific Deep Water gradually decreased in the Japan Sea inflow from 10 to 8 Ma (Kozaka et al., 2018). Therefore, the entire Japan Sea is estimated to have changed to an oxidizing seafloor environment. Deposition of the Upper Kusanagi Formation on the Shonai Plain was under more oxidizing conditions than those in the Lower to Middle Kusanagi Formation, but some degree of oxygen depletion remained because the homohopane index was 0.07–0.19. In contrast, the seafloor environment in the Shinjo area was overall more oxidizing, with slightly higher TOC in the Upper Kusanagi Formation (Suzuki and Taguchi, 1984; Taguchi et al. 1986; Shimoyama and Matsubaya, 1985). Primary production in the Shinjo area may have increased owing to coastal upwelling and increased terrestrial nutrient supply, similar to the Yashima area (Fig. 8a, b-1). However, it is not clear whether the timing of the increase in primary productivity was synchronous with the Yashima area because the precise age of the Kusanagi Formation in the Shinjo area has not been determined.
In addition to the environmental changes discussed above, diagenesis also played an important role in altering the source rock characters and resultant hydrocarbon distribution. Centimeter- to meter-scale rhythmical alternation of dark and light mudstones in the Onnagawa and equivalent formations has often been attributed to orbital-scale sea-level fluctuations that allowed intrusion of the nutrient-rich, oxygen-poor North Pacific Intermediate Water into the Japan Sea during sea-level highstands and restricted the intrusion during sea-level lowstands by a sill (Tada, 1991; Martizzi et al., 2021). However, our biomarker analysis of hard and soft mudstones in the Onnagawa Formation and black and white bands in the Kusanagi Formation clarifies that organic matter sources and redox conditions were almost the same in both units, with only TOC differing. This result suggests the occurrence of biogenic silica migration during diagenesis and thus questions orbitally forced climatic or sea-level fluctuations as the origin of the dark and light layers (Abrajevitch, 2020; Suzuki, 2021). Early diagenetic sulfurization and resultant organic sulfur compounds also affected hydrocarbon distribution. Suzuki (2021) showed that the source rocks in the Yashima area and the adjacent Yuri Hills had relatively low activation energy distribution, probably because of high organic sulfur content, which resulted in earlier oil generation. The high organic sulfur content was interpreted to have resulted from a highly anoxic seafloor environment caused by high primary productivity induced by coastal upwelling along the western coast of the land (Suzuki, 2021).