ARTICLE
Raman spectroscopic identification of continuity of a channel olivine in a peridotite specimen

2022 Volume 56 Issue 1 Pages 31-39

Details
2022 Volume 56 Issue 1 Pages 31-39
In the Horoman peridotite complex, the peridotite containing olivine-filled channels is known to exist. To examine the distribution pattern of the channel olivine, we performed non-destructive microanalyses of Raman spectra at 51 points of the olivine with 5 mm intervals along the channel. Compared with the Raman spectra of a reference euhedral olivine, for which the crystallographic orientation is known, there is no abrupt change in the crystallographic orientation in the 250 mm line analysis region of the channel. Moreover, Mg/Fe ratios of the channel olivine show gradual change over the entire measured area. If the channel olivine is an aggregate of olivine grains crystallized from magma infiltrating into the channel, then there should be olivine grains with both uneven crystallographic orientation and a homogeneous Mg/Fe ratio. Therefore, the olivine in the channel is regarded as a single crystal with slight growth zoning. The peridotite with the channel had been a part of mantle that was uplifted by the collision of plates. Therefore, the channel is a trace of magma migrating in the mantle. Magma migration in mantle drives the material–thermal circulation system connecting the Earth’s interior and surface. Furthermore, the size of the mineral in mantle reflects its stress field. Therefore, the magma channel involving such a large olivine is a unique specimen that reveals the particular characteristics of magmatism occurring in the Earth’s interior.
Peridotite complexes occasionally show layering of channels composed of dunite. The channels deserve attention because they are regarded as remnants of magma migrating within mantle (Kelemen et al., 1995). Migration of magma in mantle has a dominant role in material–thermal circulation through internal and external solid Earth. In addition, magma migration in mantle engenders kinetic fractionation on chemical compositions between the mantle and magma (e.g., Yamamoto et al., 2009a, 2020): magma migration in mantle has the potential to significantly change the chemico-thermal condition of the Earth. Therefore, investigation of the generation mechanism of the magma channels in peridotites is essential to elucidate Earth’s progress.
Although no definite view exists of channel formation, a fracture-controlled melt transport has been proposed for formation of ophiolitic dunite–chromitite channels (Lago et al., 1982; Suhr, 1999); the generation of channels might be ascribed to the local distribution of small stress in mantle. To test that hypothesis, an analysis of grain-size would be effective because stress influences the size of mantle minerals such as olivine (e.g., Chu and Korenaga, 2012; Karato et al., 1980; Van der Wal et al., 1993; Yamamoto et al., 2008). It has been reported that the Horoman peridotite complex may contain megacrystic olivines, which seem to stretch to several tens of centimeters long (Niida and Takazawa, 2007; Niida et al., 2002; Yoshikawa et al., 2019). Because there are no other occurrences of such a huge single olivine grain, the identification of continuity of the olivine would establish a foothold for exploring an uncharted crystallogenetic condition of channels in mantle.
Crystallographic orientation is useful to discriminate mono-crystal from poly-crystal. If the olivine in the channels was precipitated from magma, then the channels would be filled with the aggregate of cumulous olivines with heterogeneous crystallographic orientation. In contrast, if it shows almost uniform orientation, then it should be a single olivine formed in a special condition in mantle. It is nevertheless difficult to measure the crystallographic orientation of olivine in the channel using widely used methods such as observation with a universal stage or electron backscatter diffraction (EBSD) analysis. This is true because the channels elongate to several tens of centimetres long, requiring the use of dozens of highly polished specimens even if thin-section observation or electron microscopy can be conducted.
By contrast, micro-Raman spectroscopy enables us to ascertain the crystallographic orientation of olivine (Ishibashi et al., 2008), which requires neither a thin section nor a highly polished surface, making it possible to conduct non-destructive measurement of the crystallographic orientation of olivine in the huge peridotite specimen. In addition, Raman spectroscopy can be used to ascertain the Mg/Fe ratio (e.g., Ishibashi et al., 2012), where Mg and Fe are the two main elements in olivine. Consequently, we nondestructively investigated both the orientation and Mg/Fe ratio of olivine in the channel by micro-Raman spectroscopy to verify continuity of the olivine.
A peridotite body with a layered structure was exposed at the southeast end of Hidaka Mountains, Japan, which is within an area of a global geopark “Mt. Apoi UNESCO Global Geopark” (Fig. S1 in Supplemental Material). This body, risen from the upper mantle, is well-known globally as the “Horoman peridotite complex” (Obata and Takazawa, 2004; Ozawa and Takahashi, 1995; Yoshikawa et al., 2019). The Hidaka Mountains are made of metamorphic rocks and plutonic rocks formed from about 50 million to 14 million years ago (Kemp et al., 2007; Saheki et al., 1995). These are distributed in a zone approximately north–south along the ridge of the mountains. The Hidaka Mountains had been located right at the border of the North American Plate and the Eurasia Plate. The uplift of Hidaka Mountains, which began about 13 million years ago, is explained as follows: the Chishima arc at the south end of the North American Plate went westward and the southwest end thrusted westward (Kimura, 1982). The Horoman peridotite complex is the lowermost layer of the Chishima arc running onto the Eurasia Plate (Niida, 2004, 2010).
Many dunite channels exist within the Horoman peridotite complex. Basaltic magma formed by partial melting of the upper mantle peridotite concentrates and rises inside the upper mantle toward the Earth’s surface. Therefore, the dunite channels provide direct evidence for the magma migration environment in mantle (Niida and Shiotani, 1997; Niida et al., 2006; Takahashi, 1992; Takazawa et al., 1992, 1999; Yoshikawa et al., 2019): the dunite channels of the Horoman peridotite complex are the fossils of magma “paths”.
The Horoman peridotite specimen used in this study is now on display in Hokkaido University Museum (HoUM) (Figs. 1 and S2 in Supplemental Material). The sample is identical to the sample examined by Yoshikawa et al. (2019) with the name “1.6OL”. Yoshikawa et al. (2019) described that a main characteristic of the specimen was the presence of the dunite channel crossing the layerings of the porphyroclastic harzburgite at a shallow angle. The channel, which involves a large olivine, runs from one end of the specimen to the other. In this study, we refer to the large olivine in the channel as a channel olivine. The channel olivine is accompanied by veins of fine- to medium-grained olivine with diameter of 0.01–1.50 mm. Within the channel olivine, pyroxene-rich veins (orthopyroxene + clinopyroxene + spinel) and cracks are often observed. We analyzed a 250-mm-long area in which there was no readily apparent vein and crack.
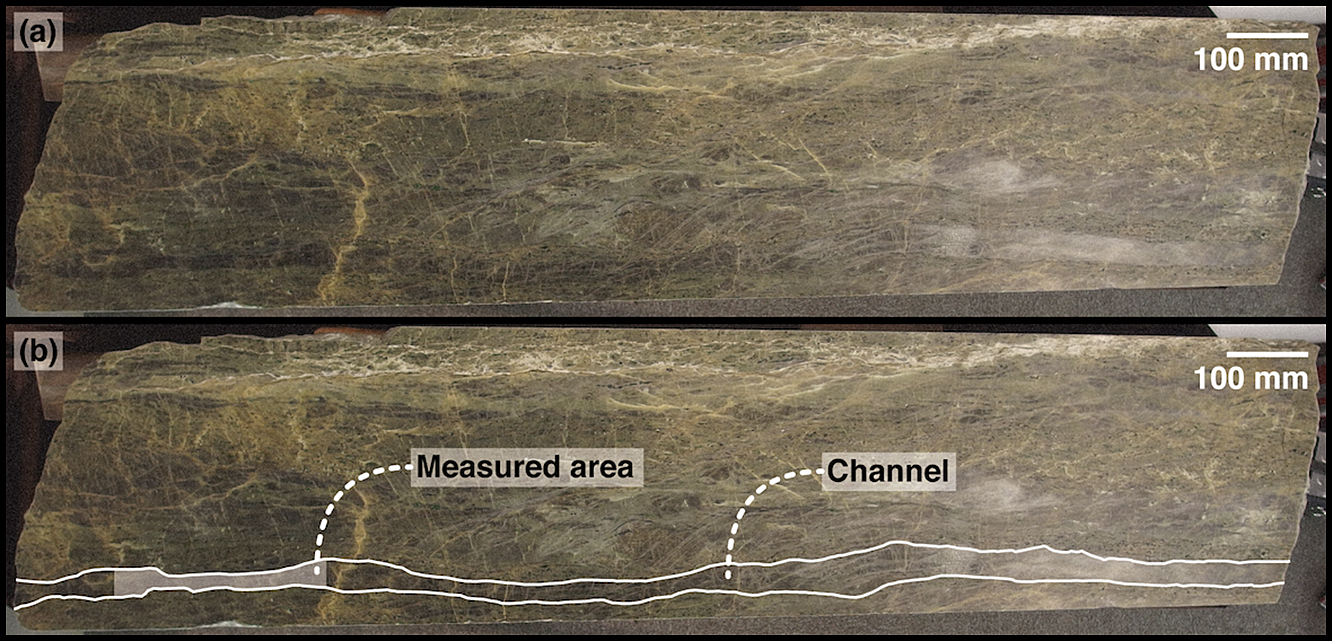
(a) Photograph of Horoman peridotite and (b) photograph showing the measured area and channel.
To ascertain the crystallographic orientation of the channel olivine, we used an euhedral olivine from Sapat Gali, Naran, Kaghan Valley, Mansehra District, Khyber Pakhtunkhwa, Pakistan (Bouilhol et al., 2012) as a reference olivine. Mg# of the olivine is 95.06 ± 0.21, which is within the range of the reported values for the olivine in this area (85–97, Bouilhol et al., 2012, 2015), where Mg# is defined as 100 × Mg/(Mg + Fe).
Micro-Raman spectroscopyWe obtained Raman spectra of olivine using a micro-Raman spectrum analysis system available at the HoUM. Detailed analytical conditions for the Raman spectrum were described by Hagiwara et al. (2020) and Yokokura et al. (2020). The Raman shift was calibrated using a standard sample of naphthalene. Each spectrum was collected for 300 s using laser power of 16 mW at the focal point of the objective lens (10×, N.A. = 0.2, T Plan SLWD; Nikon Corp.). Each peak was fitted to a Gaussian and Lorentzian mixing curve.
We transferred the Horoman peridotite specimen to a laboratory for Raman spectrum measurements (Fig. S3 in Supplemental Material). The channel has a flat surface. We obtained Raman spectra from 51 points on the specimen at 5 mm intervals along with channel elongation: the measured distance was 250 mm.
To ascertain Mg/Fe ratios from the Raman spectra of the channel olivine, we used the formula proposed by Ishibashi et al. (2012), which is based on the wavenumber of a certain Raman peak of the olivine. An artificial forsterite (Mg# = 100, Tachibana et al., 2002) and a natural olivine (Mg# = 90.07, Yamamoto et al., 2012) were used to calibrate the Mg/Fe ratios.
To infer crystallographic orientation of the channel olivine from Raman spectra, it is necessary to ascertain the orientation-dependent characteristics of Raman spectra of olivine. Polarization of the Raman scattering light is effective to discriminate orientation-dependent characteristics of the Raman spectra. The Raman system in HoUM has no polarizer between the sample and a spectrometer. In principle, unpolarized spectrum is a hybrid of polarized spectra, producing obscurity of an orientation-dependent signal. However, because an incident laser beam has a vibration direction, Raman scattering light involves information of an angle between the vibration direction of the incident laser beam and an excited crystal plane. Therefore, after we measured Raman spectra of an euhedral olivine from various directions, we examined the crystallographic orientation of the channel olivine by comparison with the Raman spectra of the reference euhedral olivine (Fig. S4 in Supplemental Material). The angles of declination and inclination of the olivine can be controlled by a rotating stage equipped with a microscope and a hand-made inclination platform. We measured Raman spectra of the reference olivine by controlling both the rotating stage and inclination platform and obtained Raman spectrum of a given crystallographic orientation of olivine.
Figure 2 presents Raman spectra of the channel olivine and the reference euhedral olivine. The Raman spectrum of olivine has five prominent peaks. The area ratio of these peaks varies depending on the incident direction of the excitation laser beam (Ishibashi et al., 2008). Characteristics of the Raman spectrum of the channel olivine are that peak 4 is small, the intensity of peak 2 is larger than peak 1, and peak 3 is clearly visible. Table 1 and Figure 3 show results of the linear analysis of 51 points of the channel olivine measured at 5 mm intervals. The characteristics of the Raman spectrum of the channel olivine described above are observed over the entire measured area. Of the Raman spectra of the reference olivine depicted in Fig. 2, the data that most closely resemble those of the channel olivine are the data obtained when the excitation laser beam is incident perpendicular to (010). The channel olivine in the measured area would have crystallographic orientation close to the b axis pointing upward.

Representative Raman spectra of both the channel olivine and the reference euhedral olivine in the spectral range of 700–1100 cm–1. For the reference olivine, the excitation laser was irradiated perpendicularly to the seven representative planes. For example, “Reference olivine (100)” indicates that the excitation laser beam is perpendicular to the (100) plane of the reference olivine.
| Position/mm | A1/(A1 + A2) | A3/(A1 + A2) | A4/(A1 + A2) | A5/(A1 + A2) | Mg# |
|---|---|---|---|---|---|
| 0 | 0.394 | 0.0517 | 0.00157 | 0.094 | 91.6 |
| 5 | 0.394 | 0.0531 | 0.00141 | 0.097 | 91.1 |
| 10 | 0.395 | 0.0531 | 0.00136 | 0.091 | 91.9 |
| 15 | 0.396 | 0.0537 | 0.00124 | 0.095 | 92.2 |
| 20 | 0.395 | 0.0533 | 0.00116 | 0.096 | 92.8 |
| 25 | 0.395 | 0.0537 | 0.00115 | 0.103 | 91.9 |
| 30 | 0.394 | 0.0541 | 0.00101 | 0.103 | 90.5 |
| 35 | 0.395 | 0.0526 | 0.00184 | 0.104 | 90.1 |
| 40 | 0.391 | 0.0517 | 0.00204 | 0.102 | 90.2 |
| 45 | 0.384 | 0.0532 | 0.00231 | 0.105 | 91.0 |
| 50 | 0.374 | 0.0562 | 0.00163 | 0.104 | 90.4 |
| 55 | 0.366 | 0.0591 | 0.00141 | 0.107 | 90.5 |
| 60 | 0.364 | 0.0589 | 0.00127 | 0.105 | 89.5 |
| 65 | 0.367 | 0.0579 | 0.00130 | 0.103 | 89.7 |
| 70 | 0.371 | 0.0578 | 0.00124 | 0.103 | 89.8 |
| 75 | 0.375 | 0.0586 | 0.00141 | 0.104 | 90.9 |
| 80 | 0.381 | 0.0568 | 0.00133 | 0.102 | 91.6 |
| 85 | 0.387 | 0.0552 | 0.00143 | 0.101 | 91.0 |
| 90 | 0.391 | 0.0518 | 0.00118 | 0.099 | 90.5 |
| 95 | 0.392 | 0.0521 | 0.00106 | 0.101 | 90.1 |
| 100 | 0.393 | 0.0497 | 0.00083 | 0.101 | 90.7 |
| 105 | 0.391 | 0.0485 | 0.00085 | 0.101 | 90.4 |
| 110 | 0.395 | 0.0465 | 0.00122 | 0.100 | 90.0 |
| 115 | 0.396 | 0.0487 | 0.00132 | 0.100 | 89.1 |
| 120 | 0.392 | 0.0537 | 0.00146 | 0.102 | 87.9 |
| 125 | 0.377 | 0.0584 | 0.00124 | 0.107 | 86.9 |
| 130 | 0.372 | 0.0595 | 0.00145 | 0.107 | 86.5 |
| 135 | 0.374 | 0.0560 | 0.00128 | 0.104 | 87.5 |
| 140 | 0.383 | 0.0533 | 0.00110 | 0.100 | 87.9 |
| 145 | 0.383 | 0.0566 | 0.00136 | 0.104 | 87.9 |
| 150 | 0.388 | 0.0644 | 0.00142 | 0.110 | 88.0 |
| 155 | 0.384 | 0.0658 | 0.00154 | 0.112 | 88.5 |
| 160 | 0.381 | 0.0641 | 0.00150 | 0.110 | 88.7 |
| 165 | 0.373 | 0.0606 | 0.00171 | 0.107 | 88.6 |
| 170 | 0.369 | 0.0621 | 0.00153 | 0.107 | 88.5 |
| 175 | 0.367 | 0.0612 | 0.00118 | 0.109 | 87.7 |
| 180 | 0.361 | 0.0604 | 0.00066 | 0.108 | 87.9 |
| 185 | 0.364 | 0.0568 | 0.00065 | 0.108 | 88.7 |
| 190 | 0.364 | 0.0578 | 0.00062 | 0.106 | 90.2 |
| 195 | 0.366 | 0.0539 | 0.00093 | 0.097 | 89.8 |
| 200 | 0.362 | 0.0587 | 0.00114 | 0.099 | 89.7 |
| 205 | 0.362 | 0.0591 | 0.00086 | 0.100 | 91.2 |
| 210 | 0.365 | 0.0617 | 0.00072 | 0.103 | 92.2 |
| 215 | 0.371 | 0.0636 | 0.00050 | 0.104 | 93.0 |
| 220 | 0.369 | 0.0633 | 0.00057 | 0.104 | 91.5 |
| 225 | 0.360 | 0.0659 | 0.00041 | 0.110 | 91.2 |
| 230 | 0.359 | 0.0635 | 0.00052 | 0.109 | 91.3 |
| 235 | 0.360 | 0.0643 | 0.00051 | 0.110 | 91.8 |
| 240 | 0.369 | 0.0634 | 0.00051 | 0.111 | 91.3 |
| 245 | 0.371 | 0.0633 | 0.00044 | 0.111 | 89.3 |
| 250 | 0.370 | 0.0653 | 0.00040 | 0.111 | 89.6 |
| Minimum value | 0.359 | 0.0465 | 0.00040 | 0.091 | 86.5 |
| Maximum value | 0.396 | 0.0660 | 0.00231 | 0.112 | 93.0 |
| Average value | 0.378 | 0.057 | 0.001 | 0.104 | 90.0 |
| Uncertainty (1σ) | 0.013 | 0.005 | 0.000 | 0.005 | 1.6 |

Line profiles of both Mg# and an area of a Raman peak i (Ai), for i = 1, 3, 4, and 5, to combined areas of peaks 1 and 2 of the channel olivine, (Ai/(A1 + A2)), acquired in 5 mm steps parallel to the channel. The errors for A1/(A1 + A2), A3/(A1 + A2), A4/(A1 + A2), and A5/(A1 + A2) were approx. 1%, 2%, 8% and 7%, respectively when the reference olivine was measured 10 times. The errors were about the same or slightly thicker than the solid lines of the line profiles.
The Mg# in the measured area ranges from 86.5 to 93.0 (Table 1). The values are similar to the range of earlier reported values (91.8–92.2, Yoshikawa et al., 2019). They are not uncommon for the peridotite derived from oceanic plate (Yamamoto et al., 2009b, 2014). The variation in Mg# of 86.5–93.0, which is greater than the uncertainty of the method (approx. ±1, Ishibashi et al., 2012). The Mg# shows a gradual change over the measured area (Fig. 3a). If the channel olivine is an aggregate of polycrystalline olivine crystallized from magma percolating into a channel, then homogeneous Mg# olivine aggregate should be found there. The gradual change of Mg# in the measured area might indicate growth zoning in a large single crystal.
This study was designed to ascertain whether the channel in the Horoman peridotite comprises a single large olivine. Among the information obtained from the Raman spectra of an olivine, crystallographic orientation is particularly useful for estimating the continuity of the channel olivine. From comparison of the Raman spectra of the various crystallographic orientations obtained from the reference euhedral olivine, one can infer that the channel olivine has crystallographic orientation close to the (010) facing up. However, a noticeable difference is apparent in the relative ratio of the area of peak 4 (A4/(A1 + A2)) (Fig. 3b and Table 1). The reproducibility of A4/(A1 + A2) was approx. 8% when the reference olivine was measured 10 times, where A1, A2, and A4 are area of peaks 1, 2, and 4, respectively. Therefore, the change in A4/(A1 + A2) portrayed in Fig. 3b is beyond the error range, implying a change in crystallographic orientation. If the crystallographic orientations differ significantly within the measured area, then it enhances the possibility that the channel olivine is an aggregate rather than a single crystal. We examine further how much variation exists is in the crystallographic orientation of the channel olivine.
In the Raman spectrum obtained by incident laser beam from a direction near perpendicular to (010), the area ratios of Raman peaks, which are sensitive to the incident direction of laser beam, were A1/(A1 + A2) and A4/(A1 + A2) (Fig. 2). Therefore, we adopt A1/(A1 + A2) and A4/(A1 + A2) as the main probes to refine the crystallographic orientation of the channel olivine.
Figure 4 presents the crystallographic orientation of olivine. φ is the angle between the [010] axis and the incident direction of the laser beam. θ is the angle between the [100] axis and the incident direction of laser beam projected on the {010} plane. Consequently, when φ is zero, the laser beam is incident perpendicular to the (010). Note that if the laser is incident from exactly on the [010] axis, θ cannot be defined. Figure 5 shows A1/(A1 + A2) and A4/(A1 + A2) obtained when measuring the reference olivine at three θ (0°, 22.5°, and 45°) with φ ranging from 15° to 45° at 7.5° intervals. In the case of the non-polarized Raman analysis, the area ratio of Raman peaks of minerals varies with the direction of vibration of the laser beam (Ishibashi et al., 2008). Because we did not know the crystallographic orientation of the channel olivine when we analysed it, we did not know the relation between the direction of laser beam oscillation and the crystallographic orientation of the channel olivine. Therefore, it is necessary to obtain Raman spectra of the reference olivine under the excitation condition of laser beam with various vibration directions to identify the crystallographic orientation of the channel olivine by comparison with Raman spectra of the reference olivine. We conducted measurements by rotating the reference olivine by 90° at 10° intervals while maintaining the incident direction of the laser beam.

Relations among φ, θ, and the crystallographic orientation of olivine. A bold arrow shows an example of direction of the incident exciting laser beam.
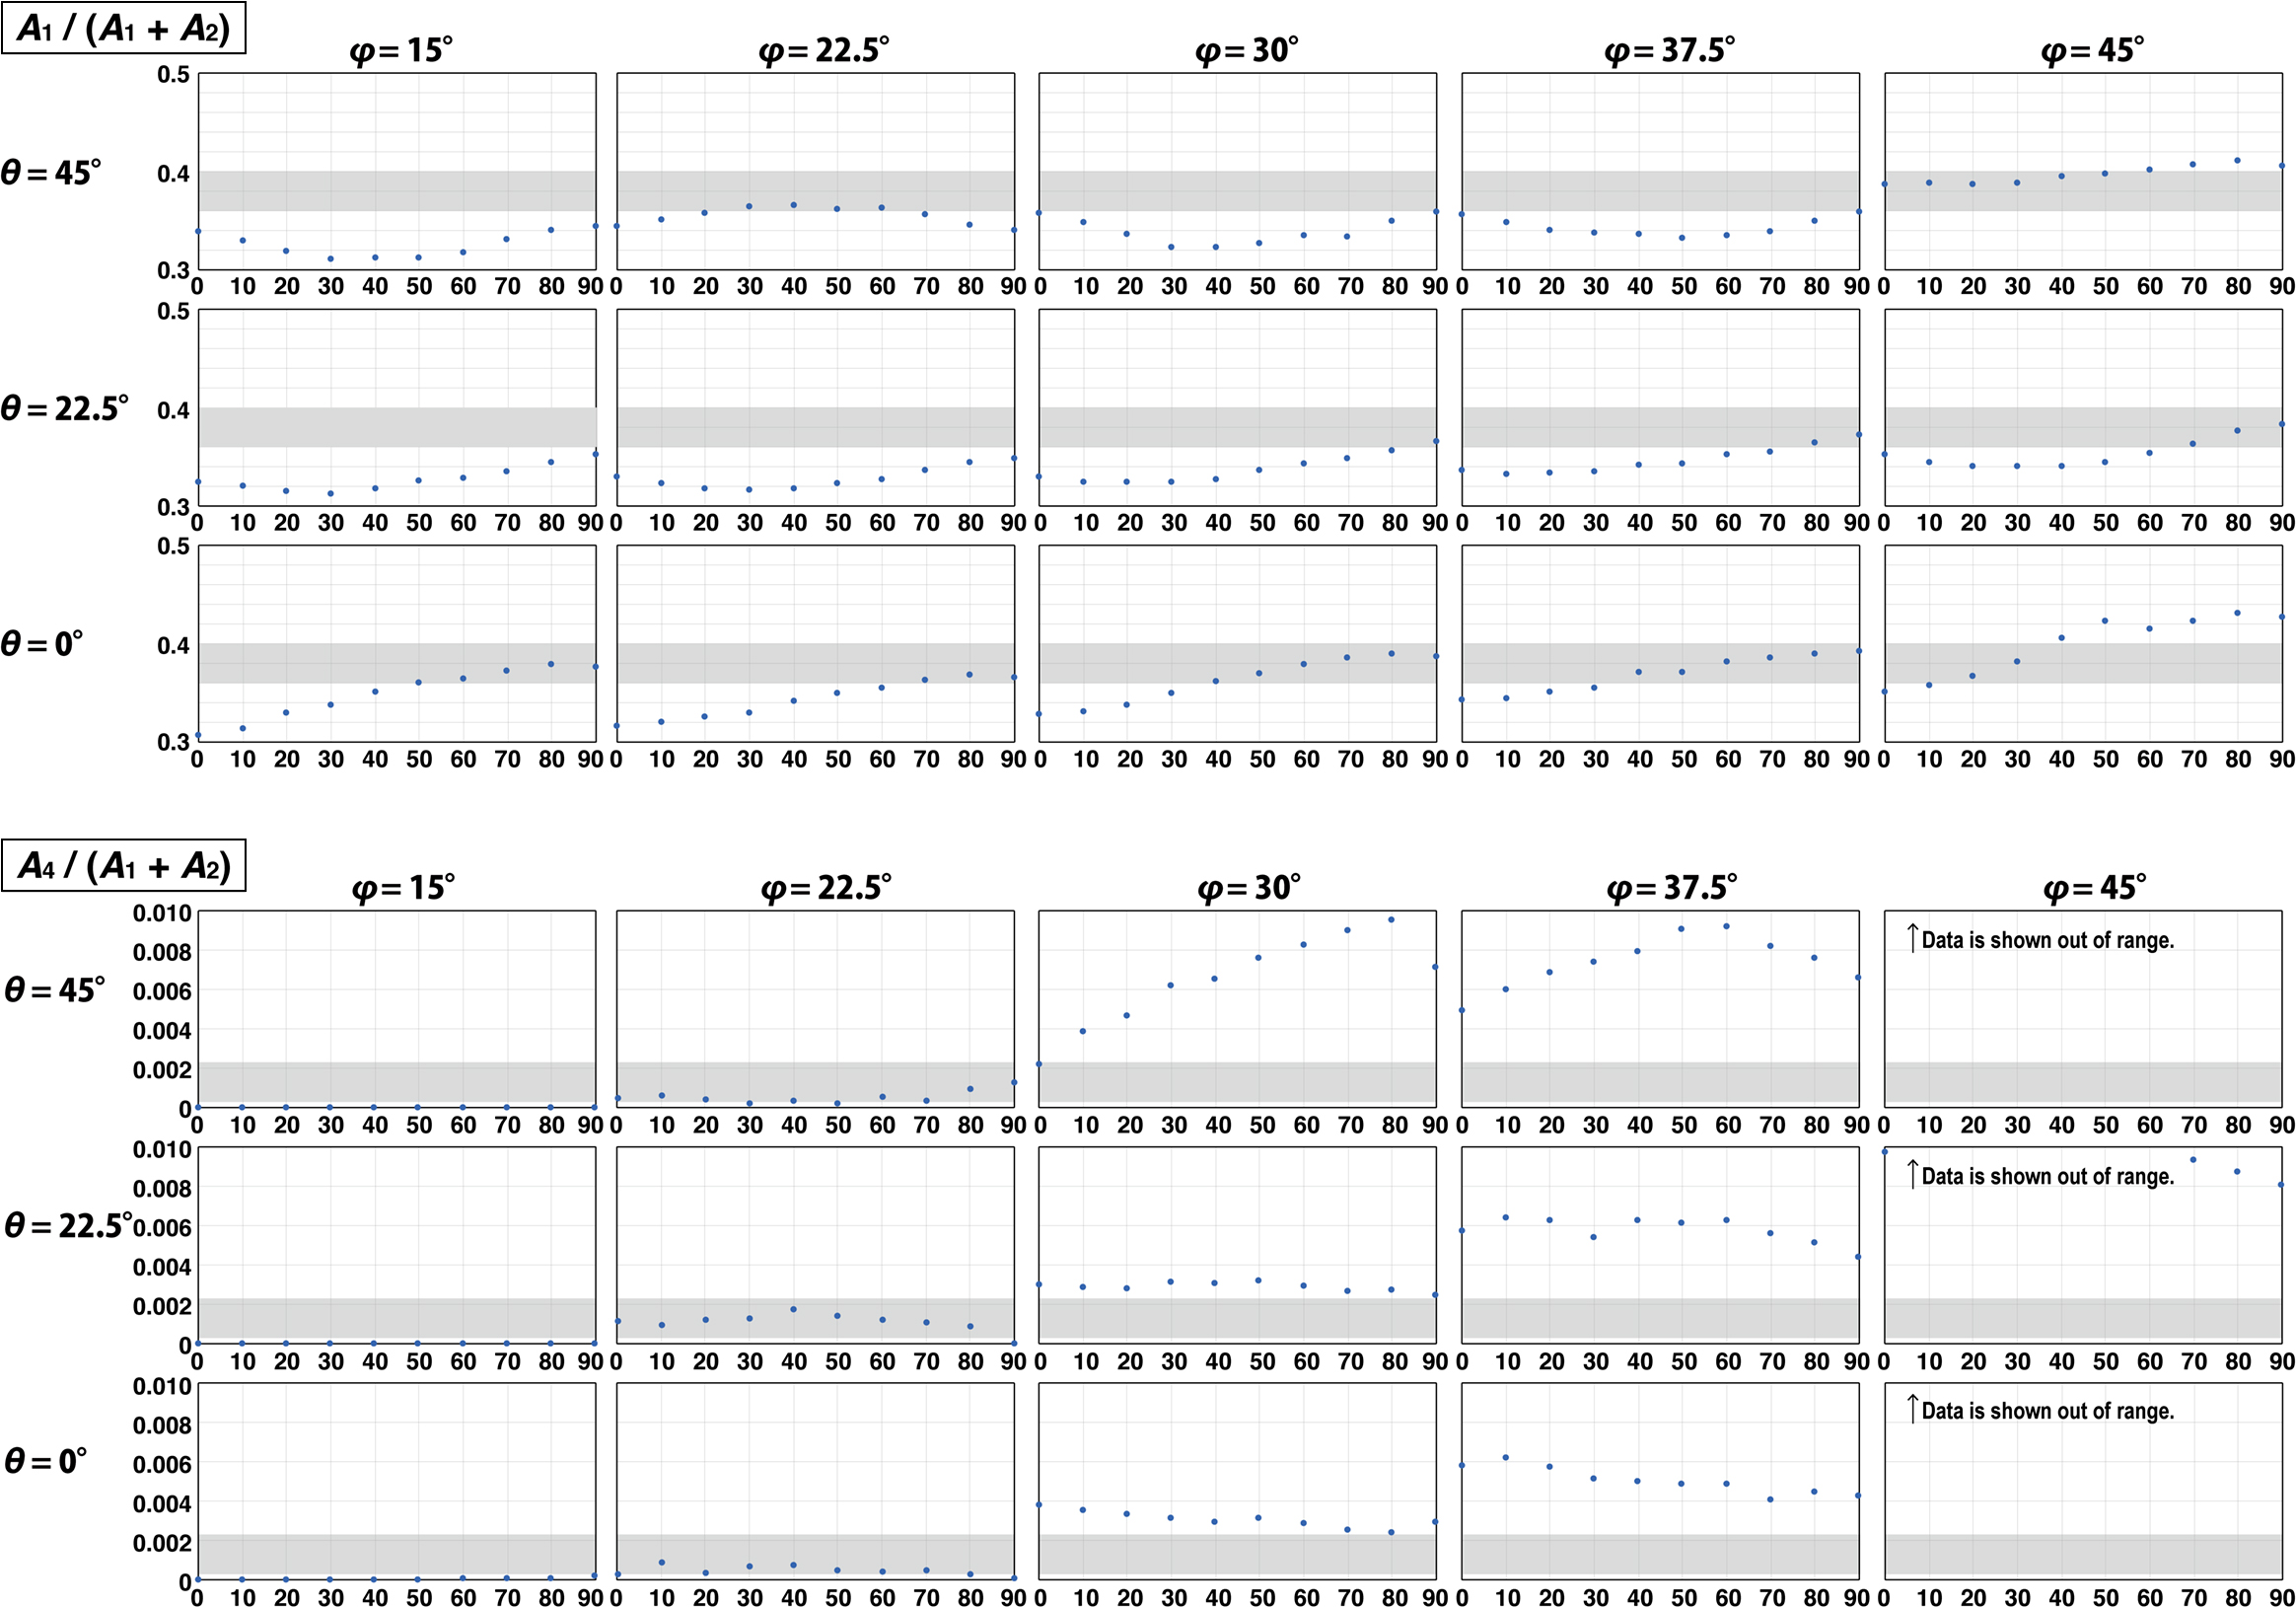
A1/(A1 + A2) and A4/(A1 + A2) for a reference olivine at various φ and θ. The horizontal axes show the rotation angle (degree). Gray shaded areas are ranges of channel olivine measurements.
The area ratio of Raman peaks obtained by rotating the reference olivine by 90° exhibits a periodic feature expressed as a trigonometric function (Fig. 5). The gray shaded area in Fig. 5 shows the range of variation in the area ratio of Raman peaks obtained from the channel olivine. In A1/(A1 + A2), there are many angular conditions where the gray shaded area and the data of the reference olivine overlap. On the other hand, in A4/(A1 + A2), the angular condition is limited to the case where φ = 22.5°. In short, the φ of the channel olivine is approximately 22.5°. Then, to constrain θ, we measured the Raman spectra of the reference olivine by varying θ from 0° to 90° in 22.5° intervals under the condition that φ is fixed at 22.5° (Fig. 6).
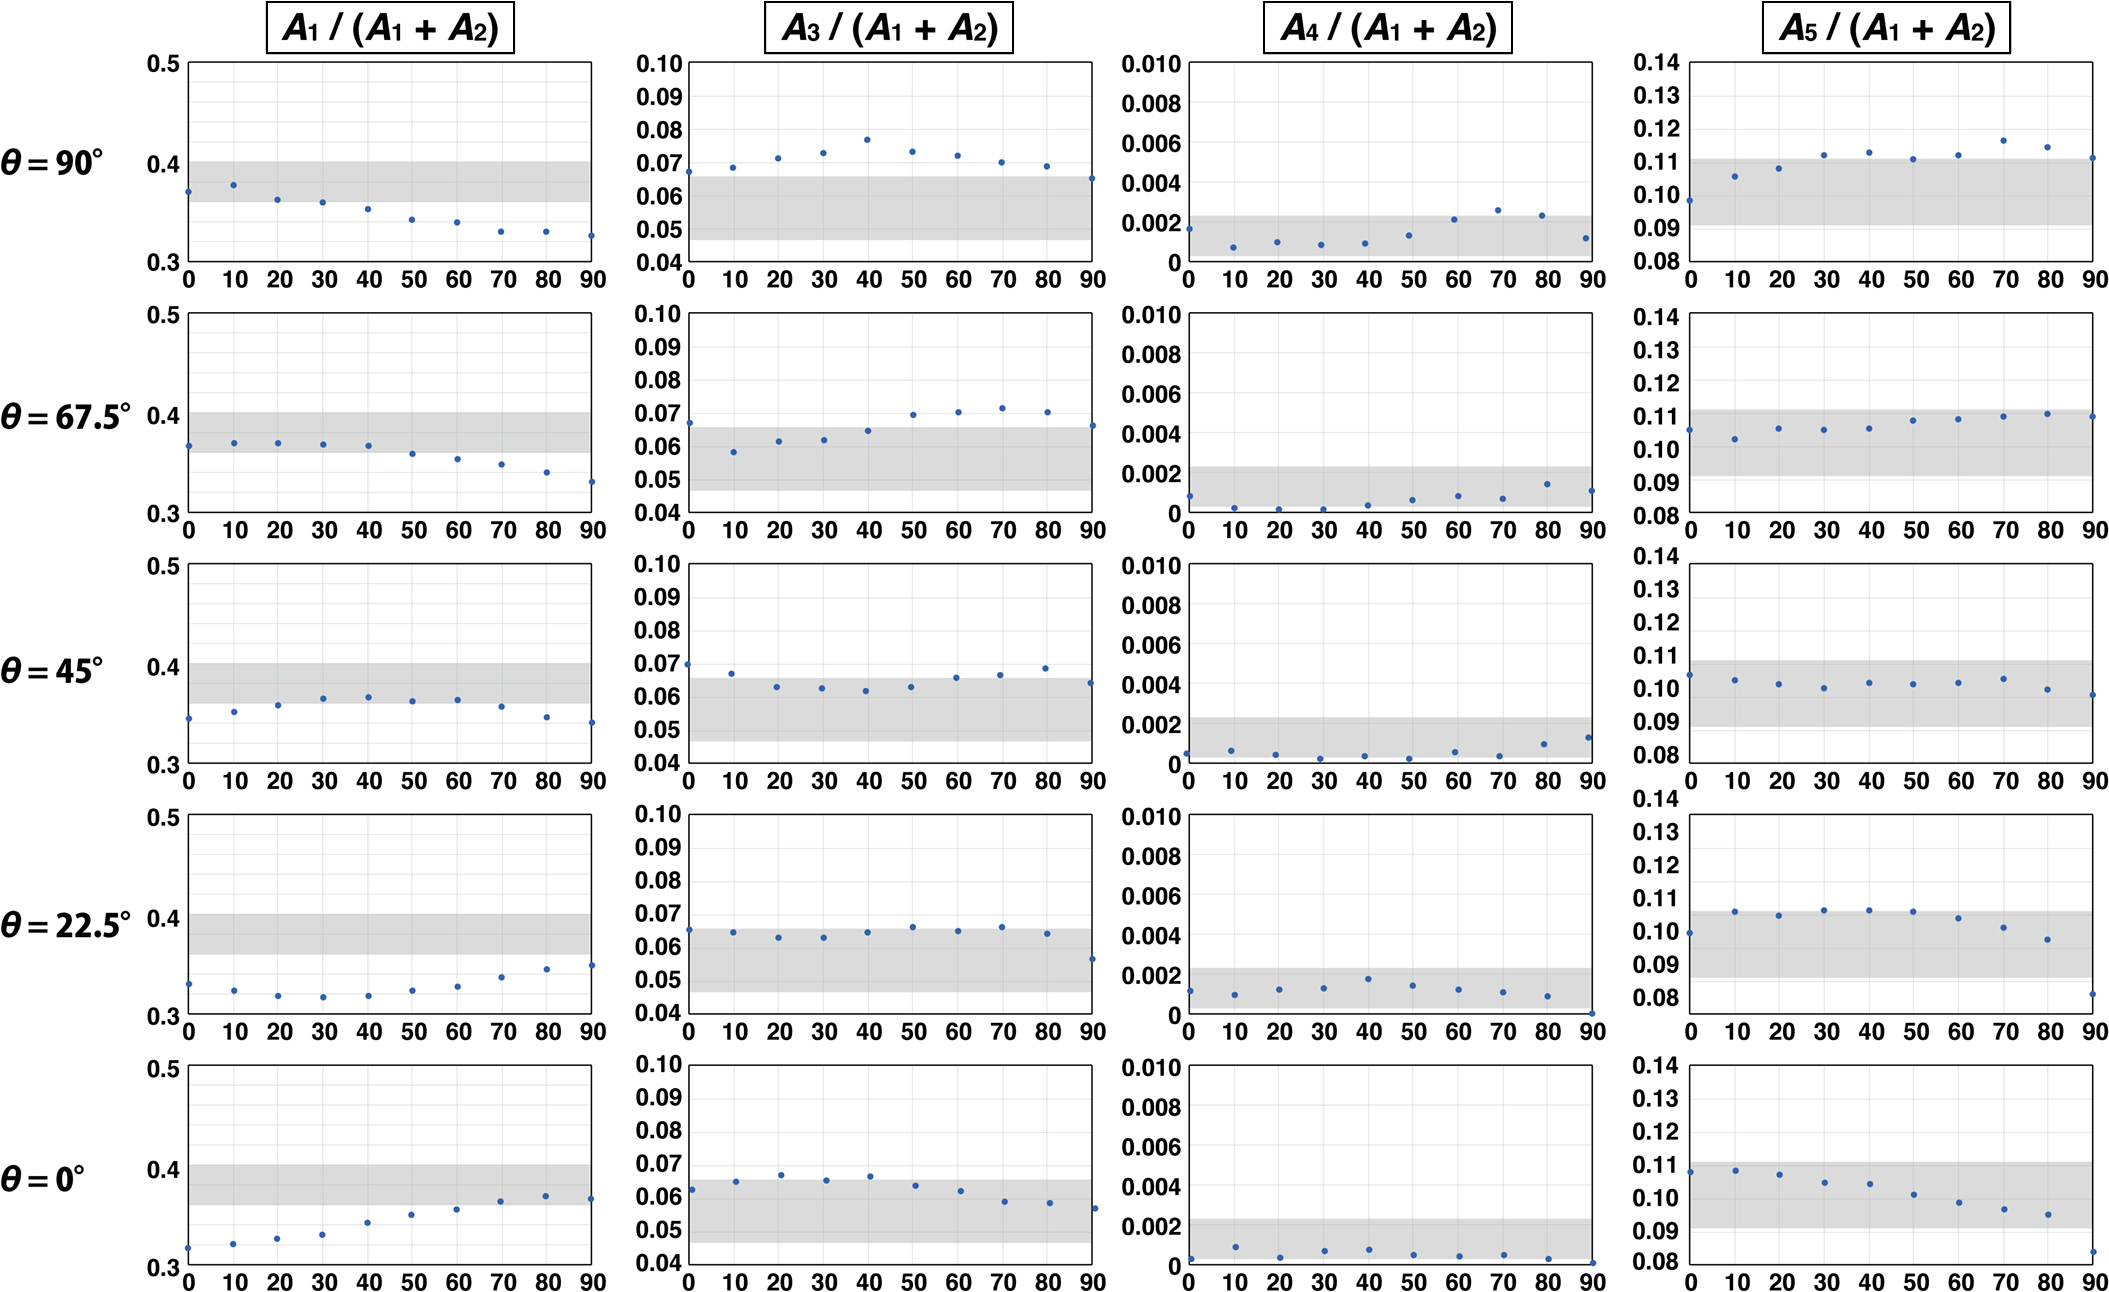
Relative area ratios of Raman peaks at various θ when φ is 22.5°. Horizontal axes show the rotation angle (degree). Gray shaded areas are ranges of channel olivine measurements.
For A5/(A1 + A2) at θ = 22.5°, the gray shaded area and the data of the reference olivine in Fig. 6 are overlapped completely. However, for A1/(A1 + A2) at θ = 22.5°, they do not overlap at all, suggesting that θ = 22.5° is not the crystallographic orientation that the channel olivine has. Following that finding, we can approach the crystallographic orientation of the channel olivine. To facilitate the constraint of the crystallographic orientation, the degree of overlap between the gray shaded area and the data of the reference olivine is presented in Table 2. Eliminating the conditions by which the degree of overlap is failed or poor, the remaining conditions, θ = 67.5° and φ = 22.5°, are the best estimates.
| θ | A1/(A1 + A2) | A3/(A1 + A2) | A4/(A1 + A2) | A5/(A1 + A2) |
|---|---|---|---|---|
| 0.0° | Poor | Good | Good | Great |
| 22.5° | Fail | Good | Great | Great |
| 45.0° | Poor | Poor | Great | Good |
| 67.5° | Good | Good | Great | Good |
| 90.0° | Good | Poor | Great | Great |
φ at analyses were 22.5°. Great, Good, Poor, and Fail mean that the peak intensity ratios of the sample and reference olivine overlap by >50%, 26–50%, 1–25%, 0%, respectively.
Even in the condition, the gray shaded area and the data of the reference olivine show no perfect agreement. The reason for the mismatch is probably attributable to the change in the crystallographic orientation of the channel olivine in the measured area. However, even if the crystallographic orientation changes, it does not deviate greatly from φ = 22.5° (Fig. 5). To emphasize that point again, if the channel olivine is a polycrystalline aggregate crystallized from magma infiltrating the channel, then the crystallographic orientation of the olivine must be randomly distributed. Therefore, uniformity in the crystallographic orientation of the channel olivine indicates that the channel olivine is a single crystal extending over the measured area. However, the crystallographic orientation of the channel olivine in the analyzed area was not completely uniform. The reason for this variance is discussed in the next section.
Generation processes of channel olivineThe growth of such the large single olivine with chemical zoning tells us about the process of magma channel formation in a peridotite body. There are at least two possible explanations for the formation of the channel olivine. The first is a model in which the channel olivine is generated by the coarsening of the polycrystalline aggregate olivine. The channel olivine is accompanied by fine-grained olivine veins (Yoshikawa et al., 2019). This observation implies that the fine-grained olivine associated with the channel olivine might be showing a snapshot of the coarsening process. However, if the channel olivine was formed simply by the coarsening of such polycrystalline aggregate olivines, then the chemical composition such as Mg# of the channel olivine would be homogeneous. This is because the Mg# of the fine-grained olivines in the channel is very homogeneous (Mg# = 91.4–92.0, Yoshikawa et al., 2019). The gradual change in Mg# of the channel olivine obtained in the present analysis is not consistent with the model. If dissolution and recrystallization occurred concurrently with coarsening, such a situation could explain the gradual change in Mg# of the channel olivine. However, if a large olivine was formed by dissolution and recrystallization occurring inside the Horoman peridotite complex body without material exchange, the olivine will show a three-dimensional thick distribution that is consistent with the distribution of the high-temperature region responsible for the dissolution. The platy distribution of the channel olivine would indicate an association with infiltration of fluid or melt.
The other possible model for the formation of the channel olivine is that the channel olivine grew directly from the melt that formed the dunite channel. Niida et al. (2006) proposed the formation process of the megacrystic olivine crystallized from porous flow of fluid-saturated melt at just prior to closure stage of the dunite channel growth. Also, the presence of pyroxene-spinel veins often crosscutting the megacrystic olivine suggest a crystallization model at the final stage of dunite channel formation. They hypothesized that olivine grew from the stagnant melt in the dunite channel, and that the pyroxene-rich veins were the result of the crystallization of pyroxenes and spinels from the melt after crystallization differentiation. It is consistent with the results of this study because it explains the gradual change in Mg# in the channel olivine. Yoshikawa et al. (2019) suggested that the high Mg# of olivine in the dunite channel was produced by the reaction of the intruded melt, which formed the dunite channel, with the surrounding harzburgite body. Following this suggestion, the Mg# of the melt would have been between the value of the surrounding harzburgite and that of the melt, probably a lower Mg#. Considering that a large olivine crystallized from such a melt, its Mg# would range from near the Mg# of harzburgite to much lower, from the core to the rim. This may be the reason why the channel olivine shows a gradual change in Mg# (93.0–86.5). If this is correct, the channel olivine analysed in this study may be a merged olivine of two grains that grew with similar crystallographic orientation bordering the 130 mm point, where the Mg# shows the lowest value. (Fig. 3).
The channel olivine analyzed in this study would be a rather unique specimen. We carried out a line analysis of the crystallographic orientation and Mg# of the thin-section of Horoman peridotite, which is identical to the one shown in Fig. 3 of Yoshikawa et al. (2019) as “1.6OL-I” (Fig. S5). As mentioned above, fine-grained olivine are in close association with the channel olivine. Some of them show similar crystallographic orientation and Mg# to the channel olivine. Considering the distribution of these fine-grained olivine and the channel olivine in the thin-section, the fine-grained olivine appear to be part of the channel olivine. In other words, it seems that the channel olivine had undergone severe deformation after its formation and became smaller and smaller by fragmentation. In the specimen analyzed for continuity across 250 mm in this study, many fine-grained olivine are distributed around the channel olivine. This fact may be evidence that some conditions have prevented the fragmentation of the channel olivine compared to other large olivines. However, even the channel olivine that survived fragmentation was not free from deformation. The variation in the crystallographic orientation of the channel olivine would reflect the deformation that the channel olivine had suffered after its formation.
The existence of such a huge olivine is not known in the world. Therefore, there must have been unique conditions in the channel that inhibited the fragmentation. The exploration of the conditions may contribute to solving the development process of the Horoman peridotite complex.
Implications of channel olivine continuityWe identified the continuity of the channel olivine by line analysis using micro-Raman spectroscopy. The distribution of the channel olivine in the present peridotite continues to the left and right sides of the measured area (Fig. 1). Because a crack exists to the right of the measured area, the length of this channel olivine is no more than approx. 43 cm. However, before the crack was produced, it was likely that the channel olivine was a grain more than a meter long, connected from one end of the specimen to the other.
The olivine size strongly affects its attractiveness as a specimen for museum exhibit. The largest known olivine, xenocryst in kimberlite, is 150 mm long (Dawson, 1980; Mitchell, 1986). The channel olivine examined in this study is at least 250 mm long: it is the largest olivine reported anywhere in the world.
We measured Mg# and crystallographic orientation of a channel olivine in a large peridotite exhibit in HoUM. The results of line analysis of 51 points at 5 mm intervals showed gradual change in Mg#, with a range of 86.5–93.0 in the 250 mm measured area. The crystallographic orientation was consistent with the conditions of angles around θ = 67.5° and φ = 22.5°. No distinct gap or random crystallographic orientation was observed in the measured area. These results indicate that the channel olivine, at least in the measured area, is a single crystal. The existence of such a large channel olivine would provide an important constraint on the conditions of channel initiation and magma migration in mantle. Therefore, these results enhanced the value of the Horoman peridotite as a specimen for understanding the circulation system for chemical components and heat from the Earth’s interior to the surface through volcanic activity.
In addition, the present results show that micro-Raman spectroscopy is useful to elucidate crystallographic orientation of minerals in rocks macroscopically. Micro-Raman spectroscopy is widely applicable to many mineral species. Moreover, the fact that the crystallographic orientation can be constrained using non-polarized Raman spectroscopy increases the applicability of the micro-Raman spectroscopy for the estimation method of crystallographic orientation. The in-situ nondestructive microanalysis conducted for this study will serve as a useful means for deciphering the size of crystals involved within various rock specimens.
Careful reviews and constructive criticisms by the editor and two reviewers, Drs. M. Yoshikawa and T. Morishita, are greatly acknowledged. This study was supported by Grants-in-Aid for Scientific Research (Nos. 20H02000 and 20K20931) from the Japan Society for the Promotion of Science.