ARTICLE
Molybdenum isotopic compositions in volcanic rocks from Northern Izu arc (Izu-Oshima, Niijima, and Kozushima)

2024 Volume 58 Issue 2 Pages 51-70

Details
2024 Volume 58 Issue 2 Pages 51-70
Variations in Mo isotopic ratios (δ98/95Mo values) in volcanic arc lavas reflect various processes occurring beneath island arcs, including slab dehydration, mantle melting, and crystal fractionation, making this tracer important in recent geochemistry. Previous studies of Mo isotopes have focused primarily on samples from the volcanic front (VF) of oceanic island arcs, and only a limited number of studies have been conducted on volcanoes in the rear arc (RA) regions. To better understand the behavior of Mo isotopes in subduction zones, we focused on the Northern Izu (N-Izu) arc and determined major and trace element abundances and δ98/95Mo values in basaltic samples from one VF (Izu-Oshima) and two RA (Niijima and Kozushima) islands. The N-Izu basalts are characterized by relatively uniform Zr/Hf ratios with systematic decrease in Ba/Th and increase in Ce/Mo ratios with increasing depth of the Wadati-Benioff zone, indicating a gradual decrease in the contribution of aqueous fluids from the subducting slab to a chemically homogeneous mantle wedge. Similarly, the δ98/95Mo values in the N-Izu basalts decrease with increasing slab depth from Izu Oshima (+0.11 ± 0.09‰) to Niijima (–0.14 ± 0.05‰) and Kozushima (–0.20 ± 0.21‰). The most straightforward interpretation for the elevated δ98/95Mo values in the N-Izu VF basalts is the contribution of slab-derived aqueous fluid enriched in heavy Mo isotopes to the source mantle of the VF volcanoes, due to the presence of residual minerals in the slab in which light Mo isotopes are preferentially distributed. In contrast, the low δ98/95Mo values in the RA basalts, which are as low as the mean MORB value (–0.18‰), suggest that the slab-derived fluid in the RA region is depleted in heavy Mo isotopes as a result of the continuous loss of heavy Mo isotopes via slab dehydration in the VF region, while other possibilities, including the incorporation of slab melts containing sedimentary components, cannot be ruled out.
The recycling of oceanic plates from convergent margins into the deep mantle plays an important role in the evolution of the solid Earth. Dehydration of aqueous fluids from subducting oceanic plates contributes to the growth of continental crust by promoting melting of the mantle wedge and the formation of island arc volcanoes. Subduction zone magmas therefore contain multiple components derived from altered mafic oceanic crust (AMOC), pelagic and terrigenous sediments, serpentinite formed above the slab or in the layer beneath the subducted crust, and the mantle wedge (Perfit et al., 1980; Plank and Langmuir, 1998; Ranero et al., 2003; Ringwood, 1974, Spandler and Pirard, 2013). Constraining the details of the elemental properties brought by slab-derived fluids is essential for understanding the contribution of subducting materials to the formation of island arc magmas, as well as the role of subduction zones in the coordinated evolution of Earth’s mantle and crust.
Recently, the isotopic composition of Mo in volcanic rocks from subduction zones has been recognized as an important geochemical tracer for understanding the dehydration process of the subducting slab and the subsequent material transport in the mantle wedge (e.g., Ahmad et al., 2021; Freymuth et al., 2015; Gaschnig et al., 2017; König et al., 2016; Li, H. Y. et al., 2021; Li, X. et al., 2021; Rojas-Kolomiets et al., 2023; Villalobos-Orchard et al., 2020; Willbold and Messling, 2023; Yu et al., 2022). Molybdenum has been suggested to be mobile in subduction zone fluids, and experimental constraints indicate that Mo mobility is controlled by the redox state and salinity of the hydrous fluid involved (Bali et al., 2012; König et al., 2008, 2016; Skora et al., 2017). Therefore, the Mo isotopic composition of island arc magmas is expected to reflect that of the slab-derived fluid and the mantle wedge. The Mo isotopic composition of a volcanic rock sample is assessed by the δ98/95Mo value, which is defined as the 103 times relative deviation of the 98Mo/95Mo ratio in the sample from a terrestrial standard (NIST SRM 3134). Many of the arc lavas are known to have relatively higher δ98/95Mo values than those of mid-ocean ridge basalts (MORBs) (δ98/95Mo ≈ –0.17‰: Bezard et al., 2016; Chen et al., 2022; Hin et al., 2022) and depleted mantle (DM) (δ98/95Mo ≈ –0.20‰; Bezard et al., 2016; Hin et al., 2022; McCoy-West et al., 2019). Although crystal fractionation of minerals such as amphibole and biotite can increase δ98/95Mo values in magmas (e.g., Li, H. Y. et al., 2021; Voegelin et al., 2014; Wille et al., 2018), high δ98/95Mo values are widespread in less differentiated arc basalts, suggesting that slab-derived fluids delivered Mo with relatively high δ98/95Mo values to the mantle wedge.
On the other hand, δ98/95Mo values of basaltic samples from Cyprus (–0.57 to –0.12‰), Papua New Guinea (–0.50 to –0.17‰), Martinique arc (–0.23 to –0.06‰), and western Aleutians (–0.27 to –0.03‰) are similar to or lower than those of MORB and DM (Gaschnig et al., 2017; König et al., 2016; Rojas-Kolomiets et al., 2023). Additionally, basaltic samples from RA volcanoes in the Mariana Trough (–0.65 to 0.02‰), Izu arc (–0.17 to –0.12‰), and Kamchatka arc (–0.31 to –0.02‰) have δ98/95Mo values lower than those of MORB and DM. Several models have been proposed to explain the relatively low δ98/95Mo value in some arc samples, including the contribution of hydrous melt derived from sediment and/or oceanic crust, dehydration of slab components, and diapir of hydrous mantle melting (König et al., 2016; Li, H. Y. et al., 2021; Li, X. et al., 2021, Willbold and Messling, 2023).
The Izu arc is one of the ideal locations for geochemical studies of subduction zone processes. While distinct VFs are visible throughout the Izu arc, the N-Izu arc region is known to exhibit geochemical variations in the across-arc direction from the frontal arc to the RA regions, due to the continuous supply of aqueous fluids and/or melts from the subducting slab (e.g., Freymuth et al., 2016b; Hochstaedter et al., 2001; Ishikawa and Tera, 1999; Ishizuka et al., 2006; Kimura et al., 2010; Machida et al., 2008; Nohda et al., 1990; Parendo et al., 2022; Stern et al., 2003; Straub and Layne, 2003; Taylor and Nesbitt, 1998; Tollstrup et al., 2010). Recently, Villalobos-Orchard et al. (2020) found that volcanic rocks from the Izu Islands have variable Mo isotopic compositions. The authors calculated the Mo budgets in the Izu arc based on the abundances and isotopic compositions of Mo in the AMOC, sediments, and MORBs, and concluded that the contribution of slab-derived fluids became progressively smaller in the RA volcanoes (e.g., Niijima) than in the VF volcanoes (e.g., Izu-Oshima). However, there are no Quaternary volcanic islands erupting basaltic lavas in the RA region of the Izu arc with a deeper Pacific Plate subduction depth than Niijima (slab depth ≈ 133 km: Nakajima et al., 2009). Consequently, the behavior of the slab-derived fluid and the elements distributed therein in the RA region beyond the Niijima slab depth remains unclear.
In this study, we focused on basaltic enclaves from Kozushima Island (slab depth ≈ 151 km: Nakajima et al., 2009), Izu arc. Kozushima is located at the southwestern end of the N-Izu Islands and has a deeper slab depth than Niijima. Kozushima is a volcanic island formed by several rhyolite lava domes (Isshiki, 1982), while a small number of basaltic enclaves are contained in Membo lava (Isshiki, 1982; Taniguchi, 1977, 1990; Yamashita et al., 2005). Similar to the basaltic enclaves found in rhyolitic lavas at Niijima (Arakawa et al., 2019; Isshiki, 1987; Koyaguchi, 1986), the basaltic enclaves at Kozushima are thought to preserve the composition of a basaltic magma beneath Kozushima. The main objective of this study is to better understand the dehydration process of the subducting slab in the RA region of the N-Izu arc by analyzing the compositions of major elements, trace elements, and Mo isotopes in the Kozushima basaltic enclaves, as well as those in basalts from the other northern Izu arc islands.
The Izu arc is the northernmost segment of the Izu-Bonin-Mariana (IBM) arc in the western Pacific, formed by subduction of the Pacific Plate beneath the Philippine Sea Plate (Fig. 1). Previous geochemical studies have suggested that the Izu mantle source was modified by a slab component, with a high and variable contribution from slab-derived fluids, but minimal addition of partial melts of subducted sediments (e.g., Chauvel et al., 2009; Freymuth et al., 2016b; Kimura et al., 2010; Tamura et al., 2007; Taylor and Nesbitt, 1998; Villalobos-Orchard et al., 2020). Lavas from the Izu VF are characterized by high ratios of fluid-mobile to fluid-immobile elements (e.g., Kimura et al., 2010), while those from the RA lavas show moderate enrichments in fluid mobile elements and relatively low degrees of partial melting (e.g., Hochstaedter et al., 2001; Taylor and Nesbitt, 1998). Accordingly, the Izu VF lavas show variable but higher Ba/Th and lower La/Yb ratios than those of the RA samples. The characteristics of radiogenic Nd and Hf isotopes and depletions in high field strength elements (HFSEs) such as Zr, Hf, Nb, and Ta in the Izu VF samples indicate that these geochemical signatures reflect those of a depleted mantle source, whereas a slightly more isotopically enriched mantle could be present towards the RA region (e.g., Freymuth et al., 2016b; Hochstaedter et al., 2000, 2001; Tollstrup et al., 2010). The Izu VF samples are considered to represent high-degree mantle melting in the absence of sedimentary components, in contrast to lavas from the neighboring Mariana arc samples that have relatively high La/Sm values due to the contribution of sediment melts or subduction of seamounts (e.g., Elliott et al., 1997).
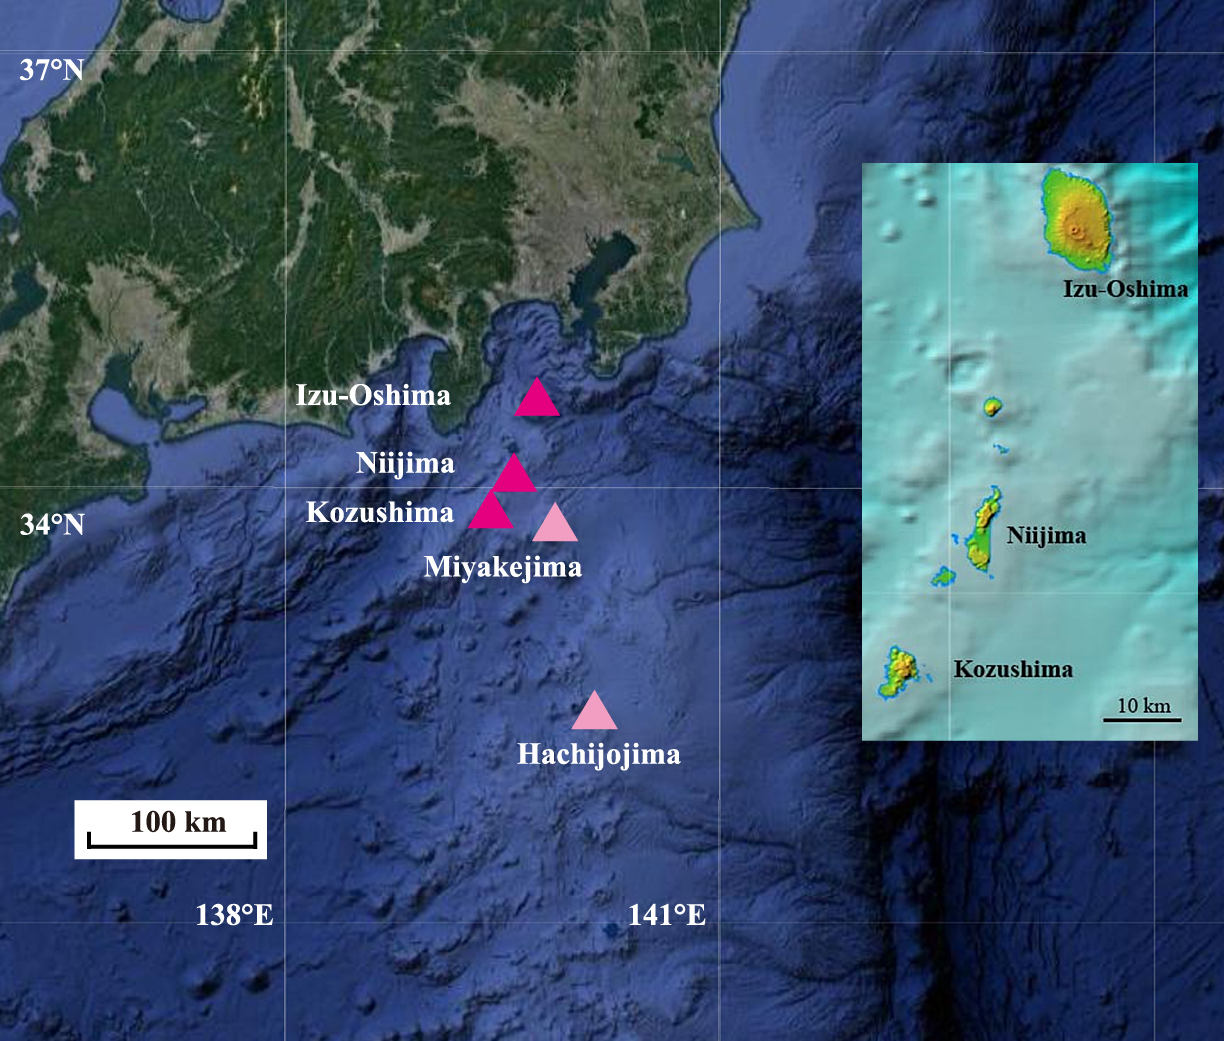
Map of eastern Japan and northern Izu arc. Modified from maps obtained from the following websites (https://gbank.gsj.jp/geonavi/geonavi.php, https://maps.gsi.go.jp/).
The N-Izu area is in many respects a typical oceanic arc, with clear across-arc geochemical variations (e.g., Kimura et al., 2010). The N-Izu arc lies on the northeastern extension of the Zenisu Ridge, which extends southwest from Izu-Oshima to Onbasejima, and contains the only RA volcanoes erupting above sea level in the entire IBM arc. The N-Izu arc is characterized by significant variation in the major lava types that form the volcanic islands in the VF and RA. Mafic lavas are found on Izu-Oshima in the VF and parts of the northern end of Toshima, Udonejima, and Niijima. Historically, the mafic lava samples in the N-Izu arc have been used to study geochemical variations in the across arc direction (e.g., Kimura et al., 2010). In contrast, in the RA region, most of the Niijima and Kozushima lavas are felsic in composition. The felsic lavas are considered to have been formed by remelting of lower to middle crust due to continuous input of basaltic magmas, or by differentiation of basaltic or andesitic magmas (Arakawa et al., 2019; Onuma et al., 1983; Tamura and Tatsumi, 2002; Tamura et al., 2009; Taniguchi et al., 1990). The differentiation processes make it difficult to decipher the components derived from the subducting slab and the mantle wedge in the N-Izu RA region by measuring the rhyolitic samples from Niijima and Kozushima.
Xenoliths in felsic lavas from the N-Izu arcMafic xenoliths in volcanic rocks preserve valuable petrological and geochemical information about the composition of the parent mafic magma and the differentiation processes during the early stages of magmatic evolution (e.g., Bacon and Metz, 1984; Beard, 1986). Most mafic xenoliths in volcanic rocks from island arc systems fall into three main categories: (1) cognate xenoliths that are indicative of magma mixing (e.g., Coulon et al., 1984; Koyaguchi, 1986), (2) plutonic blocks derived from middle to lower crustal sources (e.g., Aoki, 1971; Shimazu et al., 1991), and (3) cumulative rocks formed by crystallization and precipitation in magma reservoirs (e.g., Aoki and Kuno, 1972).
Volcanic products on Niijima contain various types of xenoliths, including volcanic xenoliths and enclaves (basaltic to andesitic composition) in rhyolitic pyroclastic flow deposits and lavas (e.g., Arakawa et al., 2019; Isshiki, 1987; Koyaguchi, 1986). At Niijima, plutonic xenoliths (e.g., diorite, tonalite, and gabbro) in basaltic pyroclastic flow deposits and rhyolitic units have been reported (e.g., Arakawa et al., 2017), which are considered to be the cumulates of basaltic and andesitic magmas. In contrast, Koyaguchi (1986) suggested that the basaltic enclaves at Niijima originated from a basaltic magma that was active contemporaneously with the host rhyolite. The andesitic enclaves are thought to be the result of magma mixing (or mingling) between rhyolitic and mafic magmas (Arakawa et al., 2019). The authors concluded that the andesitic enclaves at Niijima rose in a mixed state at the boundary between rhyolitic and basaltic magmas, while the basaltic enclaves rose through rhyolitic magma before mixing.
Rhyolitic lavas from Kozushima also contain xenoliths and/or enclaves of mafic to felsic compositions (e.g., Isshiki, 1982; Taniguchi, 1977; Yamashita et al., 2005). Andesitic xenoliths in Kozushima are either bedrock or oceanic crust trapped by the eruption of rhyolite lavas (Yamashita et al., 2005). Gabbroic and feldspathic xenoliths are found in the rhyolitic lava of Membo in Kozushima. These xenoliths are presumably fragments of oceanic crusts or cumulate from magma, since a group of monogenetic volcanoes erupted on several submarine floors around Kozushima at the time of the Membo lava eruption (Taniguchi, 1977). In contrast, Kozushima basaltic enclaves have island-arc trace element patterns showing enrichments of large ion lithophile elements (LILEs) such as Ba, Rb, K, and Sr, and depletions of HFSEs such as Nb, Zr, and Ti (Taniguchi et al., 1990). In addition, as shown in Fig. 2, Kozushima basaltic enclaves retain porphyritic structure. Such microstructures observed in Kozushima basaltic enclaves are typical features of these volcanic rocks, similar to those of Niijima basaltic enclaves, and different from those of Niijima gabbroic captive rocks (Arakawa et al., 2019; Koyaguchi, 1986).

Photographs and photomicrograph of basaltic enclave from Kozushima rhyolitic lava. (a) Kozushima basaltic enclave (center) in Membo rhyolitic lava. (b) Kozushima basaltic enclave (KZ1_042603). (c) Basaltic enclave (open nicol). (d) Basaltic enclave (cross nicol).
In this study, we examined the basaltic samples (SiO2 <53 wt.%) from Izu-Oshima, Niijima, and Kozushima. Izu-Oshima volcano is located on the VF of the Izu-Bonin arc, under which the Pacific Plate is subducting (Fig. 1). Kawanabe (1998) suggested that the volcanic activity of Izu-Oshima began at about 30–40 ka, and the volcanic edifice was built on Late Pliocene–Pleistocene basaltic volcanoes. The activity is broadly divided into pre-caldera (>1.5 ka) and syn- and post-caldera (<1.5 ka) volcanic periods (Nakamura, 1964; Isshiki, 1984; Kawanabe, 1998). Products of the younger syn- and post-caldera volcanism (Younger Oshima Group; YOG) consist of the Sashikiji Formation (S1 and S2), the Nomashi Formation (N1–N4), and the Yuba Formation (Y1–Y6). The largest eruption in the YOG and Y1 produced lava flows (Y1L) and two types of scoria fall deposits (Y1Ca, Y1Cb; Misonou et al., 2005). The Y1 eruption was followed by relatively large eruptions in 1876–77, 1912–14, 1950–51, and 1986–87. The 1986–1987 eruption is divided into a summit crater eruption (1986–1987a) and subsequent eruptions from the caldera floor and flank of the volcano (1986–1987b and 1986–1987c). In this study, we used basaltic samples from ten different stages (N1, Y1L, Y1Ca, Y1Cb, Y2–Y5, 1950–1951, 1986–1987a), all of which were studied in Kuritani et al. (2018).
Niijima volcano is the largest volcanic island located in the RA region of N-Izu (Fig. 1). Three volcanic islands near Niijima volcano, Jinaijima in the west and Shikinejima and Hanshima in the south, are composed of rhyolitic volcanoes. Niijima volcano consists mainly of 13 monogenetic rhyolitic volcanoes and one basaltic and one andesitic volcanoes (Isshiki, 1987). Eruptions of andesite (mainly as pyroclastic rocks from Shimawakezawa volcano at 40–30 ka) and basalt (Wakago volcano at 3.6 ka) are limited within the rhyolite-dominated Niijima volcano. In this study, we used a basaltic enclave sample from Niijima volcano.
Kozushima volcano, located southwest of Niijima, is composed entirely of rhyolitic lava, including nearby Tadanaejima (to the east) and Onbasejima (to the west). Kozushima volcano is mainly composed of 16 monogenetic rhyolitic volcanoes (Isshiki, 1982), which have gradually developed at Kozushima (e.g., Taniguchi et al., 1990; Yokoyama et al., 2004). Among these rhyolitic volcanoes, the most commonly reported xenoliths/enclaves are found in the Membo lava, which was active at a relatively early stage of 35–37 ka (ESR ages, Yokoyama et al., 2004) (Fig. 2). In this study, we used six basaltic enclaves found in the Membo lava.
In addition to the samples collected from the three islands (Izu-Oshima, Niijima, and Kozushima), we used the rock reference materials of BHVO-2 (Hawaiian basalt, US Geological Survey), JB-2 (Izu-Oshima basalt, Geological Survey of Japan), and JB-3 (Mt. Fuji basalt, Geological Survey of Japan) to confirm the accuracy of the analytical techniques.
High-purity water (18.2 MΩ cm) was prepared using a water purification system (Milli-Q Integral 5; Merck-Millipore). Atomic absorption spectroscopy (AAS) grade HF (48%; Kanto Chemical), Electronic industry (EL) grade HNO3 (16 mol/L; Matsunoen Chemicals), EL grade HCl (12 mol/L; Mitsubishi Chemical), and TAMAPURE AA-100 grade HClO4 (12 mol/L; Tama Chemical) were used without distillation for the digestion of rock samples. For the chemical separation of Mo by anion exchange chromatography, AAS grade 48% HF and EL grade 16 mol/L HNO3, EL grade 12 mol/L HCl were distilled using a two-bottle PFA distillation system.
The 113In-203Tl and 91Zr-179Hf spike solutions were used for trace element analysis, the isotopic compositions of which were determined in Yokoyama et al. (2017) and Kagami and Yokoyama (2021), respectively. In this study, a 97Mo-100Mo double spike (DS) solution was prepared using 97Mo- and 100Mo-enriched tracers obtained from Oak Ridge National Laboratory. The isotopic composition of the double spike was calibrated against that of the Mo isotopic standard NIST SRM 3134 (Song et al., 2017). The Mo concentration of the double spike was determined using a mixed standard solution XSTC-4043-100 (SPEX CertiPrep).
Measurement of major and trace element abundancesRock samples were powdered using an agate mortar and pestle for major elements, trace elements, and Mo isotope analyses. Since the rock samples may have been affected by weathering, the sample surface was cut and then the fresh inner portion of the sample was powdered using only the inner portion of the rock sample. For major element measurements, the powdered sample was heated at 950°C for 12 h and fused with an alkali flux (Li2B4O7) at a sample: flux ratio of 1:10 to produce a glass bead. The abundances of ten major elements (SiO2, TiO2, Al2O3, Fe2O3, MnO, MgO, CaO, Na2O, K2O, and P2O5) were measured using an X-ray fluorescence (XRF) spectrometer (RIX 2100, Rigaku) installed at Tokyo Institute of Technology (Tokyo Tech) following the method described in Asaah et al. (2015).
Trace element abundances of the rock samples were determined by inductively coupled plasma mass spectrometry (ICP-MS) using the methods described in Kagami and Yokoyama (2021) and Yokoyama et al. (2017). The outline of the procedure is briefly described here. For basaltic samples, 50 to 100 mg of sample powder was weighed into a clean PFA vial (7 mL) and mixed with two spike solutions enriched in 113In-203Tl and 91Zr-179Hf, respectively. The sample was digested in a mixture of HF and HNO3 at 120°C on a hotplate overnight. After sample digestion, the solution was evaporated to dryness and then dissolved in 5 mL 0.5 M HF. The sample solution was thoroughly homogenized by agitating in an ultrasonic bath and then divided into two fractions: 1 mL for the measurement of high field strength elements (HFSEs: Zr, Nb, Hf and Ta), and 4 mL for Rb, Sr, Y, Cs, Ba, rare earth elements (REEs), Pb, Th, and U. The 1 mL aliquot was centrifuged for 30 min, after which the supernatant was used for the measurement of HFSEs using a quadrupole ICP-MS instrument (X-series II, Thermo Fisher Scientific) installed at Tokyo Tech. The other 4 mL aliquot was dried on the hotplate at 120°C overnight. The sample was dissolved in HClO4 and heated to dryness in a stepwise fashion (120°C, 165°C, and 195°C) to decompose insoluble fluorides. This step was repeated twice. After treatment with 6 M HCl, the sample was finally dissolved in 0.5 M HNO3 for measurement of Rb, Sr, Y, Cs, Ba, REEs, Pb, Th, and U by quadrupole ICP-MS.
Determination of the abundance and isotope ratio of Mo by N-TIMSPowdered samples (50–270 mg) were weighed and mixed with the 97Mo-100Mo DS solution to achieve approximately a 1:1 molar ratio of Mo in the sample and in the spike. The spiked sample was digested with a mixture of HF and HNO3 at 120°C on a hotplate overnight. After sample digestion, the solution was evaporated to dryness. The residue was dissolved in 2 M HF and centrifuged for 30 min to separate the supernatant and fluoride precipitate. The supernatant was then transferred to another clean Teflon vial. The solution was evaporated to dryness and then dissolved in 1 mL 0.4 M HCl–0.5 M HF for the separation of Mo by ion exchange chromatography (Nagai and Yokoyama, 2014). The first column chemistry procedure was performed using 1 mL anion exchange resin (Eichrom 1X8, 200–400 mesh) to separate Mo from Ti, Zr, Hf, and W. Since the obtained Mo fraction contained Zn, Nb, and trace amounts of W, we performed the second column chemistry procedure using 0.1 mL Eichrom 1X8 (Nagai and Yokoyama, 2014), which was repeated twice to improve the purity of Mo. After chemical separation, the sample was dissolved in 1 μL of 1 M HCl and loaded onto a pre-degassed zone-refined Re ribbon (99.999%; thickness = 0.0305 mm, width = 0.750 mm; H. Cross, USA). The sample solution was dried on the ribbon and then covered with 1 μL of an activator (LaNO3 dissolved in 1 M HNO3; La = 1 mg/g). The ratio of Mo to La on the filament was set at 1:10, and the amount of sample Mo used for a single isotopic measurement ranged from 100 to 200 ng. The Mo isotopes were measured using a double filament assembly in which an ionization filament (zone refined Re ribbon) coated with 1 μL of the activator was placed next to the sample filament. In some cases, when a sufficient amount of Mo (>100 ng) was collected, the Mo isotopes were measured using the single filament assembly.
The Mo abundances and isotope ratios in the rock samples were determined using the DS technique coupled with negative thermal ionization mass spectrometry (N-TIMS). The TIMS instrument (TRITON plus; Thermo Fisher Scientific) installed at Tokyo Tech was used in this study. For isotopic measurement, the current of the ionization filament was first increased at a rate of 50 mA/min to 1000 mA. Then the ionization and sample filaments were heated to 1700 and 700 mA, respectively, at a rate of 30 mA/min, and both were gradually heated to 1850 mA at 15 mA/min and 1600 mA at 30 mA/min. The ionization and sample filament currents were conditioned to approximately 2000–2100 mA prior to the start of data acquisition, at which the typical beam intensity of 97MoO3– reached around 0.2 V. For single filament measurements, the sample filament was heated in the same manner as the sample filament for double filament analysis.
In both cases of single and double filament assemblies, Mo isotopes were acquired in static multicollection mode using nine Faraday cups with the following cup configuration: L4: 92Mo16O3–, L3: 94Mo16O3–, L2: 95Mo16O3–, L1: 96Mo16O3–, C: 97Mo16O3–, H1: 98Mo16O3–, H2: 100Mo16O3–, H3: 100Mo16O217O–, H4: 100Mo16O218O–. A data acquisition consisted of an integration time of 16.667 s/cycle, 20 cycles/block, and 9 blocks/run. The baselines of the Faraday cups were measured for 30 s before the start of each block. Gain calibration was performed once a day before the start of the measurement session. A single sample measurement took approximately 3 hours including filament heating. After data acquisition, the Mo isotope ratio of the sample, (98Mo/95Mo)sample, was determined using the double spike calculation protocol of Siebert et al. (2001).
The performance of our double spike N-TIMS procedure was evaluated by measuring three geological reference materials, BHVO-2, JB-2, and JB-3. The resulting Mo abundances and Mo isotope ratios in the reference materials are summarized in Table 1 and are consistent with those of previous studies.
Mo isotope ratio and Mo abundance of standards (BHVO-2, JB-2, JB-3)
| BHVO-2 | JB-2 | JB-3 | ||||
|---|---|---|---|---|---|---|
| this study | ref a | this study | ref b, c | this study | ref d | |
| Mo composition | ||||||
| N | 21 | 48 | 11 | 8b | 13 | |
| Mo [μg/g] | 4.39 | 4.2 | 1.01 | 0.94 | 1.08 | 1.09 |
| 2SE | 0.65 | 1.8 | 0.03 | 0.26 | 0.02 | |
| N | 21 | 48 | 11 | 23c | 13 | |
| δ98/95Mo (‰) | –0.05 | –0.07 | 0.04 | 0.03 | –0.17 | |
| 2SE | 0.11 | 0.04 | 0.05 | 0.06 | 0.04 | |
b Villalobos-Orchard et al. (2020)
c Willbold and Messling (2023)
Uncertainties in Mo concentration of N-Izu arc samples are the 2-standard error (2SE) of multiple sample measurement. Mo isotope ratios are reported as permil deviations from the NIST3134 Mo standard. Uncertainties in δ98/95Mo of N-Izu arc samples are the 2SE of multiple sample measurements.
The major element abundances of the Kozushima basaltic enclaves obtained in this study are similar to those of previous studies (Fig. 3; Isshiki, 1982; Taniguchi et al., 1990; Yamashita et al., 2005). Almost all of the N-Izu lavas (Izu-Oshima, Niijima, Kozushima) plot as subalkaline basaltic suite on the total alkali content (Fig. 3a). The N-Izu RA islands (Toshima, Udonejima, Niijima) have slightly higher total alkalis than the VF islands (Izu-Oshima, Miyakejima, Hachijojima, Izu-Torishima). It has been suggested that total alkali contents tend to increase from VF to RA regions, corresponding to the increasing depth of the Pacific Plate in the N-Izu arc (Fig. 3f; Kimura et al., 2010). Kozushima basaltic enclaves also had a higher total alkali content than VF and the other RA islands (Fig. 3a, f). As shown in Fig. 3b, most of the VF Izu arc lavas are plotted in the low-K field (Peccerillo and Taylor, 1976). In contrast, the RA lavas are plotted around the low- and medium-K boundary, and all of the Kozushima basaltic enclaves are plotted in the medium-K field. The Al2O3 contents of the RA lavas are higher than those of Izu-Oshima, which is consistent with the Kuno’s high-alumina basalt (Kuno, 1960; Fig. 3c). As shown in Fig. 3g, Kozushima basaltic enclaves have higher Al2O3 contents (≥17%) than Niijima lavas (~16%) and are comparable to Toshima basalts, which have the highest Al2O3 contents (Kimura et al., 2010).

Correlation diagrams for major element abundances (as oxide) of samples from Izu arc islands and knolls. Blue squares: Izu-Oshima (filled: this study and Kuritani et al. (2018) / open: Fukuda et al., 2008; Kimura et al., 2010), yellow triangles: Toshima (Isshiki, 1978; Kimura et al., 2010), purple circles: Udonejima (Isshiki, 1987; Kimura et al., 2010), green diamonds: Niijima (filled: this study / open: Arakawa et al., 2017, 2019; Fukuda et al., 2008; Kimura et al., 2010; Koyaguchi, 1986) red triangles: Kozushima (filled: this study / open: Isshiki, 1982; Taniguchi et al., 1990; Yamashita et al., 2005), light green crosses: Teishi knoll (Fukuda et al., 2008), gray circles: Miyakejima (Freymuth et al., 2016b; Fukuda et al., 2008; Yokoyama et al., 2003), indigo blue circles: Hachijojima and nearby seamount chains (Ishizuka et al., 2008; Nakano et al., 1997; Oiwa et al., 2023), gray squares: Izu-Torishima (Tamura et al., 2007). The boundary between low- and medium-K on a K2O versus SiO2 is based on Peccerillo and Taylor (1976). The boundary between tholeiitic (TH) and calc-alkaline (CA) basalts is based on Miyashiro (1974). The Pacific slab depth (Wadati Benioff Zone) of each N-Izu islands is based on Nakajima et al. (2009), Obana et al. (2010), and Saito (2017).
Except for some samples in Udonejima, the FeO*/MgO diagram (Fig. 3d) shows that nearly all Izu arc volcanoes have tholeiitic affinities (Miyashiro, 1974). Among these samples, Toshima, Udonejima, Kozushima samples have low FeO*/MgO value for a given SiO2. On the other hand, Niijima basalts have FeO*/MgO values similar to those of the VF volcanoes, unlike samples from the other islands in the RA. The relatively high MgO content (>5%) and low FeO*/MgO (<2) suggest that the Kozushima basaltic enclaves were less affected by olivine fractional crystallization from the parental magma (Fig. 3d, e).
Trace elementsIn the N-MORB normalized trace element abundance diagram (Fig. 4), the Izu-Oshima, Niijima, and Kozushima basalts have positive spikes for Cs, Ba, U, Pb, and Sr, indicative of island arc volcanic rocks. These features are ubiquitous in late Cenozoic VF lavas from elsewhere along the Izu arc (e.g., Ishizuka et al., 2006; Kimura et al., 2010; Tamura et al., 2007). The trace element signature observed in the Kozushima basaltic enclaves suggests the least involvement of crustal or oceanic basement basaltic rocks during the eruption of the host rhyolite, which is similar to the case of the Niijima basaltic enclaves (Arakawa et al., 2019; Koyaguchi, 1986). The abundances of LILE and LREEs in the Izu-Oshima basalts are lower than those in the RA samples, while the abundances of Zr and Hf in the VF samples overlap those in the RA samples. The RA basalts show increased abundances of REEs with strong depletions in HFSEs relative to LREEs and LILEs. The abundances of U, Th, and LREEs increase with increasing depth of the Pacific Plate, and the Kozushima basalts are enriched in Cs, Ba, Pb, and Sr relative to Niijima.

Trace element abundances normalized by N-MORB (Sun and McDonough, 1989) for samples from the N-Izu arc. Blue lines: Izu-Oshima (Kuritani et al., 2018, this study), green line: Niijima (this study), and red lines: Kozushima (this study).
The VF volcanoes are characterized by high (Ba/Th)N and (Pb/Ce)N ratios compared to those of the RA volcanoes and knolls, where the subscript N indicates the ratio normalized to the primitive mantle (PM) value of Sun and McDonough (1989) (Fig. 5a). Since Ba and Pb are more fluid mobile than Th and Ce (Pearce et al., 2005; Peate et al., 1997), the contribution of slab-derived fluids is relatively small for RA samples with deeper slab depths than VF samples (e.g., Shibata and Nakamura, 1997). The (Zr/Hf)N ratio shows no systematic change between VF and RA samples, while the (La/Yb)N, (Nb/Zr)N, and (Nb/Yb)N ratios show considerable changes with a systematic increase from VF to RA (Fig. 5b–d), suggesting different degrees of partial melting of compositionally similar sources.

Correlation diagrams of N-MORB normalized trace element ratios for the samples from Izu arc islands and knolls (Arakawa et al., 2017, 2019; Fukuda et al., 2008; Ishizuka et al., 2008; Kimura et al., 2010; Kuritani et al., 2018; Nakano et al., 1997; Oiwa et al., 2023; Tamura et al., 2007; Yokoyama et al., 2003, this study). Trace element abundances of N-MORB were taken from Sun and McDonough (1989).
The abundances and δ98/95Mo values of the Izu arc lavas are summarized in Table 2 and Fig. 6 together with selected geochemical data. The mean Mo abundances in the N-Izu basalts measured in this study decrease from Izu-Oshima (0.71 ± 0.16 μg/g, N = 10, 2s) in the VF region to Niijima (0.38 ± 0.01 μg/g, N = 1) and Kozushima (0.46 ± 0.21 μg/g, N = 6, 2s) in the RA region, which are similar to previous results for basalts from Izu-Oshima (0.70 ± 0.10 μg/g, N = 4, 2s) and Niijima (0.38 μg/g, N = 2) (Villalobos-Orchard et al., 2020). The higher Mo abundances in VF basalts compared to RA basalts are generally consistent with the observation from previous studies that Mo abundances tend to decrease with increasing slab depth (e.g., Villalobos-Orchard et al., 2020), but the Kozushima basalts have slightly higher Mo abundances than the Niijima basalt.
Mo isotope ratio and Mo abundance of N-Izu arc samples
| Sample | Izu-Oshima | Niijima | Kozushima | ||||||||||||||
|---|---|---|---|---|---|---|---|---|---|---|---|---|---|---|---|---|---|
| IzOs-23g | IzOs-a07-17 | IzOs-a06-1 | IzOs-a06-3 | IzOs-a06-4b | IzOs-0902-4 | IzOs-a07-14 | IzOs-a07-6 | IzOs-a08-8 | IzOs-a07-5 | Enclave | KZ1042603 | KZ1042604 | KZ1042607 | KZ2110401-1 | KZ2110403 | KZ2110406 | |
| Stage | 1986–87a | 1950–51 | Y1L | Y1Cb | Y1Ca | Y2 | Y3 | Y4 | Y5 | N1 | |||||||
| Major element (wt. %) | |||||||||||||||||
| SiO2 | 52.37 | 52.67 | 52.39 | 51.53 | 52.31 | 52.01 | 52.06 | 51.74 | 51.54 | 51.17 | 50.56 | 51.69 | 51.06 | 51.30 | 51.06 | 51.74 | 52.40 |
| TiO2 | 1.19 | 1.18 | 1.31 | 1.10 | 1.22 | 1.24 | 1.27 | 1.24 | 1.30 | 1.22 | 1.16 | 0.99 | 1.01 | 1.02 | 0.98 | 0.96 | 0.93 |
| Al2O3 | 14.75 | 14.53 | 13.69 | 16.79 | 14.94 | 13.97 | 13.94 | 13.91 | 13.64 | 14.22 | 16.84 | 17.92 | 18.40 | 17.91 | 17.96 | 17.83 | 17.66 |
| Fe2O3* | 14.22 | 14.39 | 15.37 | 13.08 | 14.39 | 14.97 | 15.38 | 15.40 | 15.60 | 14.80 | 13.56 | 10.30 | 10.49 | 10.43 | 10.04 | 9.85 | 9.53 |
| MnO | 0.21 | 0.22 | 0.23 | 0.20 | 0.22 | 0.22 | 0.23 | 0.23 | 0.23 | 0.22 | 0.22 | 0.15 | 0.16 | 0.16 | 0.16 | 0.15 | 0.15 |
| MgO | 4.70 | 4.47 | 4.71 | 4.23 | 4.55 | 4.78 | 4.75 | 5.07 | 4.86 | 5.17 | 5.17 | 5.42 | 5.64 | 5.17 | 5.37 | 5.00 | 5.04 |
| CaO | 10.07 | 9.59 | 9.35 | 10.57 | 9.86 | 9.58 | 9.54 | 9.54 | 9.49 | 9.84 | 10.40 | 10.70 | 10.65 | 10.57 | 10.72 | 10.05 | 10.19 |
| Na2O | 1.92 | 2.00 | 2.01 | 1.91 | 1.97 | 2.00 | 2.01 | 1.91 | 1.99 | 1.89 | 2.51 | 2.32 | 2.87 | 2.61 | 2.59 | 2.63 | 2.70 |
| K2O | 0.43 | 0.43 | 0.45 | 0.37 | 0.41 | 0.44 | 0.42 | 0.41 | 0.43 | 0.40 | 0.35 | 0.62 | 0.57 | 0.69 | 0.57 | 0.67 | 0.74 |
| P2O5 | 0.10 | 0.11 | 0.11 | 0.09 | 0.10 | 0.10 | 0.10 | 0.10 | 0.11 | 0.10 | 0.14 | 0.06 | 0.12 | 0.07 | 0.14 | 0.12 | 0.13 |
| Total | 99.96 | 99.57 | 99.63 | 99.86 | 99.98 | 99.31 | 99.70 | 99.55 | 99.18 | 99.03 | 100.90 | 100.20 | 100.99 | 99.92 | 99.58 | 99.02 | 99.46 |
| LOI | –0.67 | –0.46 | –0.55 | –0.28 | –0.62 | –0.48 | –0.24 | –0.30 | –0.56 | –0.41 | 0.47 | 0.58 | 0.67 | 0.06 | 0.05 | 0.07 | |
| Trace elements (ppm) | |||||||||||||||||
| Rb | 7.81 | 6.65 | 7.11 | 6.69 | 6.57 | 6.24 | 7.34 | 6.66 | 6.30 | 6.73 | 5.93 | 9.09 | 7.77 | 8.85 | 7.92 | 9.66 | 9.05 |
| Sr | 179.49 | 174.71 | 172.75 | 193.60 | 182.99 | 170.05 | 175.73 | 173.57 | 173.87 | 175.94 | 305.87 | 459.60 | 463.23 | 444.54 | 457.80 | 452.93 | 427.74 |
| Y | 24.08 | 24.65 | 25.25 | 23.81 | 25.35 | 20.64 | 24.46 | 23.41 | 25.69 | 24.26 | 19.40 | 15.12 | 15.78 | 13.35 | 13.33 | 14.77 | 15.73 |
| Zr | 49.17 | 49.90 | 50.98 | 43.85 | 48.48 | 43.18 | 49.76 | 47.77 | 50.60 | 47.57 | 44.39 | 55.97 | 54.95 | 54.37 | 47.20 | 53.58 | 51.52 |
| Nb | 0.43 | 0.46 | 0.47 | 0.45 | 0.46 | 0.49 | 0.54 | 0.48 | 0.47 | 0.46 | 1.22 | 1.61 | 1.52 | 1.67 | 1.36 | 1.64 | 1.61 |
| Cs | 0.80 | 1.00 | 0.83 | 0.71 | 0.83 | 0.81 | 1.12 | 0.71 | 0.84 | 0.73 | 0.35 | 0.46 | 0.40 | 0.38 | 0.32 | 0.52 | 0.43 |
| Ba | 213.37 | 219.01 | 231.57 | 186.91 | 213.23 | 208.72 | 226.93 | 208.73 | 224.33 | 207.85 | 98.09 | 143.80 | 132.29 | 133.56 | 124.09 | 152.88 | 157.97 |
| La | 2.16 | 2.27 | 2.21 | 1.79 | 2.31 | 2.10 | 2.43 | 2.07 | 2.33 | 2.14 | 3.86 | 6.70 | 7.25 | 5.94 | 5.68 | 7.08 | 7.57 |
| Ce | 6.26 | 6.66 | 6.40 | 5.16 | 6.73 | 6.21 | 7.33 | 6.12 | 6.98 | 6.32 | 10.30 | 15.01 | 14.10 | 13.88 | 13.22 | 15.78 | 15.35 |
| Pr | 1.10 | 1.17 | 1.14 | 0.90 | 1.17 | 1.10 | 1.28 | 1.04 | 1.19 | 1.08 | 1.64 | 2.34 | 2.53 | 2.08 | 2.04 | 2.42 | 2.36 |
| Nd | 6.24 | 6.63 | 6.41 | 5.01 | 6.78 | 6.17 | 7.30 | 6.04 | 6.91 | 6.32 | 8.57 | 11.17 | 11.83 | 9.92 | 9.79 | 11.42 | 11.15 |
| Sm | 2.26 | 2.28 | 2.28 | 1.78 | 2.35 | 2.21 | 2.55 | 2.10 | 2.39 | 2.14 | 2.58 | 2.87 | 3.03 | 2.59 | 2.57 | 2.90 | 2.81 |
| Eu | 0.81 | 0.84 | 0.82 | 0.66 | 0.88 | 0.80 | 0.96 | 0.80 | 0.88 | 0.81 | 1.03 | 0.97 | 0.98 | 0.87 | 0.86 | 0.96 | 0.93 |
| Gd | 3.09 | 3.34 | 3.31 | 2.58 | 3.38 | 3.21 | 3.70 | 3.10 | 3.45 | 3.13 | 3.30 | 3.13 | 3.29 | 2.79 | 2.77 | 3.24 | 3.17 |
| Tb | 0.58 | 0.59 | 0.59 | 0.46 | 0.60 | 0.57 | 0.67 | 0.56 | 0.62 | 0.56 | 0.56 | 0.48 | 0.51 | 0.43 | 0.43 | 0.50 | 0.49 |
| Dy | 4.02 | 4.14 | 4.01 | 3.13 | 4.20 | 3.90 | 4.63 | 3.84 | 4.22 | 3.84 | 3.85 | 3.01 | 3.26 | 2.74 | 2.72 | 3.16 | 3.12 |
| Ho | 0.87 | 0.88 | 0.87 | 0.67 | 0.89 | 0.84 | 0.99 | 0.83 | 0.90 | 0.83 | 0.82 | 0.61 | 0.67 | 0.56 | 0.56 | 0.65 | 0.67 |
| Er | 2.63 | 2.61 | 2.65 | 2.05 | 2.64 | 2.56 | 2.98 | 2.45 | 2.70 | 2.46 | 2.41 | 1.76 | 1.94 | 1.61 | 1.61 | 1.91 | 1.98 |
| Tm | 0.39 | 0.38 | 0.39 | 0.30 | 0.39 | 0.38 | 0.44 | 0.35 | 0.40 | 0.36 | 0.35 | 0.25 | 0.28 | 0.23 | 0.23 | 0.28 | 0.28 |
| Yb | 2.63 | 2.59 | 2.62 | 2.02 | 2.65 | 2.55 | 2.88 | 2.43 | 2.67 | 2.48 | 2.30 | 1.61 | 1.83 | 1.48 | 1.49 | 1.80 | 1.81 |
| Lu | 0.40 | 0.40 | 0.40 | 0.31 | 0.40 | 0.39 | 0.45 | 0.38 | 0.41 | 0.38 | 0.35 | 0.25 | 0.28 | 0.22 | 0.22 | 0.27 | 0.28 |
| Hf | 1.39 | 1.44 | 1.41 | 1.22 | 1.45 | 1.46 | 1.65 | 1.40 | 1.51 | 1.39 | 1.23 | 1.68 | 1.64 | 1.66 | 1.32 | 1.47 | 1.44 |
| Ta | 0.03 | 0.04 | 0.04 | 0.04 | 0.04 | 0.04 | 0.04 | 0.04 | 0.04 | 0.04 | 0.08 | 0.11 | 0.10 | 0.10 | 0.09 | 0.12 | 0.12 |
| Pb | 4.38 | 8.29a | 10.74a | 11.32a | 3.51 | 4.28 | 5.41 | 3.95 | 3.37 | 3.14 | 2.25 | 5.61 | 3.44 | 4.15 | 1.81 | 5.22 | 6.27 |
| Th | 0.25 | 0.27 | 0.27 | 0.25 | 0.27 | 0.25 | 0.31 | 0.25 | 0.27 | 0.26 | 0.42 | 0.79 | 0.75 | 0.72 | 0.68 | 0.99 | 1.02 |
| U | 0.15 | 0.16 | 0.16 | 0.14 | 0.16 | 0.15 | 0.18 | 0.19 | 0.17 | 0.15 | 0.17 | 0.30 | 0.48 | 0.27 | 0.22 | 0.37 | 0.42 |
| Mo composition | |||||||||||||||||
| N | 4 | 2 | 3 | 3 | 5 | 4 | 4 | 5 | 5 | 2 | 6 | 3 | 5 | 3 | 1 | 1 | 1 |
| Mo [μg/g] | 0.68 | 0.73 | 0.86 | 0.60 | 0.73 | 0.70 | 0.78 | 0.73 | 0.72 | 0.59 | 0.38 | 0.64 | 0.42 | 0.47 | 0.32 | 0.45 | 0.43 |
| 2SE | 0.10 | 0.03 | 0.02 | 0.18 | 0.00 | 0.01 | 0.09 | 0.01 | 0.06 | 0.01 | 0.01 | 0.00 | 0.01 | 0.00 | 0.00 | 0.00 | 0.00 |
| δ98/95Mo (‰) | 0.14 | 0.08 | 0.02 | 0.13 | 0.09 | 0.16 | 0.06 | 0.10 | 0.14 | 0.16 | –0.14 | –0.09 | –0.37 | –0.22 | –0.09 | –0.23 | –0.20 |
| 2SE | 0.06 | 0.05 | 0.18 | 0.32 | 0.11 | 0.14 | 0.17 | 0.09 | 0.12 | 0.15 | 0.05 | 0.08 | 0.16 | 0.23 | 0.05 | 0.05 | 0.05 |
LOI: loss of ignition, Fe2O3*: total FE reported as Fe2O3
Major and trace element abundances of Niijima and Kozushima (this study) and Izu-Oshima are obtained from Kuritani et al. (2018). Mo isotope ratios are reported as permil deviations from the NIST3134 Mo standard. Uncertainties in δ98/95Mo of N-Izu arc samples are the 2-standard error (2SE) of multiple sample measurements for either the sample or JB-2 (±0.05‰), whichever is larger.
a These concentrations probably reflect contamination associated with human activities.

Mo abundances and isotopic ratios in the Izu arc. Literature data for Izu arc samples are from Ishizuka et al. (2008), Freymuth et al. (2015), Kimura et al. (2010), Tamura et al. (2007), and Villalobos-Orchard et al. (2020). The δ98/95Mo value of the depleted mantle (DM) from McCoy-West et al. (2019), and the abundances of the other elements in the DM are from Salters and Stracke (2004). Geochemical data for Izu sediments (average of ODP sites 800, 801, 802, 1149) are from Plank et al. (2007). Mo (μg/g) and δ98/95Mo (‰) values in Izu sediments are from Freymuth et al. (2015). Geochemical data of ODP Site 801 AMOC are from Freymuth et al. (2015) and Kelley et al. (2003).
The δ98/95Mo values of the VF basalts (Izu-Oshima: δ98/95Mo = 0.02–0.16‰, N = 10) were higher than the mean MORB value (δ98/95Mo ≈ –0.17‰: Bezard et al., 2016; Chen et al., 2022; Hin et al., 2022). The mean δ98/95Mo value of the Izu-Oshima samples measured in this study (δ98/95Mo = 0.11 ± 0.09‰, N = 10, 2s) is consistent with that of the previous study (δ98/95Mo = 0.07 ± 0.09‰, N = 4, 2s; Villalobos-Orchard et al., 2020), while the variation in the δ98/95Mo value of these samples is larger than that of the previous study. The δ98/95Mo values of Niijima (–0.14 ± 0.05‰, N = 1) measured in this study were consistent with those of the previous study (δ98/95Mo = –0.15 ± 0.07‰, N = 2, 2s; Villalobos-Orchard et al., 2020). The mean δ98/95Mo value of Kozushima (δ98/95Mo = –0.20 ± 0.21‰, N = 6, 2s) is similar to those of basaltic samples from Kamchatka back arc (δ98/95Mo = –0.22 ± 0.09‰, N = 10, 2s; Willbold and Messling, 2023), as well as N-MORB (δ98/95Mo ≈ –0.17‰; Bezard et al., 2016; Chen et al., 2022; Hin et al., 2022) and DM (δ98/95Mo ≈ –0.20‰; McCoy-West et al., 2019). Notably, the δ98/95Mo values of the Kozushima basalts are the lowest among all the N-Izu samples measured in this study and previous studies.
The major element abundances of the Kozushima basaltic enclaves are plotted in the range of the N-Izu RA region (Fig. 3) with K2O and MgO contents higher and lower than MORBs, respectively (Wilson, 1989). These characteristics are inconsistent with those of oceanic crustal xenoliths but likely indicate that these rocks were formed by the activity of a basaltic magma, as has been suggested for the origin of basaltic enclaves in rhyolite lavas from Niijima (Arakawa et al., 2019; Koyaguchi, 1986). The Kozushima basaltic enclaves also show features typical of rapid cooling, as evidenced by the abundant occurrence of acicularic groundmass crystals and spherulitic texture, the same as in the Wakago basaltic enclave (Koyaguchi, 1986; Fig. 2). Additionally, the major element abundances of the Kozushima basaltic enclaves are different from those of the Niijima basalts. Although the Niijima and Kozushima basaltic enclaves appear to be plotted on a single differentiation trend in the MgO versus SiO2 diagram (Fig. 3e), they are generally distinct with respect to the abundances of TiO2, Al2O3, and Na2O + K2O, as well as FeO*/MgO (Fig. 7a–d). From the above discussion, the Kozushima basaltic enclaves are hereafter defined as “Kozushima basalts”, which represent the basaltic magma activity beneath Kozushima.

Correlation diagram of major element abundance (as oxide) of the Niijima and Kozushima basaltic samples (SiO2 <53%). Literature data are from Arakawa et al. (2017, 2019), Fukuda et al. (2008), Isshiki (1982, 1987), Kimura et al. (2010), Koyaguchi (1986), Taniguchi et al. (1990), and Yamashita et al. (2005).
The Kozushima basalts have an arc volcano-like trace element pattern with enrichments and depletions in fluid mobile elements (e.g., Cs, Rb, Ba, U, Pb, and Sr) and immobile elements (e.g., Nb, Ta, Zr, and Hf), respectively (Fig. 4), corroborating that they were derived from a basaltic magma beneath Kozushima associated with slab dehydration in the Izu arc subduction zone. Most of the N-Izu basalts including the Kozushima basalts have nearly uniform (Zr/Hf)N ratios regardless of (La/Yb)N ratios (Fig. 5b), suggesting that the wedge mantle around the N-Izu region is compositionally homogeneous (e.g., Kimura et al., 2010). The enrichment in incompatible elements is thought to reflect the incorporation of slab-derived materials, such as aqueous fluids and partial melts from sediments and/or AMOC, into their mantle source (e.g., Elliott et al., 1997; Gill, 1981; Hawkesworth et al., 1991; Spandler and Pirard, 2013). Previous geochemical studies on N-Izu arc basalts suggested that the slab dehydration reaction peaked on the VF side and the contribution of slab-derived fluid decreased in the RA region (e.g., Kimura et al., 2010; Tollstrup et al., 2010; Parendo et al., 2022). Therefore, the markedly lower (Ba/Th)N and (Pb/Ce)N ratios and Ta depletions in the Niijima and Kozushima basalts compared to the samples from Izu-Oshima and the other VF volcanoes (Fig. 5a and Table 2) suggest that the contribution of aqueous fluid to the primary melts in the RA region is lower than in the VF region as a result of progressive dehydration from the subducting slab (e.g., Green, 1995; Freymuth et al., 2016b; Kimura et al., 2010; Hochstaedter et al., 2000, 2001; Miller et al., 1994; Nohda et al., 1990; Taylor and Nesbitt, 1998; Tollstrup et al., 2010).
Li, H. Y. et al. (2021) showed that the volcanoes of the Mariana RA have relatively high Ce/Mo and low Hf/Nd ratios, originating from diapirs fluxed by Mo-depleted slab melts as a result of slab dehydration in the forearc region. On the other hand, in the Izu RA region of subduction zones, dehydration or melting of phengite-bearing eclogite in the slab may play an important role in controlling trace element abundances in RA basalts (e.g., Brenan et al., 1995a, 1995b; Kessel et al., 2005; Stalder et al., 1998). In addition, Kimura et al. (2010) demonstrated that N-Izu RA basalts (Toshima, Udonejima, and Niijima) have relatively higher HREE abundances than Izu-Oshima (e.g., Kimura et al., 2010), which the authors attributed to the addition of slab melts of phengite-bearing eclogite. However, this study and Kuritani et al. (2018) showed that most of the Izu-Oshima basalts have higher HREE abundances than those of the N-Izu RA basalts (Table 2 and Fig. 4). The Kozushima basalts have higher (Nb/Yb)N and (La/Yb)N ratios than the other VF basalts and the Niijima basalts (Fig. 5d), indicating that they were formed at a relatively lower degree of partial melting than the N-Izu VF samples. These features are consistent with the relatively high K contents in the Kozushima basalts (Fig. 3b). Thus, the relatively low HREE abundances of the Kozushima basalts would reflect a low degree of partial melting for the generation of the parent magma, rather than the addition of slab melt.
Subduction erosion has been suggested as another important process that can control the abundances of trance elements in subduction zone basalts. High Th/Nb ratios for Izu-Bonin and Kurile VF basalts cannot be explained by simple dehydration/melting of the currently subducting plate, but may be related to decomposition of subducted forearc mantle materials that have experienced multiple episodes of fluid/melt fluxes (Li et al., 2023). Indeed, the N-Izu VF samples have higher Th/Nb and Hf/Nd ratios than those in the DM, possibly indicating mixing of shallow slab melts as observed in the Kuril arc. However, the Th/Nb and Hf/Nd ratios in the Kozushima basalts were similar to those in the Mariana RA and Kuril RA basalts, suggesting little to no contribution from the shallow slab melt. This conclusion is consistent with the hypothesis that subducted serpentinites in the Mariana RA are likely depleted by 200 km depth (Li, H. Y. et al., 2021). Our conclusion is also supported by the observation that Izu RA basalts, as well as samples from the Izu back arc ridge and seamounts, have less radiogenic Sr and Pb isotopic compositions compared to those of VF basalts (e.g., Ishizuka et al., 2003, 2006; Kimura et al., 2010; Nohda et al., 1990). The inverse correlation between Hf/Nd and 87Sr/86Sr ratios in N-Izu RA samples probably indicates the addition of high-temperature hydrous melts from the deep slab rather than the contribution of the shallow slab melt (e.g., Pearce et al., 1999; Woodhead et al., 2001).
Overall, the geochemical characteristics of the Kozushima basalts are similar to those of basaltic magma in the RA of N-Izu and eastern Izu volcanoes such as Teishi Knoll, where the contribution of slab-derived fluids is small, and the degree of partial melting is lower than that of VF volcanoes. Additionally, these geochemical characteristics are consistent with those of volcanic centers in the Pliocene-Quaternary N-Izu RA, which show minimal evidence of sediment melt rather than fluid from the AMOC (Ishizuka et al., 2006).
Across-arc variation of Mo isotope ratios in N-Izu basalts Elevated δ98/95Mo values in VF basaltsAs shown in Fig. 8, the mean δ98/95Mo values of the N-Izu basalts tend to decrease with increasing slab depth in the order of Izu-Oshima (δ98/95Mo = 0.11 ± 0.09‰, 2s), Niijima (δ98/95Mo = –0.14 ± 0.05‰, 2s), and Kozushima (δ98/95Mo = –0.20 ± 0.21‰, 2s). Additionally, δ98/95Mo values in the N-Izu basalts show systematic covariation with Ba/Th and Ce/Mo ratios (Fig. 6b, c). Such covariation was observed between δ98/95Mo values and (238U/230Th) ratios in Izu arc samples (Freymuth et al., 2016b, 2019). Previous experimental studies have suggested that Mo is soluble in aqueous fluid as a form of MoO4– during dehydration of the subducting slab with a solubility comparable to the other fluid mobile elements such as Ba and U (Bali et al., 2008, 2012; König et al., 2008). The transport of Mo from the subducting slab into the overlying mantle wedge via slab-derived fluid has led to the Mo enrichment in arc magmas (e.g., Bali et al., 2012; König et al., 2008). Therefore, the observed covariation between the δ98/95Mo values and the Ba/Th and Ce/Mo ratios in the N-Izu basalts indicates the gradual decrease in the δ98/95Mo value with the decrease in the amount of slab-derived fluid added to the mantle wedge.

Variation of δ98/95Mo values in N-Izu basalts versus depth of subducting Pacific Plate (Nakajima et al., 2009 and Saito, 2017). Literature data for Izu arc samples are from Villalobos-Orchard et al. (2020).
During dehydration of the subducting slab, Mo is thought to cause mass-dependent isotopic fractionation between the aqueous fluid and the minerals residing in the slab, since heavier Mo isotopes prefer tetrahedral coordination in the fluid while lighter Mo isotopes are preferentially retained in octahedral sites in minerals such as rutile and sulfides (e.g., Chen et al., 2019; Freymuth et al., 2015; Tossell, 2005). Consequently, the most straightforward interpretation for the elevated δ98/95Mo values in the N-Izu VF basalts, which are higher than the mean MORB value (δ98/95Mo ≈ –0.17‰: Bezard et al., 2016; Chen et al., 2022; Hin et al., 2022), is the contribution of slab-derived aqueous fluid enriched in heavy Mo isotopes to the source mantle of the VF volcanoes (e.g., Freymuth et al., 2015). This observation is consistent with the elevated δ98/95Mo values of the other VF volcanoes in the IBM arc (e.g., Miyakejima: δ98/95Mo = –0.03 ± 0.02‰, N = 4, 2s; Hachijojima: δ98/95Mo = –0.08 ± 0.08‰, N = 4, 2s; Izu-Torishima: δ98/95Mo = 0.03 ± 0.04‰, N = 2, 2s; Mariana island basalts: δ98/95Mo = –0.03 ± 0.20‰, N = 14, 2s (Freymuth et al., 2015; Li, X. et al., 2021; Villalobos-Orchard et al., 2020).
On the other hand, forearc mantle serpentinized by dehydration of the subducting slab may have a significant influence on the variation of Mo isotopic ratios in N-Izu volcanic rocks. Ahmad et al. (2021) suggested that the contribution of Mo from subducted serpentinized forearc mantle to the VF magmas of the Tonga arc was higher than that from hydrous minerals in the slab. This scenario can explain the higher δ98/95Mo in the N-Izu VF basalts than in the MORB and DM. Indeed, previous studies in the N-Izu region have suggested that the influence of dehydrated fluids in the forearc region, coupled with the existence of a water-enriched wedge mantle, provides an explanation for the distinctive features observed in K and Pb isotopes in the Izu arc volcanoes (Durkin et al., 2020; Parendo et al., 2022).
Low δ98/95Mo values in RA basaltsIn contrast to the N-Izu VF basalts (Izu-Oshima), the δ98/95Mo values of the N-Izu RA basalts (Niijima and Kozushima) are relatively low. In the Izu arc, across-arc variation of isotopic compositions as a result of slab dehydration/melting has been documented for U, W, Mo, and K. (Freymuth et al., 2019; Mazza et al., 2020; Parendo et al., 2022, Villalobos-Orchard et al., 2020). As discussed above, the Mo isotope ratios in the N-Izu basalts appear to correlate with the reduced contribution of aqueous fluid. In particular, among the RA volcanoes, the Kozushima basalts have slightly lower δ98/95Mo values and (Ba/Th)N ratios than those of the Niijima basalt, suggesting that the decrease in the amount of aqueous fluid added to the mantle wedge with increasing slab depth manipulates variations in Mo isotopic composition even in the RA region (Fig. 8). Given the induced convection in the wedge mantle (e.g., Isse et al., 2009), the fluids that contributed to the generation of the primary melts of the Niijima and Kozushima basalts must have originated from the slab deeper than the slab that released the fluid that contributed to the primary melts of the VF volcanoes, including Izu-Oshima. If the source wedge mantle has a uniform DM-like Mo isotopic composition (δ98/95Mo = –0.20‰; McCoy-West et al., 2019), the fluids derived from the slab deeper than that of VF were depleted in heavy Mo isotopes relative to the volcanic fronts to reconcile with the low δ98/95Mo value of the Kozushima basalts (δ98/95Mo = –0.20 ± 0.21‰). Alternatively, the contribution of slab-derived fluid/melt to the formation of RA magma was minuscule and probably did not change the DM-like Mo isotopic composition.
Three following scenarios would explain the relatively low δ98/95Mo values in the fluid released from the deeper slab compared to the fluid contributing to the VF primary melts. First, the deep slab is compositionally enriched in light Mo isotopes on a bulk scale relative to the AMOC (δ98/95Mo ≈ +0.35‰, Freymuth et al., 2015) as a result of continuous dehydration of fluids with relatively high δ98/95Mo values at shallow slab depths. Thus, slab-derived fluids that contributed to the RA basalts may have lower δ98/95Mo values than fluids dehydrated at shallower depths. This model is supported by the lower δ98/95Mo values of eclogites (–0.33‰ to –1.01‰: Chen et al., 2019) than DM. Furthermore, the aqueous fluid formed by the breakdown of antigorite in the subducting oceanic lithospheric mantle at depths >200 km in the Wadati-Benioff zone would have lower δ98/95Mo values than fluid dehydrated in the forearc region (Li, H. Y. et al., 2021).
Second, there are some specific minerals that retain light Mo isotopes in the pre-dehydrated deep slab. One such mineral is rutile, in which light Mo isotopes are preferentially distributed during slab dehydration at shallower depths. Therefore, reaction of the fluid in the deep slab with the isotopically light residual rutile would lower the δ98/95Mo value in the fluid. Rutile is a common metamorphic phase in metabasalts and metagabbros that shows the signature of reaction with fluids in eclogite veins (Spandler et al., 2011).
On the other hand, the Izu sediments are characterized by a relatively low δ98/95Mo value of ≈ –0.29 (Freymuth et al., 2015). Thus, the third scenario is that slab melt containing sedimentary components is incorporated into the slab fluid released from the deep slab. This scenario may contradict our previous conclusion that the relatively low HREE abundances of the Izu-RA basalts are primarily due to the low degree of partial melting, rather than the contribution of slab melts. However, we cannot exclude this possibility based on the following geochemical observations. First, Kozushima basalts are characterized by La/Sm and Nd/Hf ratios lower than those of Izu VF (e.g., Taylor and Nesbitt, 1998; Plank, 2005) and lower radiogenic Sr-Nd isotope ratios than VF (Nohda et al., 1990), which is similar to basaltic samples from the Sumisu active rift and back arc knoll where the contribution of slab-derived melts composed of sediment and AMOC has been suggested (e.g., Elliott et al., 1997; Rubatto and Hermann, 2003; Tollstrup and Gill, 2005; Tollstrup et al., 2010; Wade et al., 2005). Second, the Niijima and Kozushima basalts lie between the VF basalts and the Izu sediments in the δ98/95Mo versus La/Sm and δ98/95Mo versus Nd/Hf plots (Fig. 6d, e), suggesting the contribution of sediment melts derived from the subducted plate in the RA basalts. Villalobos-Orchard et al. (2020) demonstrated a correlation between δ98/95Mo and Nd and Hf isotopic compositions in the N-Izu VF and Niijima basalts, which the authors attributed to the increased influence of the slab melt component in the Niijima basalts relative to the VF. Third, in the δ98/95Mo versus Ce/Mo plot (Fig. 9), most of the N-Izu RA basalts lie on the trend defined by the Mariana and Kamchatka arc basalts, to which the contribution of slab melts has been suggested (e.g., Freymuth et al., 2015; Li, H. Y. et al., 2021; Li, X. et al., 2021; Willbold and Messling, 2023). As suggested by the examination of Nd/Hf ratios, there appears to be a gradual increase in the proportion of slab melt components towards the RA region. Therefore, the increasing presence of slab components also explains the gradual variation in the Mo isotopic composition.

Correlation diagrams of Ce/Mo ratios and Mo isotope ratios for the basaltic samples from the Izu arc, the Kamchatka arc and the Mariana arc. Literature data for Izu arc samples are from Ishizuka et al. (2008), Freymuth et al. (2015), Kimura et al. (2010), Tamura et al. (2007), Villalobos-Orchard et al. (2020). Literature data for the Kamchatka arc and the Mariana arc are from Churikova et al. (2001), Elliott et al. (1997), Li, H. Y. et al. (2021), Li, X. et al. (2021), Yan et al. (2019), Willbold and Messling (2023). The δ98/95Mo value of the depleted mantle (DM) is from McCoy-West et al. (2019), and the abundances of the other elements in DM are from Salters and Stracke (2004). Geochemical data for Izu sediments (average value of ODP sites 800, 801, 802, 1149) are from Plank et al. (2007). Mo (μg/g) and δ98/95Mo (‰) values in Izu sediments are from Freymuth et al. (2015). Geochemical data of ODP Site 801 AMOC are from Freymuth et al. (2015) and Kelley et al. (2003).
Overall, the low δ98/95Mo value in the N-Izu RA basalts was produced by the decline of aqueous fluids and the addition to the mantle wedge of aqueous fluids enriched in light Mo isotopes derived from the slab depth deeper than that released by the fluid involved in VF magma generation. Continuous dehydration of aqueous fluids with elevated δ98/95Mo values from the subducting slab is responsible for the low δ98/95Mo value of the fluid that contributed to the generation of RA magmas. However, the other possibility, including the effect of slab melts carrying sedimentary components, cannot be completely ruled out.
Throughout this study, we came to the following conclusions:
(1) The geochemical characteristics of the Kozushima basaltic enclaves indicate that they were derived from arc-like magma that was active beneath Kozushima. These Kozushima basalts are compositionally similar to those of basaltic magma in the RA area of N-Izu and eastern Izu volcanoes, where the contribution of slab-derived fluid is small and the degree of partial melting is lower than that of VF volcanoes.
(2) The δ98/95Mo values of N-Izu VF basalts (Izu-Oshima) are higher than those of MORB and DM, which is due to the heavy Mo isotopes preferentially escaping into aqueous fluids on the VF side due to the stability of light Mo isotopes in rutile in the subducting slab during dehydration.
(3) In contrast, δ98/95Mo values in RA basalts (Niijima, Kozushima) are as low as those of MORB and DM, showing the gradual decrease with depth in the Wadati-Benioff zone. This observation suggests that the slab-derived fluid in the RA region is depleted in heavy Mo isotopes as a result of continuous loss of heavy Mo isotopes via slab dehydration in the VF region. However, other possibilities, including the incorporation of slab melts containing sedimentary components, cannot be ruled out to explain the relatively low δ98/95Mo values in the N-Izu RA basalts.
We thank I. Gautam, Y. Masuda, S. Niki and Y. Sasai for technical assistance and sample preparation. Comments from the Associate Editor T. Kogiso and two anonymous reviewers greatly improved the quality of this work. This work was supported by JST SPRING (grant number JPMJSP2106 to TT) and JSPS KAKENHI (grant numbers 18H04457 to TY and 19H01998 to AI).