Abstract
Objective: This study aimed to establish a methodology for obtaining visually equivalent image quality regardless of patient size by controlling the acquisition time of positron emission tomography (PET) studies. Methods: In Part 1, we determined the physical image quality index with the highest correlation with visual assessment in 30 patients. In Part 2, 100 patients were scanned to identify the patient-dependent parameters that were most correlated with the physical image quality index. These parameters were calculated from the combination of the administered activity of 18F-FDG and weight. We drew an approximate curve from these parameters and prepared a scatter plot of the physical image quality index. In Part 3, we checked whether the image quality was constant by controlling the acquisition time in 189 patients. The approximation formula we obtained under (2) was used to control the acquisition time. The physical image quality index was a constant value, and the patient-dependent parameter was calculated from the patient’s physique. Results: The physical image quality index with the highest correlation with visual evaluation was the noise equivalent count weight (NECweight) (correlation coefficient: 0.90). The patient-dependent index most correlated with NECweight was activity/weight3 (A/W3) (coefficient of determination: 0.978). The verification of the acquisition time to obtain a certain image quality showed an average of 0.60 ± 0.034 Mcounts/m∙kg, and a similar image quality was obtained independent of the individual physiques. Conclusions: Calculating NECweight and A/W3 enable the determination of the appropriate acquisition time for stable image quality before the PET study.
INTRODUCTION
High-quality images of patients who underwent whole-body positron emission tomography (PET) with 18F-FDG are critical for an accurate cancer diagnosis3,7). However, since the quality of PET/CT images of overweight patients is often degraded8), diagnosis can be difficult, and reader confidence can be low19). To obtain sufficient image quality in a large number of patients, the acquisition time must be extended to increase the administered activity of 18F-FDG9,11,13,14,16). The acquisition time that brings the visual assessment of different patients closer can be derived from the correlation between these two indices.
The first index is highly correlated with the visual assessment and requires a physical image quality index that is closely related to the acquisition time; these are the liver signal-to-noise ratio (liver SNR), the noise equivalent counts per axial length (NECpatient), and the noise equivalent count density (NECdensity)1,4,6,11,13,15,17,21). According to McDermott et al.13) and Mizuta et al.15), the physical image quality index using the noise equivalent count (NEC) correlates more with visual assessment than the liver SNR. However, NECdensity does not reflect the length of the scan, and NECpatient does not reflect the volume of the scan target. Therefore, the correlation between the existing physical indicators and the visual assessment is low. Furthermore, according to Maebatake et al.12), in the time-of-flight (TOF) algorithm, NEC is not correlated with the SNR of the phantom on PET images. However, these studies did not evaluate clinical images or visual assessments. Therefore, we determined the physical image quality index that was most correlated with the visual assessment of clinical PET images using the TOF algorithm.
The second index requires an index that can be calculated before PET examination, which has a high correlation with the physical image quality index; these are patient-dependent indicators such as body weight and administered activity1,5,10,13,16). Groot et al.4) reported that the optimised administered activity is approximately correlated with the value of (body weight)2. We created a patient-dependent parameter obtained by dividing the administered activity by the power of body weight and verified the accuracy of predicting the physical image quality index.
This study aimed to establish a methodology to obtain visually equivalent PET images with high accuracy by controlling the acquisition time in clinical PET studies.
MATERIALS AND METHODS
Institutional review board approval was obtained for this retrospective study and informed consent was waived. Our study consisted of the following parts: 1) examination of the optimal physical index reflecting the clinical image quality, 2) determination of the patient-dependent parameters representing the optimal physical index, and 3) validation of whether our proposed protocol contributes to obtaining a similar image quality independent of individual physiques.
Part 1
Examination of the optimal physical index
After calculating NECdensity, liver SNR, NECpatient, and NECweight, we identified the index with the highest correlation with the visual image quality of the PET/CT scan.
PET/CT scanning
We included 30 consecutive patients (14 males, 16 females; median age 61, age range, 30–86 years) who underwent PET/CT for cancer staging or restaging between April and May 2013. The cancers included colon cancer (n = 6), lymphoma (n = 4), breast cancer (n = 5), oesophageal cancer (n = 6), stomach cancer (n = 3), lung cancer (n = 2), ovarian cancer (n = 1), head and neck cancer (n = 2), and cervical cancer (n = 1). All patients fasted for at least 5 hr before injection of 18F-FDG and were scanned according to our hospital’s standard clinical protocol.
Images were obtained using a Biograph mCT PET/CT scanner (Siemens Medical Solutions), covering an axial field-of-view (FOV) of 21.6 cm in length and a transaxial FOV of 84.2 cm in diameter. It features 32,448 lutetium orthosilicate detector elements (4 × 4 × 20 mm3 dimension). The coincidence time window was 4.1 ns; the TOF time resolution was 555 ps. PET data were acquired in 3D list mode. PET images were reconstructed using ordered-subset expectation maximisation (OSEM) with a TOF information algorithm. The parameters for OSEM plus TOF were three iterations and 21 subsets. The full width at half maximum of the Gaussian filter was 6 mm. The image matrix consisted of 200 × 200 pixels (4.07 × 4.07 mm2). The slice thickness was 3 mm. The imaging range was from the thigh to the head, with both arms raised, and the imaging length fell within the range of 7–8 beds. An overview of patient characteristics and acquisition parameters is presented in Table 1. The emission acquisition time was acquired in list mode for at least 2 min for each bed position; a sinogram of the required acquisition time was created for each of the three study parts.
Table 1
Patient’s characteristics and acquisition parameters.
|
Study |
| Part 1 |
Part 2 |
Part 3 |
| Number of patients (male, female) |
30 (14, 16) |
100 |
189 |
| Median age (range) |
61 (30 to 86) |
64 (18 to 91) |
65 (21 to 95) |
| Body mass (kg) |
|
|
|
| Mean ± SD |
52.5 ± 12.0 |
57.1 ± 11.9 |
67.9 ± 24.5 |
| Range |
36.2 to 78.8 |
38.6 to 106.9 |
32.2 to 137.5 |
| Length (m) |
|
|
|
| Mean ± SD |
1.58 ± 0.09 |
1.60 ± 0.08 |
1.61 ± 0.12 |
| Range |
1.45 to 1.78 |
1.36 to 1.76 |
1.29 to 1.90 |
| BMI (kg/m2) |
|
|
|
| Mean ± SD |
21.4 ± 3.9 |
22.4 ± 4.4 |
26.3 ± 8.6 |
| Range |
14.1 to 28.5 |
16.0 to 43.0 |
13.4 to 54.7 |
| BSA (m2) |
|
|
|
| Mean ± SD |
1.51 ± 0.19 |
1.58 ± 0.17 |
1.70 ± 0.32 |
| Range |
1.24 to 1.94 |
1.23 to 2.08 |
1.13 to 2.30 |
| Time between administration and scan [min] (range) |
60 (60 to 62) |
60 (57 to 68) |
60 (55 to 72) |
| Prescribed FDG mean administered activity [MBq] (range) |
241(162 to 288) |
255(157 to 350) |
245(163 to 355) |
| Mean acquisition time per bed position [min] (range) |
2.0 fixed |
2.0 fixed |
3.1 (2.0 to 9.2) |
BMI, body mass index; BSA, body surface area
Physical indicators, that is, NECdensity, liver SNR, and NECpatient, which are widely used as image quality barometers in clinical practice, were calculated. Furthermore, the NECweight, which was established as a new physical image quality index reflecting the scan length and volume of the scan target, was evaluated.
NECdensity, which reflects the normalised effective counts distributed within the target body and represents the count statistics per target volume, was determined according to Mizuta et al.15) and Accorsi et al.1):
| NECdensity kcounts/cm3=∑i=1nNECiV | (Eq. 1), |
where NEC was calculated using Eq. 2, and V [cm3] represents the target volume within the axial extent to be evaluated (i = 1 to I), that is, from the neck to the abdomen. NEC is generally defined using prompt and delayed counts, as in equation6):
| NECiMcounts=1-SF2Pi-Di2Pi-Di+1+kDi | (Eq. 2), |
where Pi and Di represent prompt and delayed coincidences for each bed position, SF is the scatter fraction measured within the NEMA NU 2-2001 standard2), and k is set to 0 or 1, depending on the use of variance reduction techniques to estimate a smooth random distribution or the application of direct random subtraction.
The liver SNR, a physical image quality index established by de Groot et al.4), was determined as the mean/standard deviation (SD) in a liver region of interest (ROI) separated from the porta hepatica and major vessels in three coronary sections6,15).
NECpatient facilitates height normalisation. Because the axial scanning range is variable, according to Japanese guidelines6), the NECpatient is obtained using the following equation:
| NECpatient Mcounts/m=∑i=1nNECi x/100 | (Eq. 3), |
where NECi and x represent the NEC for the i-th bed position and the length [m] of the axial FOV to be evaluated (i = 1 to I), that is, extending from the head to the mid-thighs in our study.
NECweight is our original physical indicator to evaluate image quality. It combines NECdensity and NECpatient, and is obtained using the following equation:
| NECweight Mcounts/m∙kg=∑i=1nNECiweight kg × x m | (Eq. 4), |
where NECi and x are in the same range as that of the NECpatient. NECweight is easily calculated using the patient’s weight instead. The physical image quality index was calculated for each of the 30 patients.
Visual assessment
The physical image quality index was calculated for 30 patients of different sizeswho were visually evaluated. Six observers (three radiologists and three radiological technologists) visually compared the two images extracted from the 30 images for hepatic accumulation homogeneity; each observer evaluated 435 (30C2) image pairs. We calculated the visual assessment score for each image using Scheffé’s paired comparison18). After confirming that the visual assessment scores of the six readers were equally dispersed, the average value was recorded as the visual assessment score.
We identified the best image quality index by examining the correlation coefficients between each physical image quality index and the visual assessment score. The correlation coefficient was calculated using the Spearman’s rank correlation coefficient.
Part 2
Determination of patient-dependent parameters
After establishing NECweight as an original physical indicator, correlating patient-dependent parameters were determined. Clinical PET/CT images were acquired for all 100 patients (Table 1). Cells were photographed for medical cancer treatment. Among the physical constitution indices that correlate with PET image quality, the patient’s body weight was expected to correlate with visual assessment. As the administered activity as optimised by de Groot et al.4), correlated with the approximate value of (body weight)2, we created patient-dependent parameters by dividing the administered activity by the power of body weight.
The exponent was changed by 0.1, from 1 to 5, and a scatter diagram of each power of body weight and the best physical image quality index was created. An approximate curve was drawn from each scatter plot, and the coefficient of determination was calculated. We set the X-th power of activity/weight, which revealed the highest coefficient of determination, as the best patient-dependent parameter. We then clarified the correlation between the best physical image quality index and the best patient-dependent parameters. We drew an approximated curve from a scatter plot of the physical image quality index and patient-dependent parameters that were found to have the highest correlation with the visual assessment in Part 1. When the coefficient of determination of the approximate curve was high, the PET image quality could be predicted from patient-dependent parameters.
Part 3
In Part 3, we validated the proposed protocol created in Parts 1 and 2 and assessed whether it contributes to obtaining a similar image quality independently of individual physiques. The SNR of the projection data, defined as the ratio of the mean pixel value to the SD, that is, N/√N = √N, is equivalent to the square root of the NEC count for a fixed acquisition time Δt (SNR2 data equivalent to NEC = NECR × Δt)11,20). Consequently, all physical image quality indices used in this experiment can be converted into an equation, including the acquisition time. The approximate expression of the physical image quality index and patient-dependent parameters determined in Parts 1 and 2 were converted into an expression that included the acquisition time. The target image quality was substituted into this equation to calculate the acquisition time for each patient, and 189 patients were imaged. If the calculated acquisition time was less than 2 min/bed, imaging was performed for 2 min/bed in list mode to create a sinogram of 2 min/bed and the calculated acquisition time. The image quality target is the average value of the physical image quality index obtained in Part 2. To confirm that the image quality of patients with different physiques was similar and independent of individual physiques, a correlation diagram was drawn between the physical image quality index and body weight.
RESULTS
Part 1
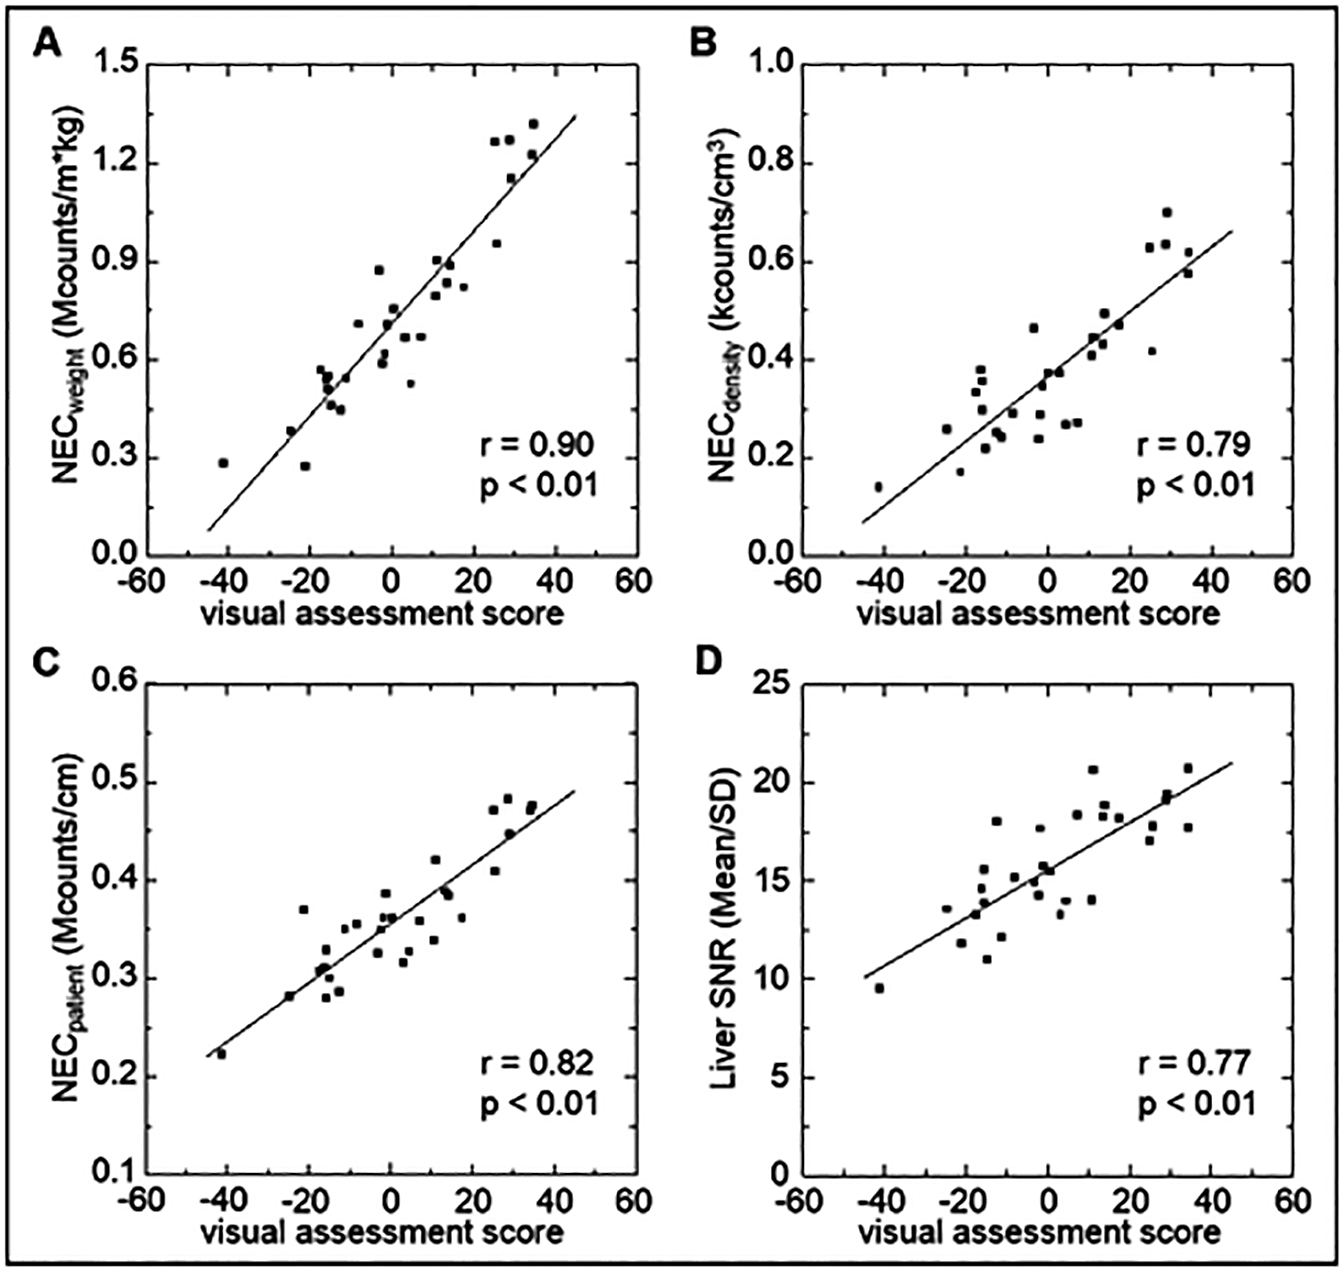
Figure 1 shows the correlation between the visual assessment scores and the physical image quality index of PET images. The correlation coefficient between visual assessment scores and NECweight was 0.90; for NECpatient, NECdensity, and liver SNR, the correlation coefficients were 0.82, 0.79, and 0.77, respectively. NECweight showed the highest correlation with visual assessment.
Part 2
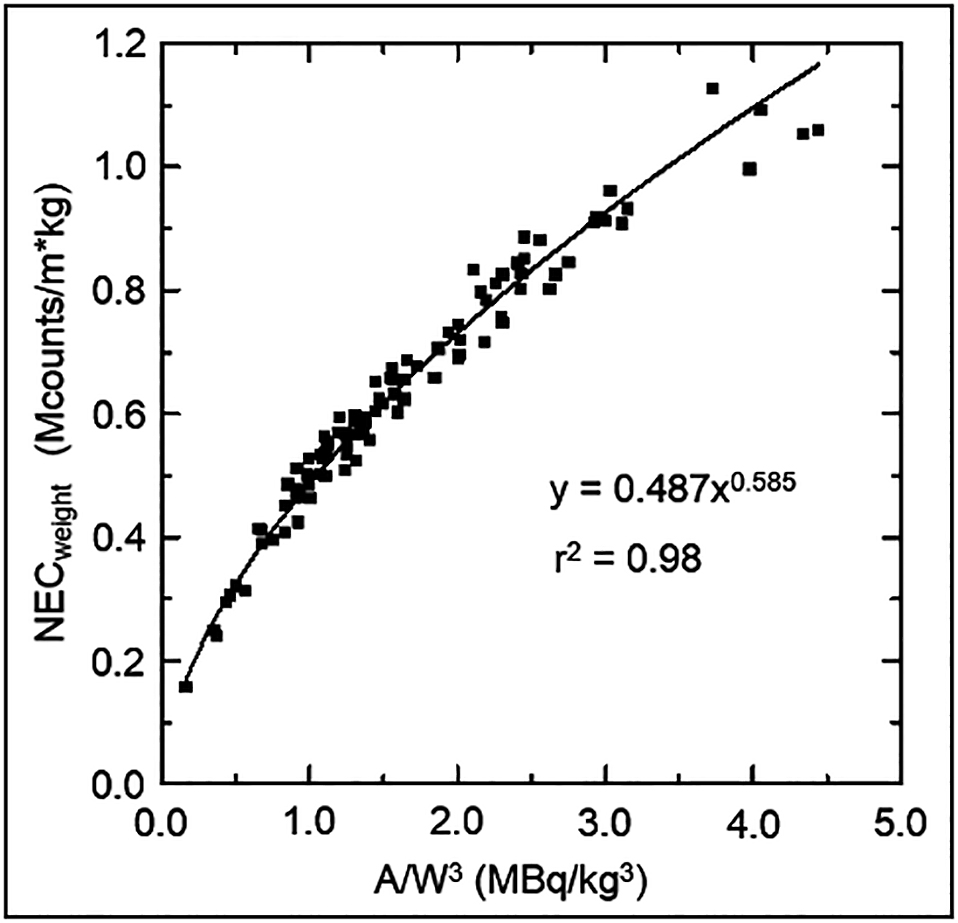
The relationship between patient-dependent parameters obtained by dividing the administered activity by the power of body weight and the coefficient of determination is shown in Figure 2. As the coefficient of determination had the highest value (0.978) for activity/(body weight)3 (A/W3), we set the best physical image quality index as NECweight and the best patient-dependent parameter as A/W3.
A/W3 was adopted as the patient-dependent parameter and defined in Eq. 5:
| A/W3 MBq/kg3=(administered activity) MBq×1000/ body weight kg3 | (Eq. 5). |
We drew scatter plots to predict NECweight and PET image quality after imaging from A/W3 known before imaging (Figure 3). An approximate curve was obtained from the scatter plot and Eq. 6 was obtained.
| NECweight=0.487×A/W30.585 | (Eq. 6). |
A/W3 in Eq. 6 is defined in Eq. 5. The coefficient of determination for the approximate curve is 0.98.
Part 3
Because NECweight is NEC = NECR × Δt, it increases in proportion to the acquisition time. Δt indicates the acquisition time, which was 120 s in Part 2. Equation 7 was obtained by modifying Eqs. 6:
| tx s=NECweight,x×t2min/0.487×A/W30.585 | (Eq. 7), |
where tx is the acquisition time per bed to obtain the NECweight,x of an arbitrary image quality, and t2min is 120 s.
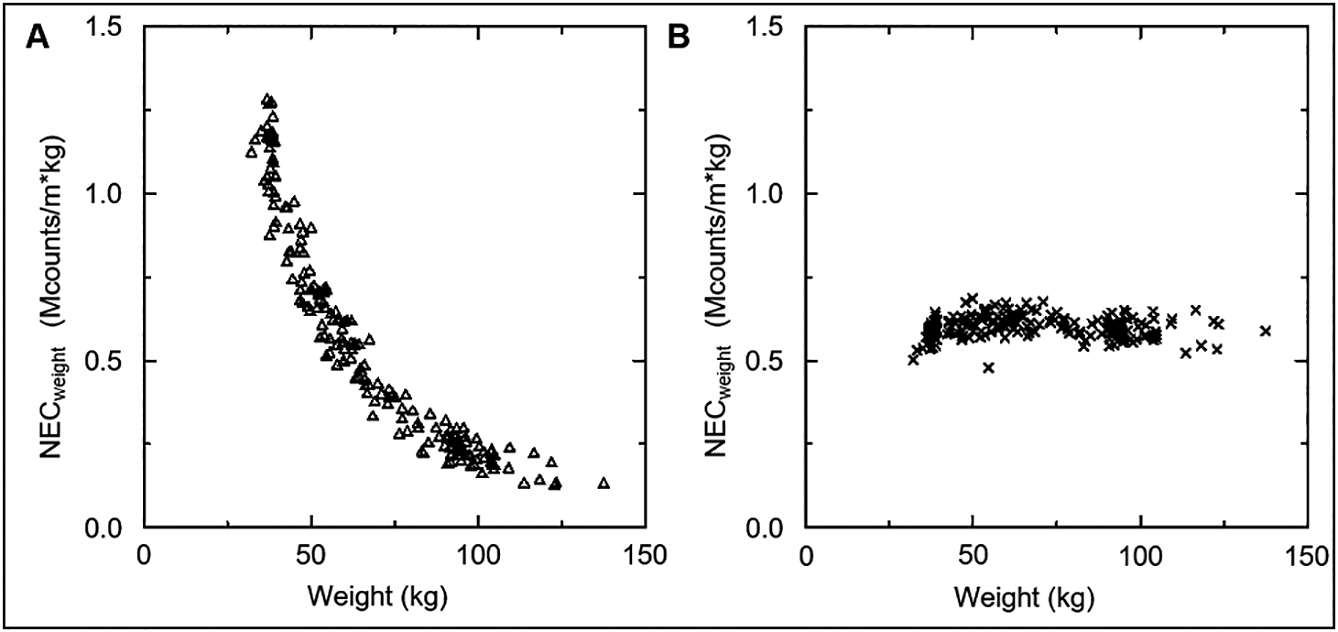
The image quality target was set to 0.6 from the average value of NECweight obtained in Part 2. The acquisition time was verified by substituting the NECweight,x = 0.6, in Eq. 7 to obtain the tx [s], and 189 patients were imaged. Figure 4 shows the relationship between NECweight and body weight. The NECweight of tx [s] and 120 [s] were calculated from the sinogram of the same patient. The image quality of NECweight, whose image was reconstructed at 120 [s]/bed, deteriorated sharply as body weight increased. Conversely, the NECweight image reconstructed with tx [s]/bed averaged 0.60 ± 0.034 (%SD: 5.74), and a highly accurate arbitrary image quality was obtained (Figure 5); tx [s] showed an average of 186.1 ± 114.5 (range: 53.6–552.3).
DISCUSSION
We developed a methodology to obtain highly accurate, visually equivalent image quality, regardless of patient size, by controlling the acquisition time of clinical PET studies. Calculating NECweight and A/W3 made it possible to determine the appropriate acquisition time for a stable image quality before starting the examination.
The NECweight exhibited the highest correlation with the visual assessment score. This is a new physical image quality index, which was first introduced in this study. The correlation coefficient between the existing physical image quality index and the visual assessment score we applied was in the following order: NECpatient, NECdensity, and liver SNR. Our findings were consistent with the visual assessment results of McDermott et al.13) Therefore, we consider that the evaluation using NEC is effective in clinical PET studies that apply the TOF algorithm. We suggest that NECweight is superior to the physical image quality indices proposed previously6,9,13,14,15,17). The liver SNR was less correlated with visual assessment than the other physical indicators used NECs. The drawback of liver SNR is that the accumulation of FDG in the liver is not always uniform and is affected by individual differences attributed to the patient’s metabolism. The drawback of NECdensity is that the scanning length is not reflected, and the drawback of NECpatient is that it does not reflect the patient’s volume. NECweight compensates for these drawbacks and can reflect the scanning length and body weight, thus improving the correlation with visual assessment. A limitation of visual assessment in our study was that the liver was the main evaluation target. Furthermore, our visual assessment did not assess the lesions. Therefore, the relationship between the ability to detect lesions and acquisition time remains unclear.
The patient-dependent parameter with the highest correlation with NECweight was A/W3, and the patient-dependent parameter applied most frequently was activity/(body weight). The patient’s body weight was believed to have the strongest effect on the quality of PET images. They are corrected by image reconstruction; however, as image reconstruction applies to scatter and absorption corrections, the correction width increases with the patient’s weight. We consider that the visual assessment score of the reconstructed PET images does not depend on the FDG concentration per body weight and shows that the highest correlation is with A/W3. The coefficient of determination of the correlation diagram between the NECweight and A/W3, which exhibited the highest correlation with the visual assessment score, was 0.98 (Figure 3). If administered activity and body weight are known before imaging, the acquisition time required for the acquisition of arbitrary image quality can be predicted with high accuracy (Eq. 7). If the prediction accuracy of the acquisition time is low, the burden on the patient increases when the acquisition time is excessively long, and there is concern that the PET/CT image may deteriorate when the acquisition time is insufficient. Excessive acquisition time increases the risk of image quality deterioration due to the patient’s body movement. When the acquisition time is insufficient, it is difficult to interpret the images, and the diagnosis is unreliable19). As the predicted acquisition time in our study was much longer than that in previous studies7,9,13–15,19), we consider our method to be valuable for clinical PET examination.
In Part 3 of our study, we calculated the acquisition time using Eq. 7, the image quality obtained from 189 individuals was almost constant. A visually equivalent PET image quality facilitates follow-up of patient comparisons and minimises the interpatient impact of statistical noise differences in standard uptake value (SUV)3). The acquisition time at a constant NECweight increases at the 1.76th power of the body weight, and its prolongation in heavy patients is problematic (Eq. 7). According to Accorsi et al.1), the acquisition time required to obtain the same image quality irrespective of the patient’s body weight, increases with the power curve of the body weight; their findings agree with those of our study. Our findings indicate that image quality can be improved more efficiently by increasing the acquisition time than the administered activity. However, the acquisition times obtained using Eq. 7 cannot be used when the PET/CT device and reconstruction conditions differ. However, the proposed method for obtaining Eq. 7 is useful; it was obtained by calculating the NECweight and A/W3 from approximately 100 raw PET data. We acquired Eq. 7 for each participating facility and proposed that the image quality can be controlled by the acquisition time.
The tx [s] in Eq. 7 showed an average of 186.1 ± 114.5 (range: 53.6–552.3). The acquisition time was 10 times longer in heavyweight patients than in underweight patients. This places a burden on heavy patients and throughput is an issue. Therefore, increasing the administered activity should be considered in heavier patients. However, in this study, we did not investigate the optimal administered activity based on body weight, and this issue requires further investigation. A long acquisition time may result in image deterioration due to body movements7); therefore, the permissible range for decreasing NECweight due to acquisition time shortening must be determined by each facility.
Our study had some limitations. For visual assessment, we used only the liver parenchyma and did not assess the relationship between lesion detection ability and acquisition time. Furthermore, because only adults were included, future studies on children are necessary.
Conclusion
The optimal physical image quality index that most correlated with the visual assessment of clinical PET images was NECweight. This showed a high correlation with the A/W3 of patient-dependent parameters that can be obtained before patients undergo PET studies. By controlling the acquisition time with the approximate expression obtained from the scatter plot of NECweight and A/W3, we were able to obtain a highly accurate visually equivalent PET image quality in patients of different sizes. By calculating NECweight and A/W3 from approximately 100 raw PET images, the method introduced in this study enables the calculation of the acquisition time for an arbitrary image quality before performing clinical PET studies.
REFERENCES
- 1 Accorsi, R., Karp, J.S. and Surti, S. 2010. Improved dose regimen in pediatric PET. J. Nucl. Med. 51: 293–300.
- 2 Association. NEM. NEMA standards publication NU 2-2001: performance measurement of positron emission tomographs, Rosslyn: National Electrical Manufacturers Association, 2001.
- 3 Boellaard, R. 2009. Standards for PET image acquisition and quantitative data analysis. J. Nucl. Med. 50 Suppl 1: 11S–20S.
- 4 de Groot, E.H., Post, N., Boellaard, R., Wagenaar, N.R., Willemsen, A.T. and van Dalen, J.A. 2013. Optimized dose regimen for whole-body FDG-PET imaging. EJNMMI research 3: 63.
- 5 Everaert, H., Vanhove, C., Lahoutte, T., Muylle, K., Caveliers, V., Bossuyt, A., et al. 2003. Optimal dose of 18F-FDG required for whole-body PET using an LSO PET camera. Eur. J. Nucl. Med. Mol. Imaging 30: 1615–1619.
- 6 Fukukita, H., Suzuki, K., Matsumoto, K., Terauchi, T., Daisaki, H., Ikari, Y., et al. 2014. Japanese guideline for the oncology FDG-PET/CT data acquisition protocol: synopsis of Version 2.0. Ann. Nucl. Med. 28: 693–705.
- 7 Halpern, B.S., Dahlbom, M., Quon, A., Schiepers, C., Waldherr, C., Silverman, D.H., et al. 2004. Impact of patient weight and emission scan duration on PET/CT image quality and lesion detectability. J. Nucl. Med. 45: 797–801.
- 8 Halpern, B.S., Dahlbom, M., Auerbach, M.A., Schiepers, C., Fueger, B.J., Weber, W.A., et al. 2005. Optimizing imaging protocols for overweight and obese patients: a lutetium orthosilicate PET/CT study. J. Nucl. Med. 46: 603–607.
- 9 Kangai, Y. and Onishi, H. 2016. Acquisition time optimization of positron emission tomography studies by use of a regression function derived from torso cross-sections and noise-equivalent counts. Radiol. Phys. Technol. 9: 161–169.
- 10 Lartizien, C., Comtat, C., Kinahan, P.E., Ferreira, N., Bendriem, B. and Trebossen, R. 2002. Optimization of injected dose based on noise equivalent count rates for 2- and 3-dimensional whole-body PET. J. Nucl. Med. 43: 1268–1278.
- 11 Masuda, Y., Kondo, C., Matsuo, Y., Uetani, M. and Kusakabe, K. 2009. Comparison of imaging protocols for 18F-FDG PET/CT in overweight patients: optimizing scan duration versus administered dose. J. Nucl. Med. 50: 844–848.
- 12 Maebatake, A., Akamatsu, G., Miwa, K., Tsutsui, Y., Himuro, K., Baba, S., et al. 2016. Relationship between the image quality and noise-equivalent count in time-of-flight positron emission tomography. Ann. Nucl. Med. 30: 68–74.
- 13 McDermott, G/M., Chowdhury, F.U. and Scarsbrook, A.F. 2013. Evaluation of noise equivalent count parameters as indicators of adult whole-body FDG-PET image quality. Ann. Nucl. Med. 27: 855–861.
- 14 Menezes, V.O., Machado, M.A., Queiroz, C.C., Souza, S.O., d’Errico, F., Namias, M., et al. 2016. Optimization of oncological 18F-FDG PET/CT imaging based on a multiparameter analysis. Med. Phys. 43: 930–938.
- 15 Mizuta, T., Senda, M., Okamura, T., Kitamura, K., Inaoka, Y., Takahashi, M., et al. 2009. NEC density and liver ROI S/N ratio for image quality control of whole-body FDG-PET scans: comparison with visual assessment. Mol. Imaging Biol. 11: 480–486.
- 16 Nagaki, A., Onoguchi, M. and Matsutomo, N. 2011. Patient weight-based acquisition protocols to optimize (18)F-FDG PET/CT image quality. J. Nucl. Med. Technol. 39: 72–76.
- 17 Shimizu, K., Yamamoto, S., Matsumoto, K., Hino, M. and Senda, M. 2016. Image quality and variability for routine diagnostic FDG-PET scans in a Japanese community hospital: current status and possibility of improvement. Jpn J. Radiol. 34: 529–535.
- 18 Scheffé, H. 1952. An analysis of variance for paired comparisons. J. Am. Stat. Assoc. 47: 381–400.
- 19 Tatsumi, M., Clark, P.A., Nakamoto, Y. and Wahl, R.L. 2003. Impact of body habitus on quantitative and qualitative image quality in whole-body FDG-PET. Eur. J. Nucl. Med. Mol. Imaging 30: 40–45.
- 20 Watson, C.C., Casey, M.E., Bendriem, B., Carney, J.P., Townsend, D.W., Eberl, S., et al. 2005. Optimizing injected dose in clinical PET by accurately modeling the counting-rate response functions specific to individual patient scans. J. Nucl. Med. 46: 1825–1834.
- 21 Wickham, F., McMeekin, H., Skillen, A., Burniston, M., Wagner, T., Pencharz, D., et al. 2016. Patient specific optimisation of administered activity and acquisition times for F-18 FDG PET imaging. J. Nucl. Med. 57 (supplement 2): 1976.