Abstract
Identifying the electrical properties of cancer relies on the understanding of the electric potential (EP) of cancer tissues. This study aimed to investigate the EP properties in 49 pancreatic head cancer tissues using a digital multimetre. The anode was placed at the central side of the tumour, and the electric potential differences (EPDs) between cancerous and cancerous, cancerous and noncancerous, and noncancerous and noncancerous lesions at approximately 1-cm intervals following resection were evaluated. Pathological evaluation identified 30 of these samples as pancreatic invasive ductal carcinoma (PIDC, 10 without preoperative chemotherapy and 20 after chemotherapy), seven other pancreatic cancers, three tumours of Vater’s ampulla (VA), and eight extrahepatic cholangiocarcinoma (EHCC) samples. We also evaluated the differences in pH for cancerous and noncancerous lesions in nine PIDC samples. Our data suggest that the EP of pancreatic cancerous tissues is higher than that of noncancerous tissues, especially in PIDCs. We also noted that EPD was the highest when comparing cancerous and noncancerous lesions. Additionally, PIDC tissues presented with low pH; the pH difference between cancerous and noncancerous sites was significantly correlated with EPD (P = 0.011). These EPDs were also correlated with tumour size in PIDCs and inversely correlated with their response to chemotherapy. The EP values for both the cancerous and noncancerous sites in both the VA tumours and EHCC samples were not significantly different, whereas EPD in PIDC correlated with tumour extension and viable tumour content, suggesting that EPD might be useful for evaluating the viability and effectiveness of neoadjuvant chemotherapy.
INTRODUCTION
The correlation between cancers, their electric potential (EP), and the electrical characteristics of cancer tissues has been a subject of evaluation for more than 50 years. Endo et al. were the first to report a method for diagnosing cancer infiltration using differences in the resting EP of suspect tissues3). In their study, they described a difference in the electric potential (EPD) between the tumour and noncancerous tissues of both patients with cervical cancer and mice with transplanted cancer, facilitating the diagnosis of cancer using EPD. Later, Woodrough et al. investigated the EPD between basal cell carcinoma of the skin, benign inflammation, and normal tissues and concluded that skin cancers may exhibit positive EP when compared to that of normal or benign tissues11). Marino et al. measured the EP of breast tissues in patients with permissible breast masses and reported that EP was only significantly positive in patients with cancerous masses5). In 2018, Cheng and Fu investigated the effective permeability of microwaves using breast tissue and reported that breast cancer tissues exhibited substantially higher conductivity than those of normal breast tissues and benign tumours, confirming that EPD can be used to detect breast cancer and further support its potential application in cancer diagnosis1). Several recent studies have focused on the impedance and dielectric constant of cancer cells; however, most of these studies have focused on the electrical characteristics of individual cancer cells.
Here, we investigated the EP of cancer tissues and EPD between cancer and noncancerous tissues when cancer cells gather to form large tumours such as in pancreatic head cancers.
MATERIALS AND METHODS
Patients
We recruited 49 patients diagnosed with pancreatic head tumours who underwent surgery between August 2018 and April 2021 for this study. We then immediately evaluated the EPD and pH of the resected specimens in our pathological laboratory to facilitate pathological diagnosis. The pathological findings of these 49 tumours identified 30 as pancreatic invasive ductal carcinomas (PIDC), four as intraductal papillary mucinous neoplasms (IPMNs), two as neuroendocrine neoplasms (NENs), one as a solid pseudopapillary neoplasm, eight as extrahepatic cholangiocarcinomas (EHCCs), and four as tumours of Vater’s ampulla (VA) (three adenocarcinomas and one adenoma) (Table 1).
Table 1
Clinical profile of our patient cohort
| No. |
Cancer |
Age (y)/sex |
major axis (mm) |
INF |
ly |
v |
ne |
mpd |
pT |
N |
M |
NAC |
TDR (%) |
| 1 |
PIDC |
83/M |
38 |
c |
1 |
0 |
1 |
− |
|
1 |
0 |
ND |
|
| 2 |
PIDC |
61/M |
22 |
b |
3 |
3 |
2 |
0 |
|
2 |
0 |
ND |
|
| 3 |
PIDC |
74/F |
25 |
c |
2 |
2 |
3 |
0 |
|
1 |
0 |
ND |
|
| 4 |
PIDC |
74/F |
15 |
b |
1 |
0 |
1 |
0 |
|
1 |
0 |
ND |
|
| 5 |
PIDC |
78/F |
40 |
c |
1 |
2 |
3 |
0 |
2 |
1 |
0 |
ND |
|
| 6 |
PIDC |
81/F |
35 |
c |
0 |
1 |
1 |
1 |
2 |
2 |
0 |
ND |
|
| 7 |
PIDC |
67/M |
44 |
c |
0 |
0 |
2 |
0 |
3 |
1 |
0 |
ND |
|
| 8 |
PIDC |
81/M |
30 |
c |
1 |
2 |
1 |
0 |
2 |
2 |
0 |
ND |
|
| 9 |
PIDC |
69/F |
24 |
b |
1 |
1 |
2 |
1 |
2 |
1 |
0 |
ND |
|
| 10 |
PIDC |
90/F |
19 |
c |
1 |
2 |
3 |
0 |
1c |
1 |
0 |
ND |
|
| 11 |
PIDC |
76/M |
13 |
c |
0 |
0 |
1 |
0 |
1c |
0 |
0 |
done |
90 |
| 12 |
PIDC |
57/M |
30 |
c |
0 |
1 |
3 |
0 |
2 |
0 |
0 |
done |
30 |
| 13 |
PIDC |
75/M |
20 |
b |
0 |
1 |
1 |
− |
|
0 |
0 |
done |
70 |
| 14 |
PIDC |
71/M |
25 |
b |
1 |
1 |
3 |
0 |
2 |
1 |
0 |
done |
20 |
| 15 |
PIDC |
72/M |
58 |
c |
1 |
1 |
3 |
0 |
3 |
2 |
0 |
done |
10 |
| 16 |
PIDC |
64/M |
25 |
b |
1 |
0 |
1 |
+ |
2 |
0 |
0 |
done |
30 |
| 17 |
PIDC |
54/F |
20 |
c |
1 |
0 |
1 |
0 |
1c |
0 |
0 |
done |
60 |
| 18 |
PIDC |
64/M |
22 |
b |
1 |
1 |
0 |
(−) |
|
2 |
0 |
done |
UD |
| 19 |
PIDC |
47/M |
53 |
b |
2 |
2 |
2 |
1 |
3 |
1 |
0 |
done |
20 |
| 20 |
PIDC |
59/F |
35 |
c |
1 |
1 |
3 |
0 |
2 |
1 |
0 |
done |
40 |
| 21 |
PIDC |
35/F |
18 |
c |
0 |
1 |
1 |
|
|
1 |
0 |
done |
20 |
| 22 |
PIDC |
85/F |
21 |
c |
0 |
1 |
3 |
1 |
2 |
1 |
0 |
done |
30 |
| 23 |
PIDC |
67/M |
32 |
c |
1 |
2 |
3 |
1 |
2 |
0 |
0 |
done |
40 |
| 24 |
PIDC |
57/M |
42 |
c |
1 |
2 |
3 |
1 |
3 |
1 |
0 |
done |
70 |
| 25 |
PIDC |
83/F |
25 |
|
0 |
0 |
1 |
1 |
2 |
1 |
0 |
done |
UD |
| 26 |
PIDC |
89/M |
30 |
c |
0 |
1 |
2 |
1 |
3 |
0 |
0 |
done |
40 |
| 27 |
PIDC |
75/M |
43 |
c |
1 |
0 |
1 |
1 |
3 |
1 |
0 |
done |
30 |
| 28 |
PIDC |
73/F |
30 |
c |
1 |
1 |
1 |
1 |
2 |
0 |
0 |
done |
30 |
| 29 |
PIDC |
81/F |
39 |
c |
0 |
1 |
1 |
1 |
2 |
0 |
0 |
done |
20 |
| 30 |
PIDC |
75/M |
40 |
c |
c |
0 |
3 |
1 |
2 |
2 |
0 |
done |
60 |
| 31 |
IPMN |
57/F |
35 |
b |
0 |
0 |
0 |
0 |
Tis |
0 |
0 |
ND |
|
| 32 |
IPMN |
61/M |
45 |
a |
0 |
0 |
0 |
0 |
Tis |
0 |
0 |
ND |
|
| 33 |
IPMN |
71/F |
20 |
b |
0 |
0 |
0 |
1 |
Tis |
0 |
0 |
ND |
|
| 34 |
IPMN |
75/F |
45 |
b |
0 |
0 |
0 |
1 |
|
0 |
0 |
ND |
|
| 35 |
NENs |
57/M |
5 |
a |
0 |
0 |
0 |
0 |
1 |
0 |
0 |
ND |
|
| 36 |
SPN |
52/F |
20 |
b |
0 |
0 |
1 |
0 |
|
0 |
0 |
ND |
|
| 37 |
NENs |
59/M |
14 |
a |
0 |
0 |
0 |
0 |
|
0 |
0 |
ND |
|
| 38 |
Ac AoV |
66/M |
8 |
b |
0 |
0 |
1 |
|
1a |
0 |
0 |
ND |
|
| 39 |
Tubular adenoma of VA |
55/F |
|
|
|
|
|
|
|
0 |
0 |
ND |
|
| 40 |
AC in adenoma of VA |
67/M |
|
|
0 |
0 |
|
|
|
0 |
0 |
ND |
|
| 41 |
AC VA |
66/M |
35 |
b |
1a |
0 |
|
|
3a |
0 |
0 |
ND |
|
| 42 |
EHCC |
65/M |
|
c |
1 |
2 |
3 |
|
2a |
0 |
|
ND |
|
| 43 |
EHCA |
55/M |
40 |
c |
1 |
2 |
2 |
|
1 |
1 |
|
ND |
|
| 44 |
EHCA |
86/M |
40 |
c |
1 |
1 |
3 |
|
3 |
1 |
|
ND |
|
| 45 |
EHCA |
69/F |
35 |
c |
1 |
0 |
1 |
|
2 |
0 |
|
ND |
|
| 46 |
EHCA |
86/F |
28 |
c |
2 |
2 |
3 |
|
1 |
0 |
|
ND |
|
| 47 |
EHCA |
68/F |
25 |
c |
3 |
2 |
3 |
|
3 |
2 |
1 |
ND |
|
| 48 |
EHCA |
71/F |
45 |
c |
1c |
1c |
|
|
3 |
2 |
0 |
ND |
|
| 49 |
EHCA |
83/F |
53 |
c |
1a |
1a |
|
|
1 |
1 |
0 |
ND |
|
y: years; M: male; F: female; NAC: neoadjuvant chemotherapy; TDR: tumor disappearance rate; PIDC: invasive ductal carcinoma of the pancreas; IPMN: intraductal papillary mucinous neoplasms; NENs: neuroendocrine neoplasms; SPN: solid-pseudopapillary neoplasm; EHCA: extrahepatic cholangiocarcinoma; AC: adenocarcinoma; VA: Vater’s ampulla; ND: not done; UD: undetermined.
The clinical profiles of the patients are summarised in Table 1. The patients’ ages ranged from 35 to 90 years, with a mean of 69.1 years and a median of 69 years. Twenty-nine were male, and 20 were female. The pathological findings of the resected specimens and their TNM factors were determined using the 8th edition of the International Union Against Cancer and the American Joint Committee on Cancer TNM Classification of Malignant Tumors4).
Neoadjuvant chemotherapy (NAC) was performed according to the guidelines for pancreatic cancer and included gemcitabine and S-1 combination therapy or gemcitabine, abraxane, and S-1 combination therapy.
Measurement of Electric Potential (EP)
We used a digital multimetre (PM3, SANWA, Tokyo, Japan) to measure the EPD between cancerous and cancerous, cancerous and noncancerous, and noncancerous and noncancerous tissues at intervals of approximately 1 cm across the length of the surgically resected specimens that were brought into the pathology laboratory for the preparation of resected tissues for the histological evaluation of pathologists’. The measurement interval might influence the EP by ensuring that both electrodes were placed in parallel, ensuring the even distribution of 1-cm intervals. The tumour was cracked by a pathologist, and the cross-section of the tumour and its surrounding noncancerous tissue were measured using the gold-plated electrodes of the potential measuring device. These measurements were all performed with the red electrode (anode) placed at the centre of the cancer tissue and the black electrode (cathode) placed in the normal tissue (Figure 1).
pH measurement
We used a benchtop water quality PH meter (PH HORIBA’s desktop pH meter F71, HORIBA Advanced Techno, Co, Ltd., Kyoto, Japan) and ISFETPH electrode 0040N-10D (HORIBA Advanced Techno, Co., Ltd.) to compare the pH of the cancerous and noncancerous tissues in nine cases. The difference in pH was then calculated by comparing the pH data from the cancerous and noncancerous portions of the resected tissues.
Validation of the measurement process
The EP was measured in all tissues immediately after resection in all 49 cases, and pH values were also measured in nine PIDC samples at the same time. These nine samples were resected after chemotherapy. All of the measurement images were stored as movies and recorded using a digital camera to capture the changes in electrode positioning, so that measurements could be evaluated clearly. After pathological examination of these samples, histological findings and images of the tumour specimens were compared to confirm the position of the measurement, the degree of infiltration, the rate of necrosis, and the exact tumour size (Figure 1).
Histological findings
All specimens were evaluated using haematoxylin and eosin (H&E) staining by clinical pathologists, and the pathological diagnoses of these tumours are described in Table 1. In tumours resected from patients receiving NAC, the rates of tumour necrosis were routinely estimated by clinical pathologists. These rates were evaluated for the rates of cancer cells and mesenchymal tissues in the H&E-stained specimens and conducted into the pathological report in each case.
Statistical analysis
All statistical analyses were performed using SPSS software version 17.0 (IBM®, Armonk, NY). Continuous data are expressed as the mean ± standard deviation, and statistical analyses were performed using Fisher’s exact test, Student’s t-test, or Spearman’s correlation, as appropriate. The association between two quantitative values was assessed using Pearson correlation or Spearman’s correlation when the data did not follow a normal distribution. All reported P-values were determined using two-sided evaluations, and statistical significance was set at P < 0.05.
Ethical approval
Our study was approved by the Hiroshima University Institutional Review Board (E-189). Written informed consent was obtained from all patients, and all evaluations and collections were completed in accordance with the guidelines of the Declaration of Helsinki6).
RESULTS
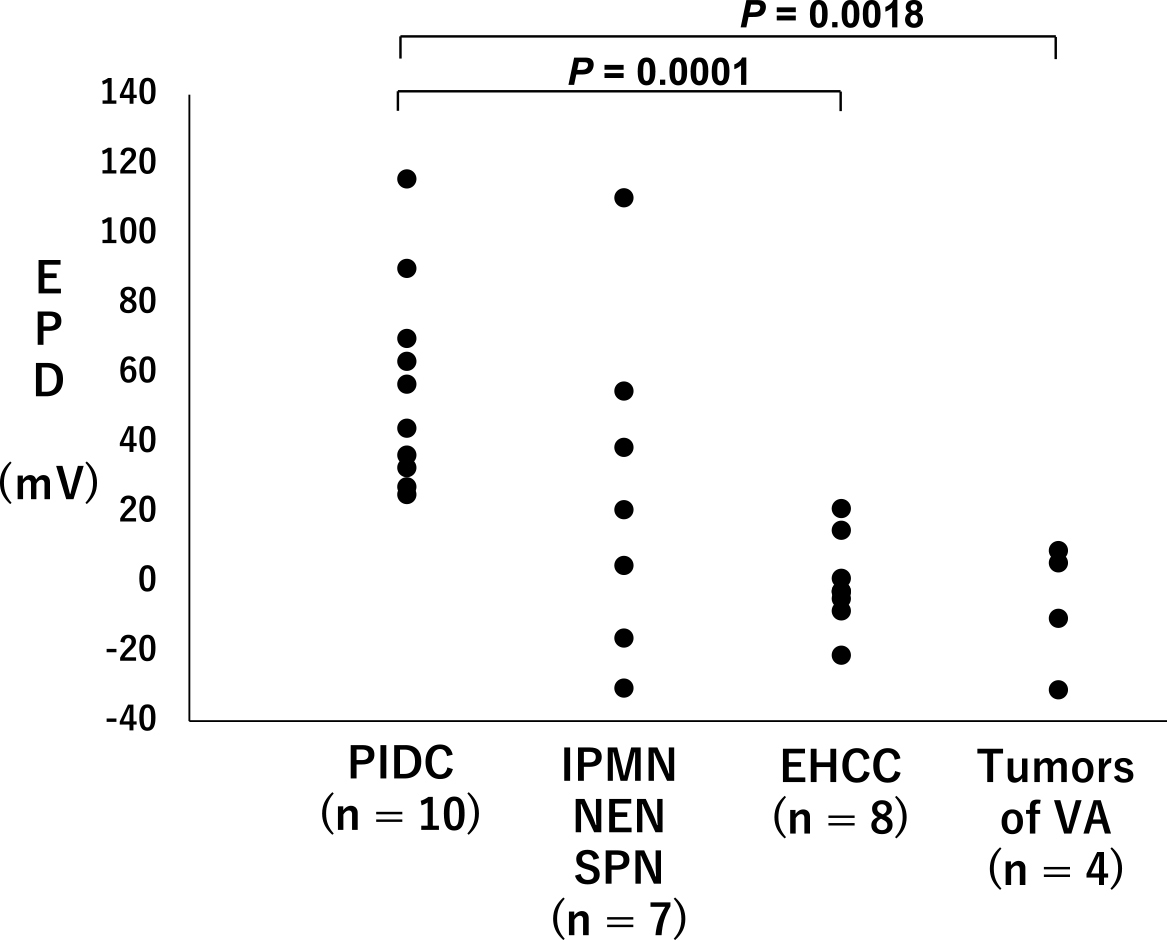
The EPD for the cancerous and noncancerous lesions in each case is described in Figure 2, with the data categorised by their origin. The average EPD of PIDCs with no NAC was 56.24 ± 29.46 mV (n = 10), which was significantly higher than that of the other tumour tissues evaluated here (n = 19; 8.11 ± 32.90; P = 0.0006).
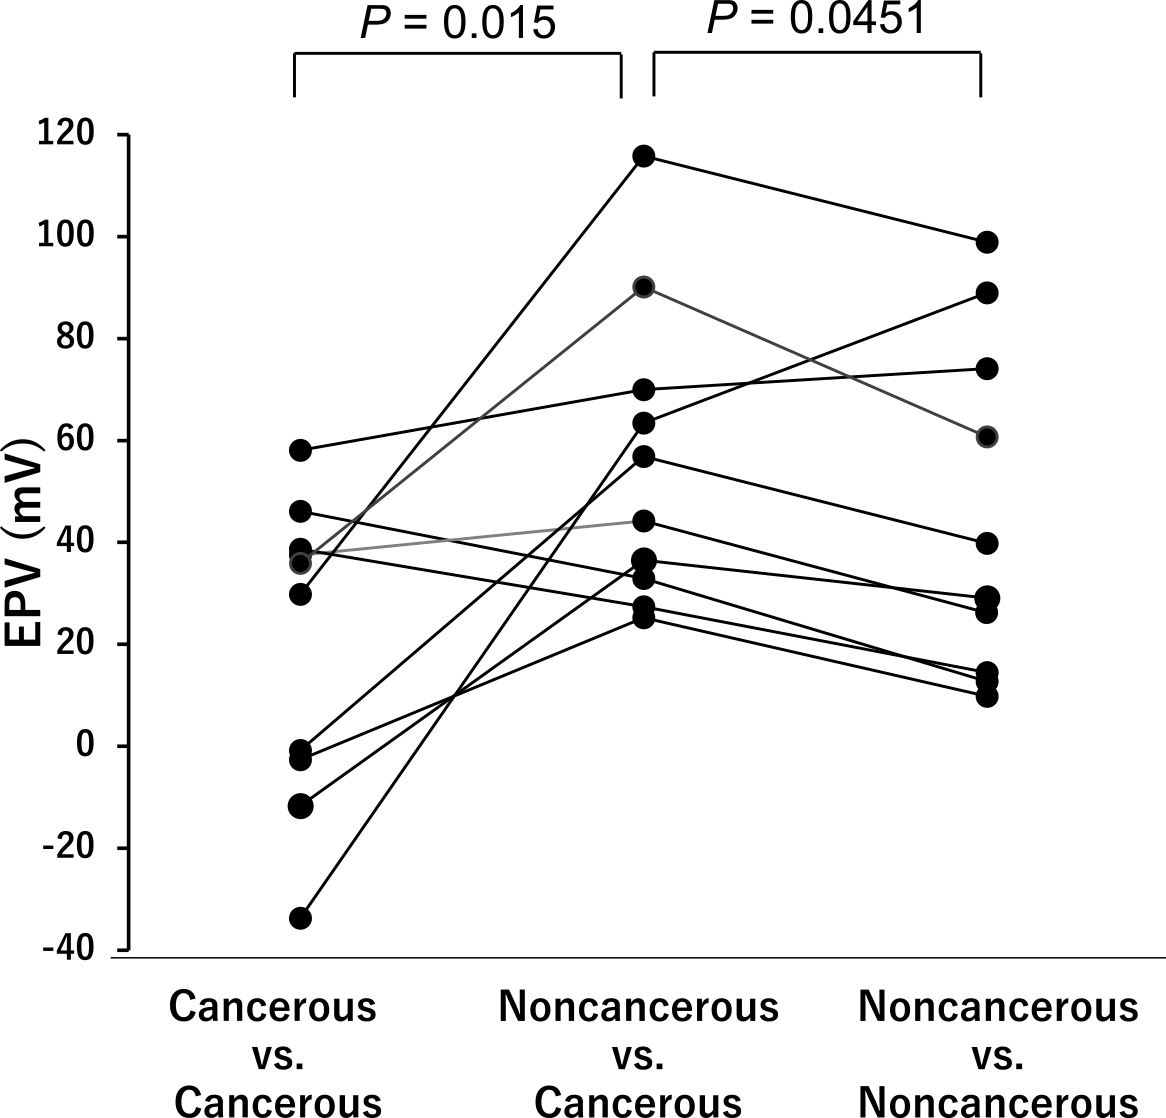
We then compared the EPD values for these PIDC samples resected with no NAC as follows: cancerous and cancerous, cancerous and noncancerous, and noncancerous and noncancerous lesions (Figure 3). The EPDs between the cancerous and noncancerous lesions were significantly higher than those of the other two groups (P = 0.015 and P = 0.045, respectively), indicating that cancerous tissues of PIDC might be positively charged.
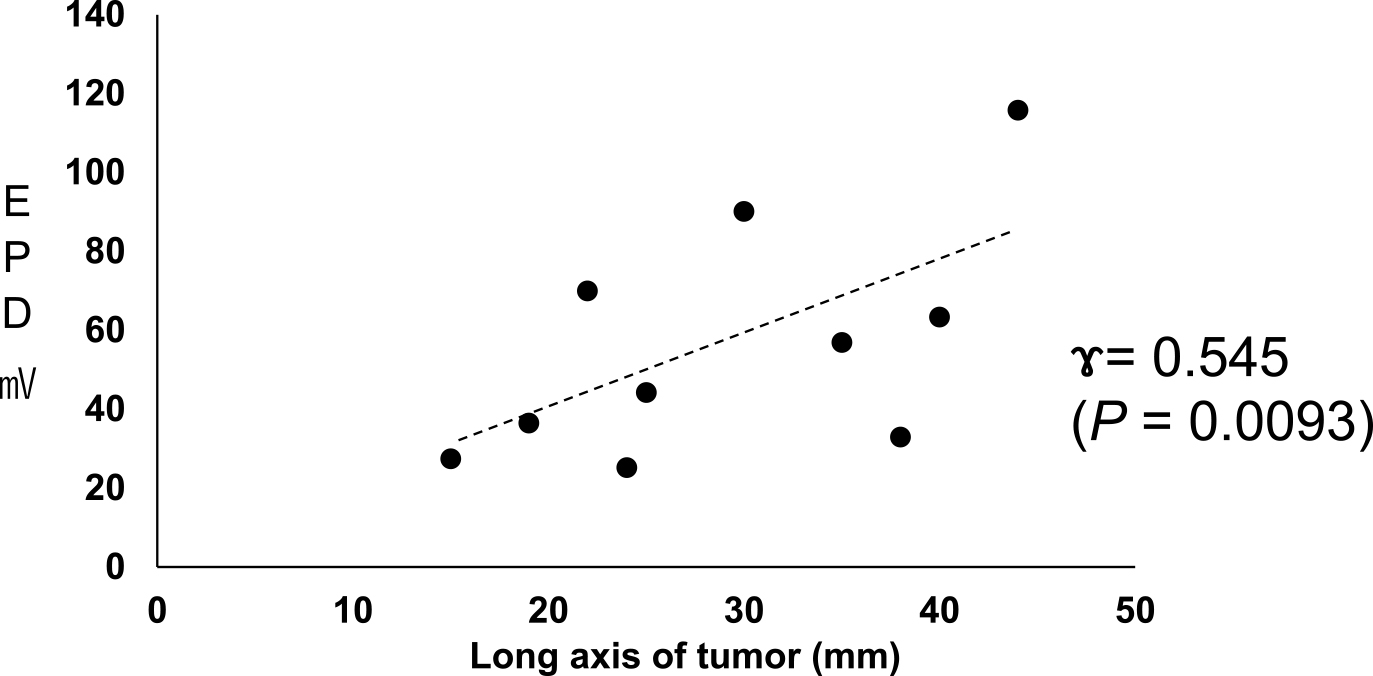
We then compared the changes in EPD across the long axis for cancerous and noncancerous sites (Figure 4). These evaluations revealed that as the length of the long axis increased, the potential difference between the cancerous and noncancerous tissues of PIDC with no NAC increased (n = 10, P < 0.01). The correlation coefficient was 0.545 (P = 0.0093). However, this trend was reversed in the EHCC samples, where EPD decreased with increasing diameter (data not shown).
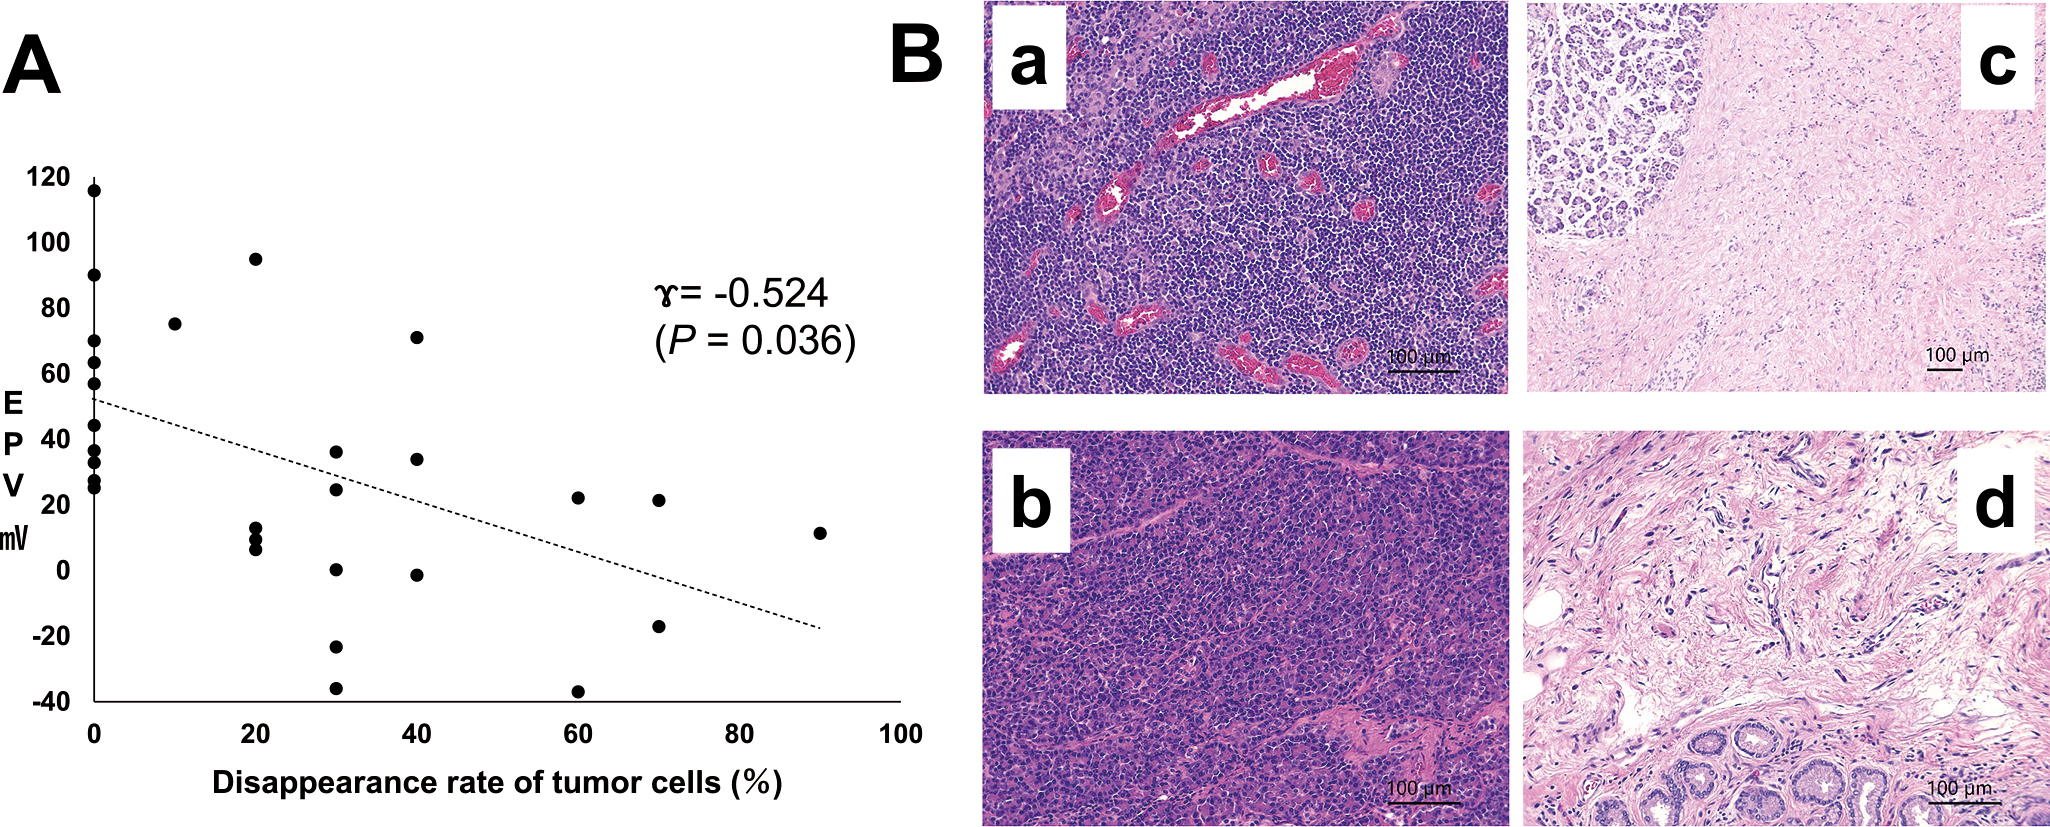
The disappearance rates of cancer cells in the resected PIDC followed by NAC that were routinely evaluated by professional pathologists ranged from 10% to 90% (n = 18; mean, 39.4%). Figure 5A demonstrates the relationship between these disappearance rates and the EPD between cancerous and noncancerous sites in PIDCs, including those resected without NAC. These data identified an inverse relationship between these two factors, as decreasing EPD facilitated a significant increase in cancer cell disappearance rates following NAC (Figure 5A, γ = −0.524, P = 0.036, n = 28). This was later validated in the histological evaluations, which revealed that PIDC specimens with low EPDs experienced increased tumour fibrosis following NAC (Figure 5B).
Measurement of pH at the cancerous and noncancerous sites
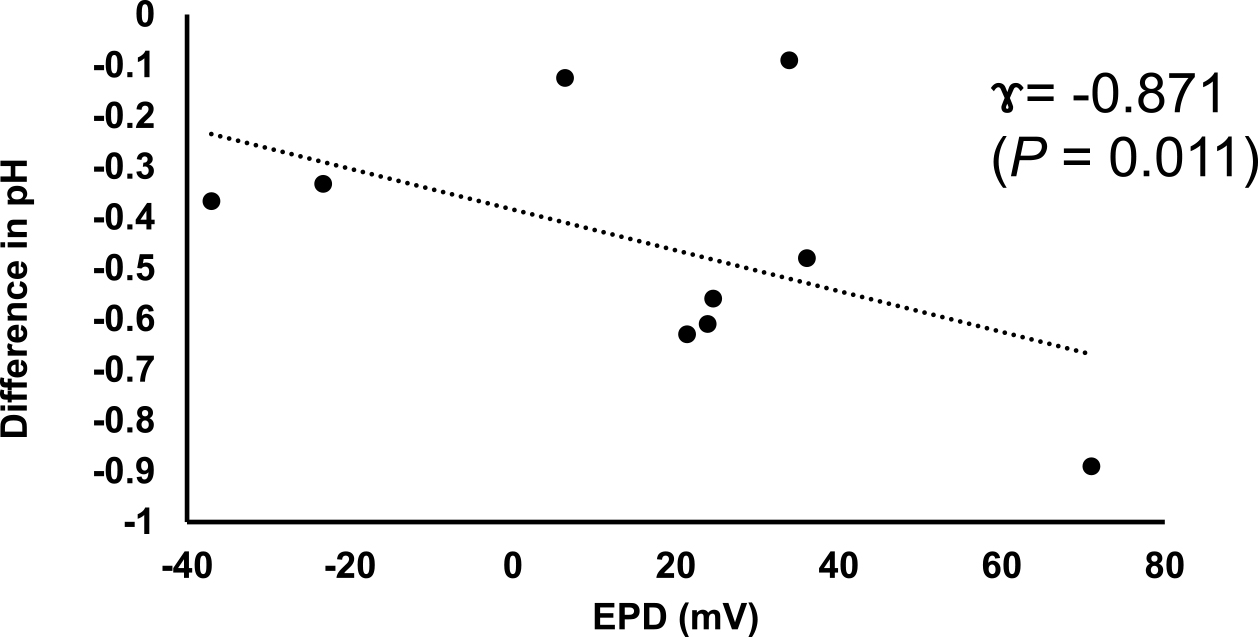
In the PIDC samples resected following NAC, the pH levels of the cancerous sites (n = 9) were shown to be between 6.73 and 7.85 (mean, 6.98), which were significantly lower than those of noncancerous sites (7.21–7.98, mean: 7.54) (P = 0.011). In addition, our evaluations revealed that these differences in pH were significantly correlated with the EPD in the PIDC specimens (Figure 6, P = 0.011). These data suggest that a decrease in pH may contribute to the increased EP of PIDC tissues.
DISCUSSION
Cancer tissue, especially pancreatic cancer tissues, is assumed to exhibit specific potential changes that allow them to be differentiated from their noncancerous adjacent tissues. This difference is believed to be derived from the difference in the pH of the cancerous and noncancerous tissues, which is supported by the Nernst equation10) that states that when the pH decreases, the potential increases. This change in pH is largely attributed to the Warburg effect, which mediates the accumulation of lactic acid in pancreatic cancer cells, resulting in significant changes in the pH of these tissues9). The Warburg effect is a term used to describe the phenomenon in which cancer cells produce adenosine triphosphate (ATP) via glycolysis rather than oxidative phosphorylation, even under aerobic conditions. Glucose does not enter the mitochondria after being metabolised via the glycolysis system, resulting in the accumulation of lactic acid8). Previous reports have also demonstrated that the development of pancreatic cancer is accelerated by the overexpression of endoplasmic reticulum oxidoreductase 1 alpha, which promotes the Warburg effect and increases the lactic acid concentration in tumour tissues12). Here, our data show that EPD was higher in larger than in smaller tumours, suggesting that EPD may increase with tumour growth. Conversely, EPD was inversely correlated with tumour disappearance rates in pancreatic cancer tissues resected after NAC, suggesting that differences in the EP between cancerous and noncancerous tissues may reflect the number of viable cancer cells remaining in the resected tissues. Histological examination supported these conclusions, which revealed that tissues with low EPD also presented with a lower percentage of viable cancer cells. Therefore, EPD may be a useful marker for evaluating the viable tumour content in pancreatic organs.
However, this effect was not observed in any type of tumour. Here, we report that tumours of the VA demonstrate low EPDs, which might be correlated with their small size and their tendency to be benign in these patients. Conversely, extrahepatic EHCC showed a decrease in EPD between cancerous and noncancerous tissues, suggesting that the EP of the cancerous tissues is decreased when compared to that of healthy controls. Pastore et al. reported that EHCC reverses the Warburg effect by altering its metabolism from aerobic glycolysis to oxidative phosphorylation following the upregulation of peroxisome proliferator-activated receptor γ coactivator-1α (PGC-1α)2,7). As a result, lactic acid production is reduced in EHCC, and the potential difference between cancer and normal tissues is significantly reduced when compared to that of PIDC. Therefore, cancer cell EP may differ based on the origin of the cancer.
In conclusion, changes in the EP of cancerous tissues in specific types of pancreatic cancers are likely due to the Warburg effect, and EPD may be correlated with tumour progression. The EPD decreased in treated tumour specimens with higher tumour disappearance rates. The EPD might also be useful for the evaluation of tumour malignancy grading and the effectiveness of chemotherapy in pancreatic cancer.
In this report, we only measured the cracked face of pancreatic head cancer tissues. The EP might be different between the surface and centre of tumours and among the cancers derived from various tissues; in fact, EP did not change in EHCC, suggesting that EP should be independently evaluated for different types of cancers. We should clarify the reason for the EPD in cancers and apply this information to apply new therapeutic approaches as well as evaluate prognostic factors, including the effect of chemotherapy in the future.
ACKNOWLEDGEMENTS
The authors would like to thank all the patients who participated in this study, the members of the Department of Surgery at the Graduate School of Biomedical and Health Sciences at Hiroshima University for providing clinical support, the members of the Department of Pathology at Hiroshima University Hospital for evaluating the EPD, and the members of the Natural Science Center for Basic Research and Development at Hiroshima University for their technical support.
Author contributions
SI, YM, and EH designed the study. YM and KU provided the clinical materials. KM and KA suggested evaluating the EPD in each of the pathological specimens and performed histological analysis. TH, MK, and SU analysed the EPD and pH data.
Conflicts of interest
The authors declare no conflict of interest.
Funding
This research was partially supported by a Grant-in-Aid for Scientific Research (A) (Nos. 15H02567 and 17H05102) from the Ministry of Education, Culture, Sports, Science, and Technology, and the Ministry of Health, Labour, and Welfare for Japan.
REFERENCES
- 1 Cheng, Y. and Fu, M. 2018. Dielectric properties for non-invasive detection of normal, benign, and malignant breast tissues using microwave theories. Thorac. Cancer 9: 459–465. [PMC5879051 10.1111/1759-7714.12605]
- 2 Dan, L., Wang, C., Ma, P., Yu, O., Gu, M., Dong, L., et al. 2018. PGC1alpha promotes cholangiocarcinoma metastasis by upregulating PDHA1 and MPC1 expression to reverse the Warburg effect. Cell Death Dis. 9: 466. [PMC5919932 10.1038/s41419-018-0494-0]
- 3 Endo, Y. 1969. [Diagnosis of cancer invasion by means of static electric potential measurement]. Nihon Sanka Fujinka Gakkai Zasshi 21: 153–162.
- 4 Kakar, S., Pawlik, T.M. and Allen, P.J. Exocrine Pancreas. Pancreatic adenocarcinoma. Amin, M.B., editor. New York: Springer-Verlag; 2016.
- 5 Marino, A.A., Morris, D.M., Schwalke, M.A., Lliev, I.G. and Rogers, S. 1994. Electrical potential measurements in human breast cancer and benign lesions. Tumour Biol. 15: 147–152. [10.1159/000217885]
- 6 Morris, K. 2013. Revising the Declaration of Helsinki. Lancet 381: 1889–1890. [10.1016/ s0140-6736(13)60951-4]
- 7 Pastore, M., Lori, G., Gentilini, A., Taddei, M.L., Maira, G.D., Campani, C., et al. 2020. Multifaceted Aspects of Metabolic Plasticity in Human Cholangiocarcinoma: An Overview of Current Perspectives. Cells 9. [PMC7140515 10.3390/cells9030596]
- 8 Potter, M., Newport, E. and Morten, K.J. 2016. The Warburg effect: 80 years on. Biochem. Soc. Trans. 44: 1499–1505. [PMC5095922 10.1042/BST20160094]
- 9 Tumas, J., Kvederaviciute, K., Petrulionis, M., Kurlikus, B., Rimkus, A., Sakalauskate, G., et al. 2016. Metabolomics in pancreatic cancer biomarkers research. Med. Oncol. 33: 133. 10.1007/s12032-016-0853-6]
- 10 Vaidhyanathan, V.S. 1979. Nernst—Planck analog equations and stationary state membrane electric potentials. Bull. Math. Biol. 41: 365–385. 10.1007/BF02460818]
- 11 Woodrough, R.E., Canti, G. and Watson, B.W. 1975. Electrical potential difference between basal cell carcinoma, benign inflammatory lesions and normal tissue. Br. J. Dermatol. 92: 1–7.
- 12 Zhang, J., Yang, J., Lin, C., Liu, W., Huo, Y., Yang, M., et al. 2020. Endoplasmic Reticulum stress-dependent expression of ERO1L promotes aerobic glycolysis in Pancreatic Cancer. Theranostics 10: 8400–8414. doi: 10.7150/thno.45124. eCollection 2020