Abstract
The moisture contents of several synthetic and natural goethite-bearing samples were determined by the loss-of-mass method and by the Karl-Fischer titration. It was found that drying at 105°C did not remove all the water from these samples, and that temperatures above 200°C would be required to completely remove the adsorbed water. The multiple peaks observed in the TGA and DSC measurements are not due to the dehydroxylation of goethite, but are due to the release of adsorbed water. The decomposition of goethite into hematite occurs with the release of adsorbed water from room temperature up to the onset of the main dehydroxylation peak. The dehydroxylation occurs in a broad range of temperatures due to the existence of a particle-size distribution, surface hydroxyls and formation of a hematite coating. The determination of all adsorbed water is best performed by adding the powdered sample into the Karl-Fischer reaction vessel.
1. Introduction
The world production of usable iron ore in 2010 reached the astonishing amount of 2.59 × 10⁹ metric tons.1)
The standard method to determine the total iron content in ores is the ISO 2597-2:2008, which makes use of a titrimetic method with potassium dichromate as the titrant. Prior the analysis, the material should be dried in order to remove the moisture and hence the results can be given on a dry sample basis. The moisture determination in iron ores is regulated by two ISO standards (2596:2006 and 3087:2011). The hygroscopic moisture may be determined by a gravimetric, Karl Fischer or mass-loss methods. In any of them, the sample is to be heated at 105 ± 2°C for periods of time up to twenty four hours in order to remove the moisture. The possible underestimation of hygroscopic moisture by drying at 100°C was recently discussed by Strezov et al.2)
The so-called “combined water” is defined by the ISO 7335:1987 as the amount of water that is liberated by heating between 105 ± 2°C and 950 ± 20°C. In this case, the water content is solely determined by a Karl Fischer titration.
Hematitic iron-rich ores are becoming scarce worldwide and hence new mines are being developed to process ores with low iron contents. These ores normally consist of a mixture of hematite, martite, magnetite, goethite and quartz (major constituents) and kaolinite, gibbsite, siderite, along with many other minor phases. The enrichment in terms of iron is firstly done by washing the ore, which generates a huge amount of slime. These slimes are normally richer in goethite, owing to the smaller particles sizes of this phase. The next step in concentrating the ores is the flotation, which is meant to separate quartz from the ferruginous phases.3)
Thus, some iron ores that are currently mined worldwide might contain a large amount of goethite, which means a higher amount of “combined water”.4) From the minerals that are the constituents of iron ores, goethite is exactly the one that has the highest surface area and thus can contain the highest amount of adsorbed water.5) In addition, goethite contains structural hydroxyls that are converted in water upon heating at temperatures around 300°C.
2. Background
The surfaces properties of the most common iron oxyhydroxides are well documented and a good summary can be found in the work of Cornell and Schwertmann5) and references therein. For the sake of brevity only the most relevant aspects of goethite will be given in this account.
Typical thermo gravimetric curves (TGA) for a synthetic goethite (GD) and two natural iron ores containing 7% (KE01) and 30% (KE07) of goethite are shown in Fig. 1. Similar curves have been reported by several authors.6,7,8,9) The interpretation of these curves is at first sight rather simple: the initial loss of mass up to 100°C is due to moisture, whereas the major loss of mass near 250°C (GD) and 310°C (KE01 and KE07) is due to the decomposition of goethite. The different decomposition temperatures are related to the origin of the goethites present in these samples. Normally synthetic goethite dehydrates at lower temperatures, compared to natural samples, mainly due to their smaller particles sizes.5)

The stoichiometric loss of water according to the equation: 2FeOOH → Fe2O3 + H20 is 10.13%. The loss of mass observed for a certain sample can be used to estimate the amount of goethite, if we use the stoichiometric value given above. However, several researchers have reported values well above 10.13% for goethite.8,9,10,11) Hydroxyl content as high as 19% was reported for two samples prepared from oxidation of Fe2+.9,12) Hence, the possible existence of an excess of hydroxyl groups can cause serious errors in the quantification of goethite by the loss of mass method.
Another striking feature of the curves for GD and KE07 (Fig. 1) is the continuous loss of mass up to the dehydroxylation transition. The synthetic sample shows a much more pronounced effect, but for the natural ore KE07 it can be seen a quite large difference in the losses of masses up to 105°C and 200°C for example. On the other hand, for the KE01 a flat region is observed from 100°C to 200°C.
Many papers in literature discussed the losses of mass of goethite in three different temperature ranges, and a variety of terms has been used to define these losses:
- The first region up to about 150°C is named moisture, hydroscopic moisture, surface water, onset of bulk and surface dehydration, non-stoichiometric hydroxyl units (excess water), surface adsorbed water, chemisorbed surface water and adsorbed water;2,7,8,10,12,13,14,15)
- The second region goes up to about 200–230°C, depending on the sample characteristics (particle size, morphology, synthetic or natural, etc.) and is named as bulk dehydration and surface dehydration/dehydroxylation, non-stoichiometric water from bulk and surface, weakly bound OH groups, surface-bound and bulk-sequestered water, loosely bound hydroxyl units, dehydration from hydrogen-bonded water or dehydroxylation of surface;6,14,15,16,17)
- The third region comprises the transformation of goethite into hematite, which is completed below 400°C. This loss of mass has been termed as structural hydroxyl, bulk dehydroxylation, intrinsic dehydroxylation, dehydroxylation, non-stoichiometric hydroxyl units, strongly bounded water and OH groups;2,6,10,12,14,15,16,17)
This variety of names arises from the fact that the goethite surface is highly reactive, owing to the presence of terminal OH groups.5) The existence of adsorbed water molecules and OH groups has been investigated by many authors, and it is a common finding that many different configurations exist for the hydrogen bonding, the most important being those related to the {1 1 0} plane.14,18,19) The hydrogen bonding can occur with singly-coordinated, doubly-coordinate and triply-coordinate oxygens, resulting in different bond lengths for the several configurations. Thus, it is reasonable to anticipate that the removal of water from the surface of goethite will be a multi-stage process, each one requiring a different temperature. In this sense, the proposition of Ford and Bertsch6) seems to be a good approach: water removal and dehydroxylation of surface OH groups occur at temperatures below the single bulk dehydroxylation of goethite.
Another controversial aspect of the thermal transformation of goethite into hematite is related to the appearance of multiple losses of masses in the TGA analysis, which are better seen in the derivative curve. The differential thermal analysis (DTA) and the differential scanning calorimetry also allow a visualization of the consecutive events that occur during the transformation to hematite.
The existence of a double dehydroxylation peak of goethite was investigated by Schwertmann,20) who proposed the existence of an intermediate goethite to explain the existence of the high temperature peak. However, this proposition does not explain the existence of up to four peaks just before the main dehydroxylation transition to hematite.
The fundamental question in terms of moisture determination in goethite-bearing ores is as follows: what is the maximum temperature that can be used to completely remove water from the ore? Thus, we intend to show in this contribution the problems involving the determination of the water and we also intend to propose another method to better determine the contents of both adsorbed and structural water.
3. Experiment
Several iron and manganese ore samples from the Iron Quadrangle, Minas Gerais State (Brazil) were collected and the fractions below 0.15 mm were used. Synthetic samples of goethite, Al-goethite and hematite prepared by a variety of methods were also used in this study. All samples were stored in the laboratory in plastic bags or glassware, some of them for many years, without any precaution regarding absorption of moisture from the atmosphere. All tests were carried out without any prior heat treatment of the samples.
The total iron content was analyzed by wet chemical methods, and minor elements were determined by Inductively Coupled Plasma (ICP) after dissolving the samples in hot HCl.
The water contents were measured in a Metrohm Karl Fischer titrator (Titrando 890), using a solution with a titer of about 4 mg/mL. After conditioning the reaction vessel with 25 mL of methanol, about 100–300 mg of each sample was dropped inside the titrator and the water contents were automatically determined by the software Tiamo. The Karl Fischer (KF) solution (Hydra-Point, J. T. Baker) was periodically standardized against distilled water.
Simultaneous thermogravimetric analysis (TGA) and differential thermal analysis (DTA) were performed in a Du Pont SDT2960 module. The temperature ranged from 25°C to 1000°C, using a constant flow of synthetic air (100 ml/min) and a heating rate of 20°C/min. The differential scanning calorimetric (DSC) scans were done in a Du Pont DSC2010 equipment from 25°C to 600°C, using a constant flow of synthetic air (100 ml/min) and a heating rate of 20°C/min. Masses of about 8 mg were evenly spread out in 90 μL alumina pans (TGA) and 30 μL aluminum pans (DSC) to ensure a homogeneous thin layer.
The Mössbauer spectra (MS) were collected at room temperature with a spectrometer using a constant-acceleration drive with triangular reference signal, 512 channels, and in the velocity range of –11 to 11 mm/s (increment of ~0.09 mm/s). The velocity was calibrated from the MS of a standard α-Fe foil at room temperature. Isomer shifts are quoted relative to α-Fe. The spectra were computer-fitted either with discrete Lorentzian sextets and/or doublets or with one distribution of magnetic hyperfine fields.21)
The concentrations of goethite, hematite, martite, specularite and quartz of the natural samples were estimated by a combination of the experimental results obtained from the chemical analysis, Mössbauer spectra and light-reflected microscopy.22)
4. Results and Discussion
4.1. TGA Measurements
The TGA/DSC curves for two synthetic goethites (GE and GU) and for two iron ores (KE02 and NO5) are shown in Fig. 2. The DTA and DTG curves are not shown for the sake of clarity. The relevant parameters derived from these measurements are shown in Table 1. Some properties of sample GE were previously described by da Costa and de Jesus Filho.23) The average particle size of GE is 20 nm, and the particles possess a tabular shape. Sample GU was prepared by a homogeneous precipitation method using urea (unpublished results). The average size of the spindle-shaped particles is 10 nm. Sample KE01 contains 68.0 mass% of total iron, and approximately 64 mass% of specularite, 28 mass% of martite, 8 mass% of goethite and 1 mass% of magnetite.24) Sample KE02 is similar to KE01, but it contains 32 mass% of specularite and 54 mass% of martite. Sample NO5 contains about 70 mass% of goethite.
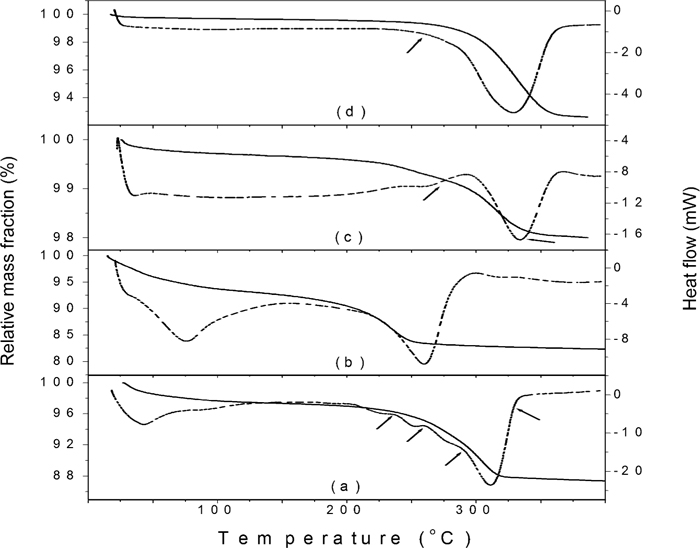
Table 1. Parameters derived from the TGA/DSC measurements. The losses of masses 1 and 2 refer to the losses between 20°C and 100°C, and between 100°C and 400°C, respectively. T
DSC is the temperature of the main DSC peak.
| Sample | Mass loss1 (mass%) | Mass loss2 (mass%) | TDSC (°C) |
|---|
| GE | 2.35 | 11.2 | 311 |
| GUO | 6.20 | 11.0 | 260 |
| KE01 | 0.17 | 1.10 | 340 |
| KE02 | 0.28 | 1.72 | 334 |
| NO5 | 0.30 | 7.09 | 329 |
The dehydroxylation temperature for the GU0 sample is much lower than the other three goethites, although its particle size is not so different from the GE. TEM images have revealed that the GU0 is actually composed of aggregates of much smaller particles, about 3 nm wide. This small size certainly explains the smaller decomposition temperature. The natural samples have larger particles sizes which reflect in a higher dehydroxylation temperature.
The DSC curve for the GE sample clearly shows at least three shoulders before the main dehydroxylation peak centered at 311°C. These shoulders are less visible in other samples, but they do exist in several of them. To investigate whether the losses occurring at low temperatures are related to the release of water or to the decomposition of goethite, we interrupted the DSC runs at the following temperatures:
- GE: 240, 260, 290 and 330°C;
- KE01 and KE02: 270 and 340°C;
- NO5: 250°C.
These temperatures are indicated by arrows in Fig. 2 for some samples. The DSC furnace was opened immediately after stopping the run and the pan was removed and allowed to cool down outside the furnace.
The second losses of masses can be used to estimate the amounts of goethite in the three iron ores samples (Table 1). Assuming 10.13 mass% as the theoretical value for the decomposition of goethite, it is easily calculated that samples KE01, KE02 and NO5 contain 11%, 17% and 70% of goethite, respectively.
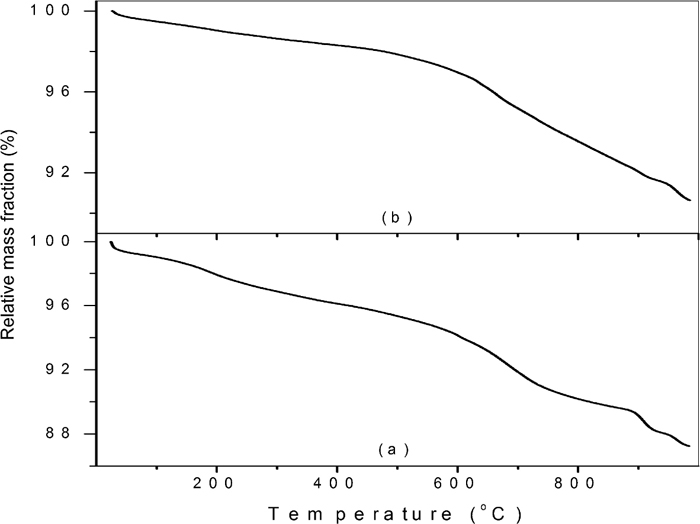
The TGA curves for the manganese ores were much more complicated than those for the iron ores. Sample Brilho do Aço contain about 45 mass% Mn (cryptomelane: K(Mn4+, Mn2+)8O16 and todorokite (Na,Ca,K)2(Mn4+,Mn3+)6O12.3H2O), and 11 mass% of Fe (hematite and goethite). Sample BBURU13 contains 43 mass% Mn (cryptomelane) and 12 mass% Fe (hematite and goethite). The existence of other manganese-bearing phases cannot be ruled out because the identification of manganese phases by X-ray diffraction might not be trivial.25) The TGA curves (Fig. 3) of both samples show an almost continuous loss of mass from room temperature up to 600°C, making it impossible to discern any individual loss, including that originated from adsorbed water. Using 100°C as the limit for the release of moisture, we find a moisture content of 0.94 mass% for sample Brilho do Aço, and 0.53 mass% for BBURU13.
As stated above, all TGA and DSC experiments were performed with a heating rate of 20°C/min. Decreasing this rate normally increases the loss of mass at a certain temperature. The overall result is a shift of the TGA/DSC curves towards lower temperatures, but the shape of these curves is preserved. Also, the total loss of mass is constant, regardless the heating rate, as long as a temperature high enough to complete the reaction is achieved. In the present study we chose the heating rate of 20°C/min because we could obtain all necessary information in a short period of time without losing any relevant data. Decreasing this rate would essentially give the same results and conclusions.
4.2. Mössbauer Experiments
Room-temperature Mössbauer experiments were performed with the powders heated at the above specified temperatures, and the spectra are shown in Figs. 4 (GE samples), 5 (KE01 and KE02 samples) and 6 (NO5 samples). The derived hyperfine parameters are listed in Table 2.
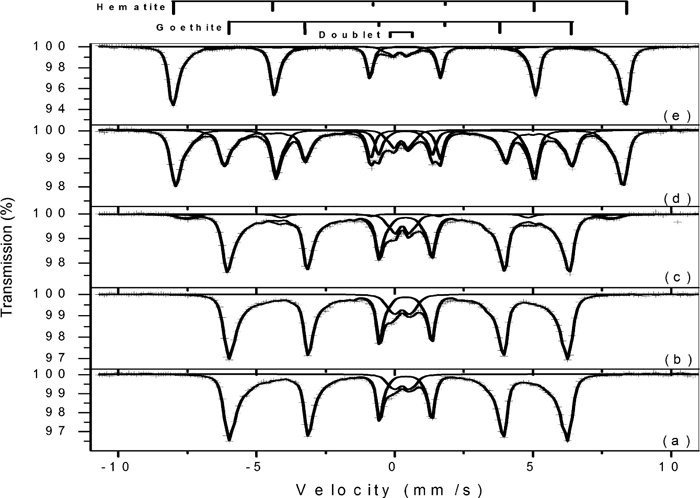
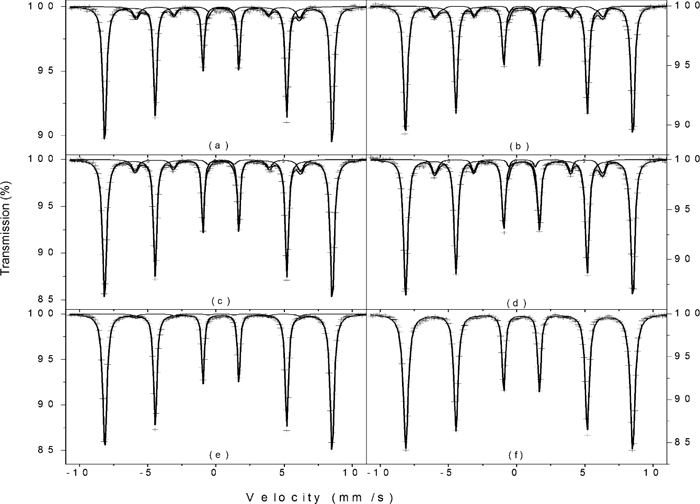
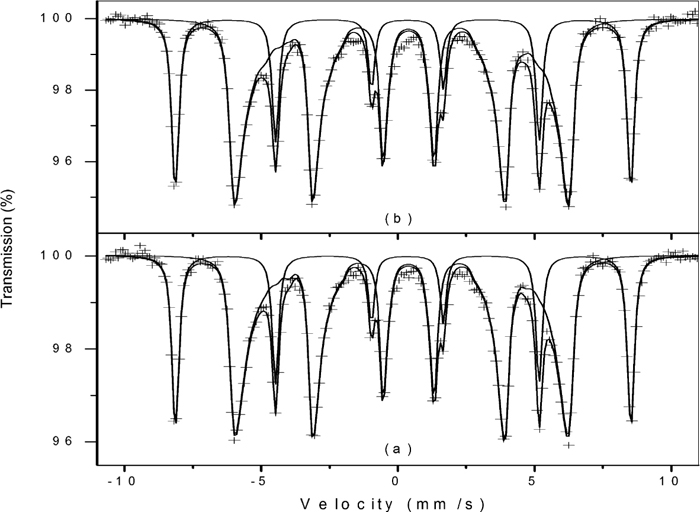
Table 2. Hyperfine parameters derived from fitting the room-temperature Mössbauer spectra with a model-independent hyperfine field distributions. H
hf is the maximum-probability hyperfine field (kOe), 2
εQ is the quadrupole shift (mm/s),
δ is the isomer shift relative to
α-Fe (mm/s), ΔE
Q is the quadrupole splitting (mm/s), and S is the relative area (%).
| Hematite | Goethite | Doublet |
|---|
| Sample | Hhf | δ | 2εQ | S | Hhf | δ | 2εQ | S | ΔEQ | δ | S |
|---|
| GE | – | – | – | – | 381 | 0.37 | –0.27 | 92 | 0.30 | 0.37 | 8 |
| GE-240 | – | – | – | – | 381 | 0.37 | –0.27 | 90 | 0.30 | 0.37 | 10 |
| GE-260 | 476 | 0.36 | –0.22 | 5 | 385 | 0.37 | –0.27 | 86 | 0.40 | 0.37 | 9 |
| GE-290 | 503 | 0.38 | –0.22 | 51 | 391 | 0.37 | –0.26 | 42 | 0.40 | 0.37 | 7 |
| GE-330 | 509 | 0.38 | –0.21 | 87 | 418 | 0.36 | –0.26 | 6 | 0.40 | 0.36 | 7 |
| KE01 | 517 | 0.37 | –0.19 | 88 | 371 | 0.36 | –0.26 | 12 | – | – | – |
| KE01-270 | 517 | 0.37 | –0.19 | 89 | 376 | 0.36 | –0.26 | 11 | – | – | – |
| KE01-340 | 516 | 0.38 | –0.19 | 98 | 372 | 0.36 | –0.26 | 2 | – | – | – |
| KE02 | 517 | 0.37 | –0.18 | 89 | 383 | 0.39 | –0.26 | 11 | – | – | – |
| KE02-270 | 516 | 0.38 | –0.17 | 90 | 382 | 0.38 | –0.26 | 10 | – | – | – |
| KE02-340 | 515 | 0.37 | –0.18 | 100 | – | – | – | – | – | – | |
| NO5 | 517 | 0.38 | –0.17 | 29 | 379 | 0.37 | –0.26 | 71 | – | – | – |
| NO5-250 | 517 | 0.37 | –0.17 | 29 | 380 | 0.37 | –0.26 | 71 | – | – | – |
The broad and asymmetric sextet in sample GE is typical of goethite, and the derived hyperfine parameters are in line with the reported literature values.26,27) The central doublet is due to superparamagnetic goethite, and it is caused by particles smaller than 15 nm.27) The spectrum after heating GE at 240°C is identical to the original sample, and no traces of hematite can be found in this sample. The appearance of a sextet with relative area of about 5% and with hyperfine parameters typical of hematite can be clearly seen after heating at 260°C, and at 290°C half of the goethite has been transformed into hematite. Further heating at 330°C caused the total transformation and no goethite can be found at this temperature.
The TGA losses of masses between 100°C and 240 and 260°C are 1.55 and 2.56%, respectively. If we assume that these losses are due to the conversion of goethite into hematite, and using again the theoretical value of 10.13 mass% for the conversion, we can calculated that about 14 mass% and 23 mass% of hematite would have been formed at 240°C and 260°C, respectively. The Mössbauer results (Fig. 4 and Table 2) proved that these amounts of hematite were not formed, and hence the conclusion is that most part of the loss of mass, if not all, occurring before the main dehydroxylation peak is due to the dehydration, i.e., release of adsorbed water.
According to the data in Table 2, the amount of goethite for sample KE02 is 11%, but 17% was found by the calculation with the TGA results. Samples KE01 and NO5 presented about the same contents by Mössbauer and TGA, but this is generally not the rule, but rather an exception. The main reason for this type of discrepancy is the difficult in determining the amount of water that is released by the transformation of goethite into hematite.
It is interesting to note that the magnetic hyperfine fields of the hematites formed upon heating are lower than the value of 517 kOe observed for bulk hematite.26) The data in Table 2 shows that the value of this field increases as the heating temperature increases. This increase cannot be attributed to the growth of the particles, because the transformation of goethite to hematite at such a low temperatures does not result in any changes both in the morphology and particle sizes.28,29) We interpret these results as follows: at 260°C, a thin layer of hematite is formed at the surface of the goethite particles, as a result of surface dehydroxylation. The magnetic interactions are therefore the result of interfacial interactions only, and a lower value for the magnetic field is observed. As the temperature of the transformation is increased, the reaction proceeds towards the inner part of the particles, and hence the magnetic interactions increases. The resulting hematite after total transformation still presents a lower value for the magnetic field due to the small particle sizes.26) The magnetic fields of the unreacted goethites also increase with the decomposition temperatures, and the explanation is that surface interactions decrease the average hyperfine fields. After heating at 330°C, only the inner part of the particle remains unreacted, and thus there is no contribution from surface interactions.
The formation of such a hematite layer has been suggested as the reason for the appearance of multiple dehydroxylation peak in the thermal experiments of goethite.7,29,30) However, Schwertmann20) did not agree with this interpretation and proposed the existence of two different types of goethite to explain the double peak. We believe that the formation of a hematite coating indeed requires a higher temperature to complete the reaction. However, we do not agree that a doublet dehydroxylation peak is formed due to this coating because the DSC curve of sample GE shows the existence of multiple peaks. Hence, the decomposition of goethite into hematite seems to be a two-step process:
- Adsorbed water is released from room temperature up to the onset of the main dehydroxylation peak;
- The dehydroxylation occurs in a broad range of temperatures due to the existence of a particle-size distribution, surface hydroxyls and formation of a hematite coating.
4.3. Karl Fischer Titration
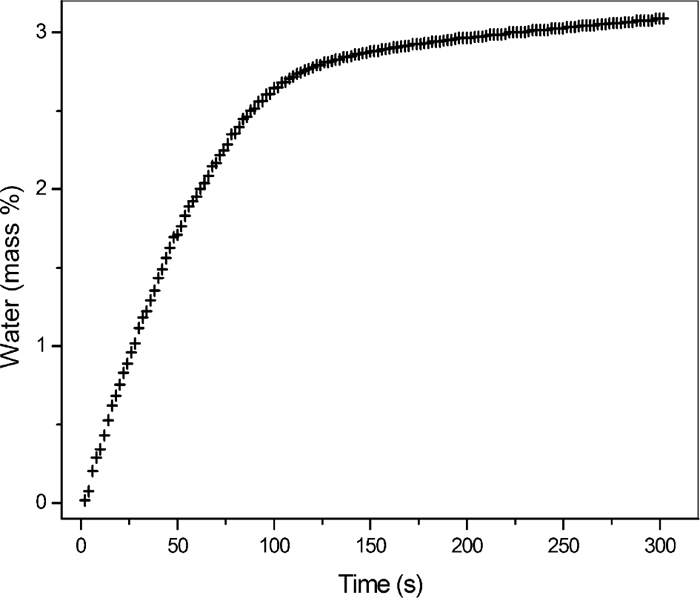
A typical titration curve is shown in Fig. 7 for sample GE. At the end of the titration, the volumes were converted to percentage using the titer of the solution and the mass of the sample. About 90% of the water is titrated within 100 seconds, and the total amount of hygroscopic water (3.09 mass%) was consumed after 300 seconds. According to the TGA data in Table 1 and Fig. 2, the loss of mass up to 100°C is only 2.35 mass%. Thus, to achieve the loss of 3.09 mass% observed by the Karl Fischer method a temperature of about 205°C would be required in the TGA experiment using the heating rate of 20°C/min.
The titration of nine synthetic goethites and Al-goethites, ten iron ores and two manganese ores have showed that the water contents determined by the Karl Fischer method were systematically higher than those obtained by the loss of masses up to 100°C observed in the TGA experiments (Fig. 8). A linear fit to the data resulted in the equation:
TGA (%) = –0.327 + 0.847KF ( n = 22, r = 0.995), which clearly shows that the TGA losses of mass up to 100°C underestimate the water contents. For the ten iron ores samples, the average moisture determined by the TGA method was 0.18 ± 0.05%, whereas by the Karl Fischer method was 0.50 ± 0.14%. This large discrepancy in the contents determined by these two methods is believed to be real, and its origin is simply the fact that drying at temperatures close to 100°C does not eliminate all the adsorbed water in these samples.
The Hydra-Point titrant solution is a mixture of iodine, sulfur dioxide, imidazole, ethanolamine and diethylene glycol monoethyl ether. The KF reaction in methanolic medium can be written as:31)
H2O + I2 + [RNH]+SO3CH3– + 2 RN → [RNH]+ SO4CH3– + 2 [RNH]+ I–
The reaction vessel contains, in our procedure, about 25 mL of methanol and the powdered sample. We propose that all adsorbed water in the solid is rapidly transferred to the methanol, and afterwards it is consumed by the Karl Fischer titrant. The formation of hydrogen bonds in the methanol-water system is certainly much more favorable than in the goethite-water system. According to Fileti et al.32) the O-H hydrogen-bond distance in the methanol-water system is 1.942 Å whereas in goethite the distance is 2.76 Å.5) Furthermore, the addition of the Karl Fischer solution adds three other substances capable of forming hydrogen bonds with water. Steric effects certainly also play an important role in the formation of hydrogen bonds between the liquid phases. As a result, all adsorbed water existing in the solid is easily determined by the Karl Fischer titration.
5. Practical Implications
Iron ores can contain small amounts of other hydroxyl-bearing minerals, mainly gibbsite and kaolinite. The dehydroxylation temperature for gibbsite is in the range 200–330°C, which means that the transformation to alumina occurs simultaneously to the dehydroxylation of goethite.33,34) The decomposition of kaolinite occurs between 450°C and 700°C. Manganese ores can contain a variety of hydrated minerals, such as manganite, nsutite, todorokite, lithiophorite, among others.35) The vast majority of these minerals do not contain water in their chemical formulae, but rather, they produce water upon heating due to the dehydroxylation.
As mentioned above, the ISO standards 2596 and 3087 regulates the moisture determination in iron ores, which is made upon heating at 105°C. The results of the present work have proved that this temperature is not high enough to completely remove the adsorbed water from the studied samples. On the other hand, it is not possible to establish a general temperature that is capable of drying the samples, because this temperature varies from sample to sample. Hence, the procedure used in this work, i.e. adding the powder into the Karl Fischer reaction vessel, is believed to be the most appropriate method to determine the moisture content in iron and manganese ores.
The ISO standard 7335 defined “combined water” as the part of water that is liberated by heating between 105 ± 2°C and 950 ± 20°C. As mentioned above, most minerals present in the ores do not contain water, but hydroxyls groups that are converted in water upon heating. A better approach might be the determination of the total content of adsorbed water, crystallization water and hydroxyls units that are converted into water by heating the sample from room-temperature to 950°C and using the KF method as stated in the above mentioned ISO standard. The difference between the latter value and that of moisture determined as suggested in this work, will give the true amount of crystallization water and structural hydroxyls groups. A more coherent name for this determination might be “non-moisture water”.
6. Conclusion
The moisture contents of several synthetic and natural goethite-bearing samples were determined by the loss-of-mass method and by the Karl-Fischer titration. It was found that drying at 105°C did not remove all the water from these samples, and that temperatures above 200°C would be required to completely remove the adsorbed water. The multiple peaks observed in the TGA and DSC measurements are not due to the dehydroxylation of goethite, but are due to the release of adsorbed water. The decomposition of goethite into hematite occurs with the release of adsorbed water from room temperature up to the onset of the main dehydroxylation peak. The dehydroxylation occurs in a broad range of temperatures due to the existence of a particle-size distribution, surface hydroxyls and formation of a hematite coating. The determination of all adsorbed water is best performed by adding the powdered sample into the Karl-Fischer reaction vessel. However, the effects of mineralogy, particle sizes, surface area, porosity, etc. were not investigated in this work and hence the general application of this method must be further evaluated.
Acknowledgments
This work was partially funded by Conselho Nacional de Desenvolvimento Científico e Tecnológico (CNPq), Fundação de Amparo à Pesquisa do Estado de Minas Gerais (Fapemig) and Vale.
References
- 1) J. D. Jorgenson: U. S. Geological Survey Minerals Yearbook, ed. by USGS National Center, Reston (VA), USA, (2010).
- 2) V. Strezov, A. Ziolkowski, T. J. Evans and P. F. Nelson: J. Therm. Anal. Calorim., 100 (2010), 901.
- 3) A. P. Wolff, G. M. da Costa and F. de Castro Dutra: Miner. Process. Extr. M. Rev., 32 (2011), 47.
- 4) J. Okazaki and K. Higuchi: ISIJ Int., 45 (2005), 427.
- 5) R. M. Cornell and U. Schwertmann: The Iron Oxides, VCH, Weinheim, (1996).
- 6) R. G. Ford and P. M. Bertsch: Clays Clay Miner., 47 (1999), 329.
- 7) D. Walter, G. Buxbaum and W. Laqua: J. Therm. Anal. Calorim., 63 (2001), 733.
- 8) R. L. Frost, Z. Ding and H. D. Ruan: J. Therm. Anal. Calorim., 71 (2003), 783.
- 9) J. D. Betancur, C. A. Barrero, J. M. Greneche and G. F. Goya: J. Alloy. Compd., 369 (2004), 247.
- 10) U. Schwertmann, P. Cambier and E. Murad: Clays Clay Miner., 33 (1985), 369.
- 11) H. D. Ruan, R. L. Frost and J. T. Kloprogge: Spectrochim. Acta, Part A, 57 (2001), 2575.
- 12) C. A. Barrero, J. D. Betancur, J. M. Greneche, G. F. Goya and T. S. Berquó: Geophys. J. Int., 164 (2006), 331.
- 13) T. Matsumura, T. Maki, S. Amano, M. Sakamoto and N. Iwasaki: ISIJ Int., 49 (2009), 618.
- 14) J.-F. Boily and A. R. Felmy: Geochim. Cosmochim. Acta, 72 (2008), 3338.
- 15) H. D. Ruan, R. L. Frost, J. T. Kloprogge and L. Duong: Spectrochim. Acta, Part A, 58 (2002), 967.
- 16) J.-F. Boily, J. Szanyi and A. R. Felmy: Geochim. Cosmochim. Acta, 70 (2006), 3613.
- 17) H. D. Ruan, R. L. Frost, J. T. Kloprogge and L. Duong: Spectrochim. Acta, Part A, 58 (2002), 479.
- 18) A. J. A. Aquino, D. Tunega, G. Haberhauer, M. H. Gerzabek and H. Lischka: Geochim. Cosmochim. Acta, 72 (2008), 3587.
- 19) S. K. Ghose, G. A. Waychumas, T. P. Trainor and P. J. Eng: Geochim. Cosmochim. Acta, 74 (2010), 1953.
- 20) U. Schwertmann: Thermochim. Acta, 78 (1984), 39.
- 21) R. E. Vandenberghe, E. De Grave and P. M. A. de Bakker: Hyperfine Interact., 83 (1994), 29.
- 22) G. M. da Costa, V. Barron, C. M. Ferreira and J. Torrent: Miner. Eng., 22 (2009), 1245.
- 23) G. M. da Costa and M. F. de Jesus Filho: J. Mater. Sci., 27 (1992), 6116.
- 24) K. G. de Sá, G. M. da Costa and C. B. Vieira: Technol. Metal. Mater., 1 (2004), 18.
- 25) G. M. da Costa and L. R. Herzog: Am. Miner., 96 (2011), 68.
- 26) E. Murad: Iron in Soils and Clay Minerals, ed. by J. W. Stucki, B. A. Goodman and U. Schwertmann, D. Reidel Publishing Co, Dordrecht, (1988), 309.
- 27) C. A. Barrero, R. E. Vandenbergue and E. De Grave: Hyperfine Interact., 122 (1999), 39.
- 28) M. H. Francombe and H. P. Rooksby: Clays Miner. Bull., 4 (1959), 1,
- 29) C. J. Goss: Miner. Mag., 51 (1987), 437.
- 30) R. Derie, M. Ghodsi and C. Calvo-Roche: J. Therm. Anal., 9 (1976), 435.
- 31) P. Bruttel and R. Schlink: Water Determination, Metrohm Monograph, 8.026.5003, Metrohm Ltd., Switzerland, (2003).
- 32) E. E. Fileti, P. Chaudhuriand and S. Canuto: Chem. Phys. Lett., 400 (2004), 494.
- 33) J. T. Kloprogge, H. D. Ruan and R. L. Frost: J. Mater. Sci., 37 (2002), 1121.
- 34) K. Heide and M. Földvari: Thermochim. Acta, 446 (2006), 106.
- 35) B. Sorensen, S. Gaal, E. Ringdalen, M. Tangstad, R. Kononov and O. Ostrovski: Int. J. Miner. Process., 94 (2010), 101.