Abstract
Laboratory experiments were carried out with the aim of adapting a (FetO) dynamic control technique, in which (FetO) is estimated by calculating the oxygen balance during blowing, to the hot metal decarburization process. The rephosphorization condition in the higher decarburization rate period was then clarified based on those experiments. Next, (FetO) control experiments were carried out in a commercial-scale plant converter. (FetO) generation was promoted by increasing the oxygen flow rate and raising the lance height in the early stage of blowing, and the amount of dephosphorization during blowing was increased. Finally, a dephosphorization model was constructed by combining the coupled reaction model and the (FetO) estimation model. This model suggested an increase of the amount of dephosphorization during blowing, and the effect was confirmed by an experiment with a commercial 240 ton converter.
1. Introduction
Higher efficiency dephosphorization has been required in the hot metal pretreatment and decarburization processes in order to reduce refining costs and minimize slag generation. The hot metal pretreatment process has been developed since the 1980s, and several types have been adopted in Japan, including processes using the ladle, torpedo car, and converter. In recent years, demand for ultra-low phosphorus steel grades has increased, and CaF2-free flux has been required to enable reuse of slag. To meet these new requirements, a high efficiency dephosphorization technique in the decarburization process in the converter without use of CaF2 has been required.
JFE Steel Corporation developed a high efficiency dephosphorization technique for the top and bottom blowing converter by adopting a mathematical model of dephosphorization combined with a FeO generation model.1) In this technique, (FetO) generation is the most important control item for enhancing dephosphorization by generating a higher dephosphorization capacity slag. The main objective of the present work is to adapt the (FetO) dynamic control technique to the hot metal dephosphorization converter for producing the ultra-low phosphorus steel grade. Application of the technique to the decarburization converter to enhance dephosphorization is also attempted.
In the past, various dynamic control techniques for the converter had been reported, and many studies2,3,4,5,6,7,8,9,10,11,12,13) were carried out on prediction of the carbon content in molten metal and the molten steel temperature at blow end. Several techniques for dephosphorization control in the BOF have been reported. In the paper reported by Vortrefflich et al.,13) the (FetO) content at blow-end was estimated by measuring oxygen activity with a special sub-lance probe. The accuracy of (FetO) with that technique was within ±2%, and [P] at blow-end could be estimated from the obtained (FetO) contents. In other techniques, the slag foaming height14,15) and decarburization rate15) during blowing were measured and controlled in order to enhance dephosphorization. The slag foaming height was detected by a sonic meter, and the decarburization rate was calculated from the flow rate and composition of the exhaust gas.
However, no (FetO) dynamic control technique had been applied to enhancement of dephosphorization in the decarburization process. Therefore, in the present work, a (FetO) dynamic control technique16) was utilized to promote CaO dissolution and dephosphorization in the hot metal decarburization process in the top and bottom blowing converter. (FetO) in slag is one of the key parameter for dephosphoriazation and also rephosphorization. In dephophorization converter, influence of (FetO) to rephosphorization was investigated,17) but in decarburiation converter, the influence has not been investigated. Then, to adapt the (FetO) dynamic control technique to the hot metal decarburization process, first, the rephosphorization condition in the higher decarburization rate period was investigated in small-scale laboratory experiments, and (FetO) control experiments were performed with a commercial-scale plant converter. A comparison between this study and past studies is summarized in Table 1.
Table 1. Comparison with conventional studies.
| Ref-No. | Target Process | Method | Difference from this study |
|---|
| 1, 16 | Dephosphorization Converter | Control of (FeO) by utilizing exhaust gas analysis | Not applied to decarburization converter. |
| 2–12 | Decarburization Converter | Control of end point such as [C], [O] and temperature by utilizing exhaust gas analysis | (FetO) was not controlled by these methods. |
| 13 | Decarburization Converter | Estimation of [P] at end point by measuring oxygen activity in slag |
| 14 | Decarburization Converter | Control of slag height by sonic meter |
| 15 | Decarburization Converter | Control of decarburization rate by exhaust gas analysis |
| This study | Decarburization Converter | Control of (FetO) by utilizing exhaust gas analysis | Rephosphorization condition is not clarified quantitatively. |
2. Experimental Method
2.1. Investigation of Rephosphorization in Laboratory Experiments
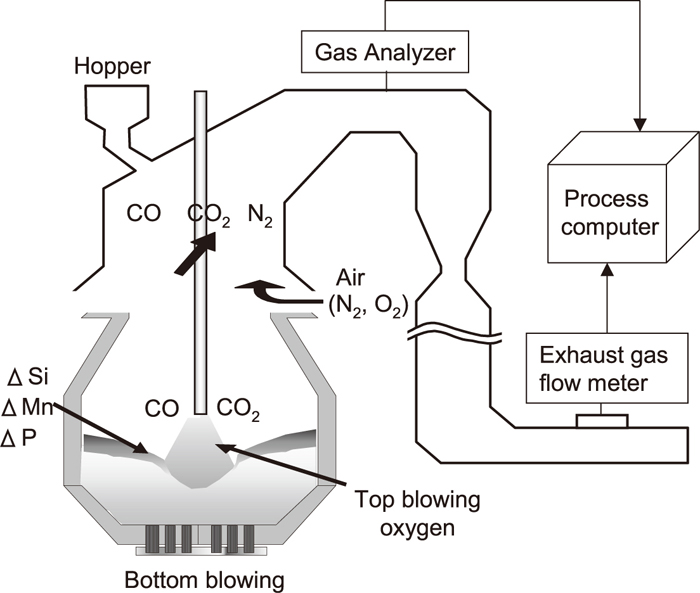
Experiments were carried out to evaluate the influence of the FetO content on rephosphorization using a high frequency induction furnace. The experimental conditions are summarized in Table 2. The schematic illustration and diagram of the experimental apparatus and experimental flow are shown in Figs. 1 and 2, respectively.
Table 2. Experimental conditions of laboratory experiments.
| Condition | Heat size, kg | [%C]initial | [%Si]initial | Oxygen flow rate
Nm3/min/t | Lance height
m |
|---|
| 1 | 200 | 3.30 | 0.30 | 2.25 | 0.15 |
| 2 | 3.05 | 0.26 | 0.20 |
| 3 | 3.00 | 0.31 | 0.25 |
| 4 | 10 | 2.96 | 0.47 | 2.00 | 0.04 |
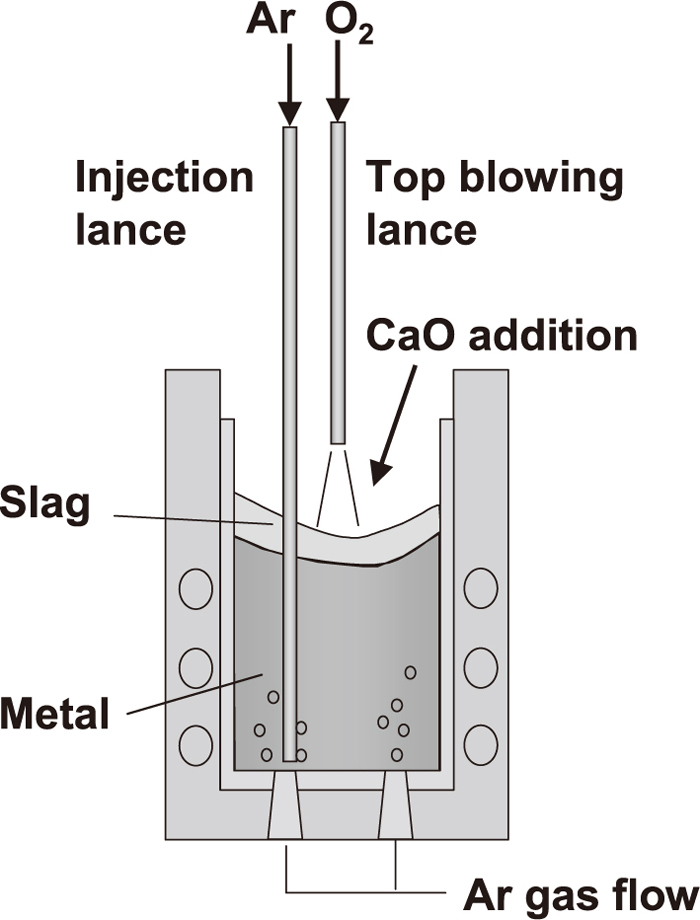
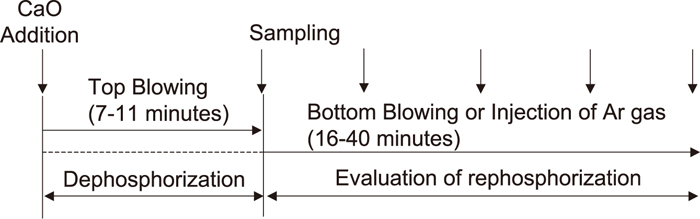
First, 10 kg or 200 kg of hot metal was melted in a magnesia crucible. After the hot metal composition was adjusted to the values shown in Table 2, CaO powder (0.25 to 1.0 mm) was added to the hot metal surface, and oxygen gas was then blown onto the hot metal surface from the top-blowing lance. After dephosphorization by the top-blowing oxygen, oxygen blowing was stopped and the dephosphorization slag was stirred by bottom-blowing argon gas for 16–40 minutes. The hot metal temperature was measured continuously using a thermocouple, and was kept approximately constant at 1770 K to 1820 K by controlling the induction heating power during the period. In order to evaluate the behavior of (FetO) reduction and the conditions of dephosphorization and rephosphorization, hot metal samples and slag samples were taken at appropriate time intervals. The lance height during the dephosphorization period was increased as shown by conditions 1, 2, and 3 in that order in order to promote (FetO) generation during that period. Under condition 4, the initial [Si] content is increased in order to decrease the slag basicity.
2.2. Calculation for Estimation of (FetO) Content in 240-ton Scale Converter
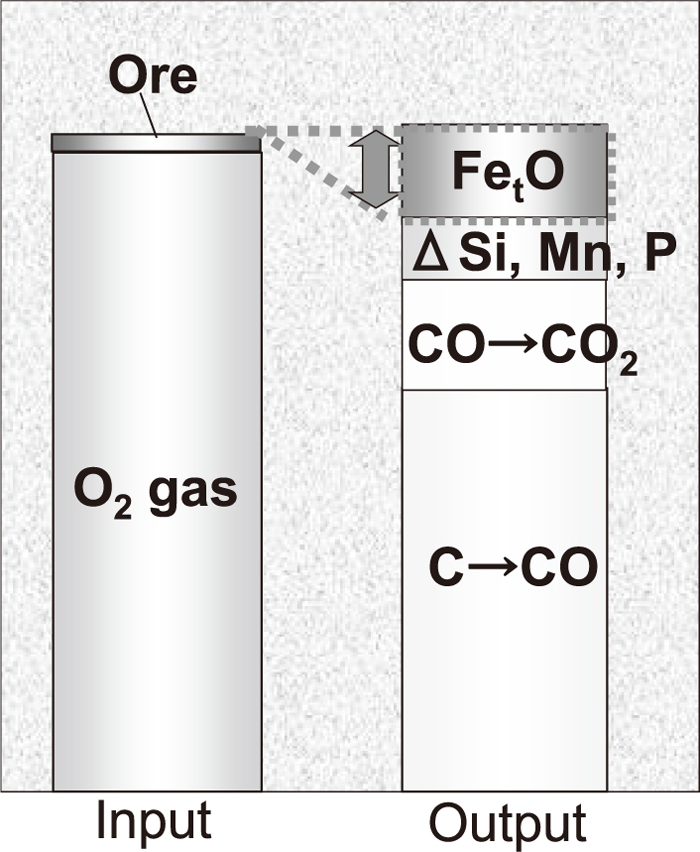
The (FetO) content was estimated by calculating the oxygen balance in the decarburization process. A schematic drawing of a top and bottom blowing converter at JFE Steel’s West Japan Works (Fukuyama District) and an exhaust gas analysis system are shown in Fig. 3. The amount of oxygen supplied from the top lance and the oxygen contained in the iron oxide were calculated as inputs. The amount of oxygen consumed by the oxidation reaction of hot metal components such as [Si], [Mn], [P], and [C] were calculated as outputs. Here, oxygen consumption through oxidation of [Si], [Mn], and [P] was calculated based on Eq. (1);
|
[ M ]=
[ M ]
i
×exp(-
R
M
×
[
O
2
]
input
)
| (1) |
where, [M] is the concentrations of [Si], [Mn], and [P] in hot metal, [O
2]
input is the amount of oxygen (Nm
3/t), and
RM is the rate constant of reaction of first order. Oxygen consumption by the decarburization reaction was calculated from the exhaust gas flow rate and the gas compositions (CO, CO
2) of the exhaust gas, which is the sum of the primary combustion of oxygen and secondary combustion of oxygen. In order to estimate the precise amount of oxygen for primary and secondary combustion in the furnace, the amount of air inhaled from the gap between the furnace and the exhaust gas hood, which oxidizes CO gas from inside the converter, should be estimated. The amount of air can be calculated from the nitrogen content in the exhaust gas, assuming that the ratio of nitrogen and oxygen in the air is 4:1. The nitrogen content is estimated from the CO and CO
2 contents in the exhaust gas, based on the equation N
2 (%)=100–CO (%)–CO
2 (%). The time lag of exhaust gas analysis was determined to be 16 seconds by calculation from the flow velocity of the exhaust gas and the length of the exhaust gas pipe. Based on the aforementioned procedure, the amount of oxygen for Fe
tO generation was calculated by
Eq. (2) at 2 seconds intervals.
|
Δ
W
O
2
=
∫
0
t
i
(A+B+C-1/2D-E-F)dt
| (2) |
Where,
Δ
W
O
2
: oxygen for Fe
tO generation at time
ti(s) [Nm
3/t],
A: amount of oxygen blowing [Nm
3/t],
B: amount of oxygen contained in iron oxide [Nm
3/t],
C: amount of oxygen in air consumed by combustion of CO at the mouth of the converter [Nm
3/t],
D: amount of CO gas at the gas analyzer [Nm
3/t],
E: amount of CO
2 gas at the gas analyzer [Nm
3/t],
F: amount of oxygen consumed by oxidation of [Si], [Mn], and [P] [Nm
3/t],
t: time (s), index
i: i-th calculation interval. (%Fe
tO) was then calculated from the oxygen balance and the slag volume, where the slag volume is the sum of the amount of Fe
tO, flux consumption, and oxidation of [Si], [Mn] and [P]. Here, the ratio of FeO and Fe
2O
3 was fixed as FeO: Fe
2O
3=33.2: 66.8, which was the average of the FeO/Fe
2O
3 ratio measured in slag samples.
Figure 4 shows the oxygen balance during decarburization converter in a top and bottom blowing converter. To examine the calculation accuracy, slag sampling was carried out after blowing, and the observed compositions of the samples were compared with the calculated ones.
3. Results and Discussion
3.1. Results of Laboratory Experiments
As an example of the results under higher basicity conditions (conditions 1–3), the changes of [P] in the hot metal and (FetO) in the slag are shown in Fig. 5. The (FetO) in slag was obtained by adding (FeO) and (Fe2O3) in the slag. As shown in Fig. 5, (FetO) after dephosphorization with top-blowing oxygen is increased in the order of condition 1, 2, and 3, which is the same as the order of the lance height for top-blowing oxygen. Therefore, it is considered that soft-blowing oxygen promoted (FetO) generation. With regard to [P] in the hot metal, a slight amount of rephosphorization was observed shortly after dephosphorization with top-blowing oxygen under conditions 1 and 2, but rephosphorization was not observed under condition 3.
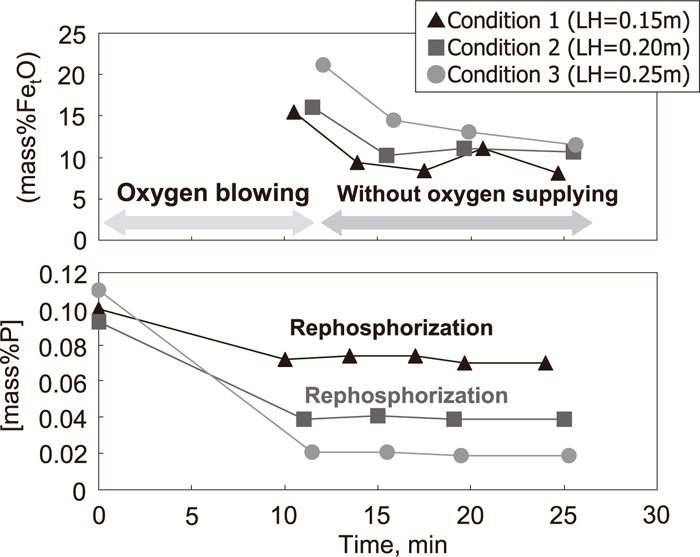
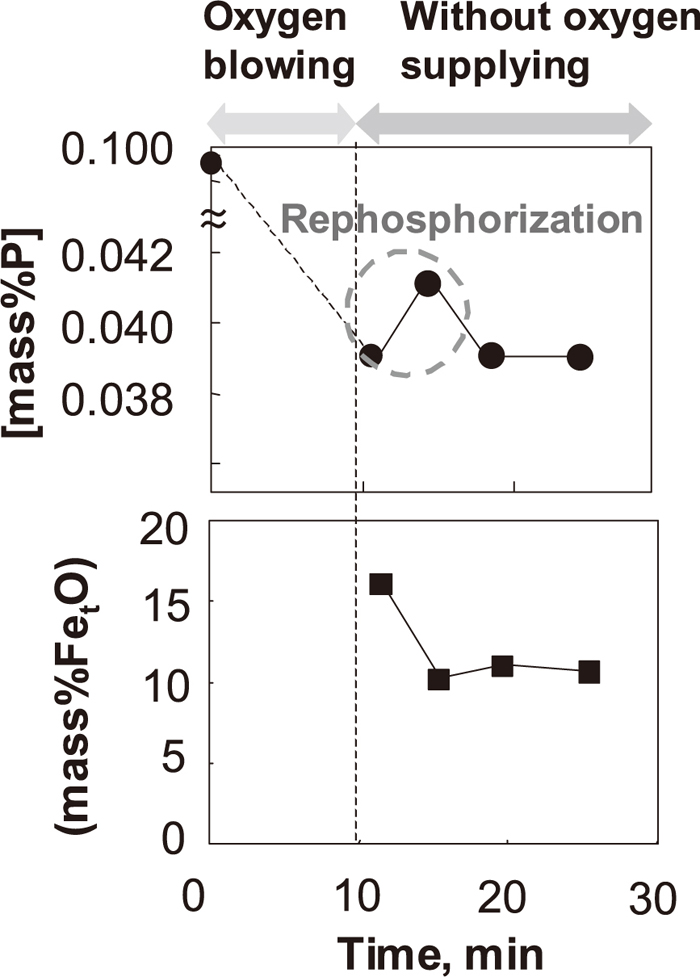
To show the rephosphorization behavior under higher basicity conditions clearly, the changes of [P] in the hot metal and (FetO) in the slag under condition 2 are shown in Fig. 6, where a slight amount of rephosphorization was observed shortly after dephosphorization with top-blowing oxygen. After dephosphorization with top-blowing oxygen, [C] in the hot metal was 1.9–2.1 mass%, the temperature of the hot metal was 1760–1820 K, and the slag basicity was 2.4–2.7.
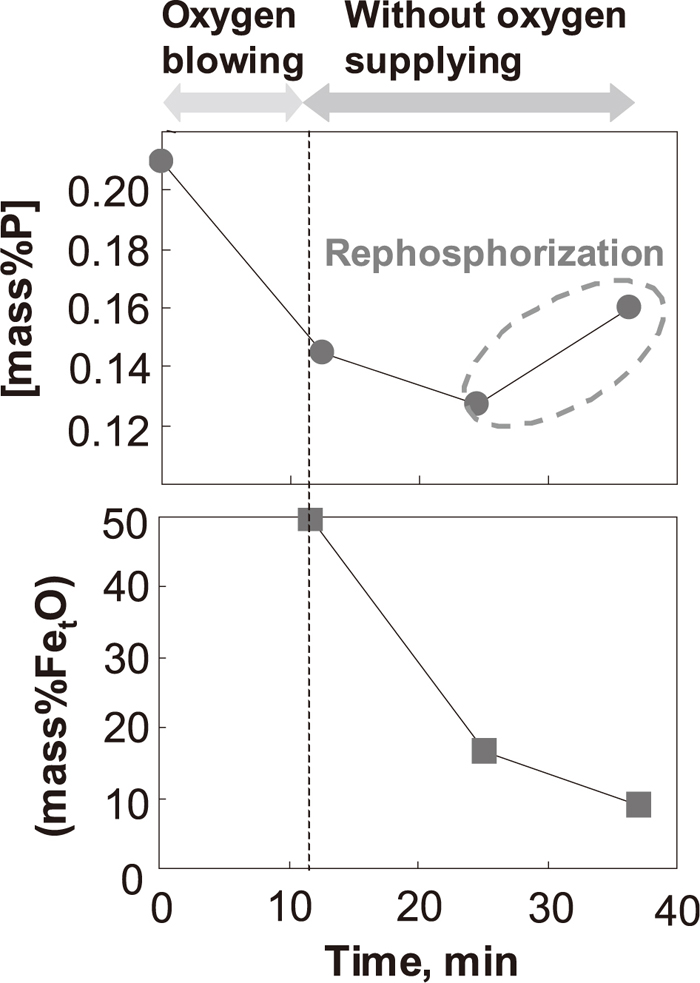
The changes of [P] in the hot metal and (T. Fe) in the slag under condition 4, where the slag basicity is lower than under conditions 1–3, are shown in Fig. 7. As shown in Fig. 7, [P] in the hot metal decreased shortly after dephosphorization with top-blowing oxygen, and increased at about 10 minutes after dephosphorization with top-blowing oxygen. After dephosphorization with top-blowing oxygen, [C] in the hot metal was 1.8–2.1 mass%, the temperature of the hot metal was 1760–1820 K, and the slag basicity was 1.0–1.2.
The condition of rephosphorization was considered from a thermodynamic point of view based on a previous report18) in order to understand the rephosphorization behavior in the laboratory experiments. According to Ohguchi et al.,19) because the reaction temperature is sufficiently high, the mass-transfer kinetics in the metal and slag phases, rather than interfacial chemical reactions, are likely to determine the dephosphorization rate. Therefore, the dephosphorization rate between the slag-contained iron oxide and hot metal is described as Eq. (3)
|
-
d[
% P
]
dt
=
S
k
m
ρ
m
W
m
(
[
% P
]-
[
% P
]
i
)
=
S
k
s
ρ
s
W
m
(
(
% P
)
i
-(
% P
)
)
| (3) |
Where, t: time [s], k: mass transfer coefficient [m/s], S: geometrical area of slag/metal interface [m2], W: hot metal weight [kg], ρm and ρs: densities of hot metal and slag [kg/m3], index i: slag/metal interface.
In the case without oxygen blowing during hot metal dephosphorization, it is assumed that (FetO) is reduced by carbon in the hot metal. d[%P]/dt=0 can be assumed at the point when dephosphorization turns into rephosphorization associated with (FetO) reduction.
Here, the phosphate capacity in a gas/slag system
C
P
O
4
3-
is introduced by Eq. (4)
|
C
P
O
4
3-
=(
%P
O
4
3-
)
P
O
2
-5/4
/
P
P
2
1/2
| (4) |
Additionally, the dissolution reaction of P
2 gas into molten iron is described as
Eq. (5),
20) and the oxygen potential at the slag/metal interface is calculated based on
Eq. (6).
21)
|
Δ
G
0
=-RTln
a
P
P
P
2
1/2
=-157 700+5.4T
| (5) |
|
log
P
O
2
=2log
a
Fe
t
O
-22 710/T+3.87
| (6) |
Based on Eqs. (4), (5), (6), the equilibrium phosphorus distribution ratio, Lp, at the slag/metal interface can be expressed as Eq. (7):
|
log
L
p
=log
C
P
O
4
3-
+5/2log
a
Fe
t
O
+log
f
P
-36 628/T+4.63
| (7) |
The phosphate capacity,
C
P
O
4
3-
, can be estimated from Eqs. (8)22) and (9) using the slag composition.
|
log
C
p
=0.0938{
(
%CaO
)
+0.50(
%MgO
)
+0.30(
%
Fe
t
O
)
+0.35(
%
P
2
O
5
)
+0.46(
%MnO
)
}+32 500/T-17.74
| (8) |
|
log
C
P
O
4
3-
=log
C
p
+21 680/T+1.87
| (9) |
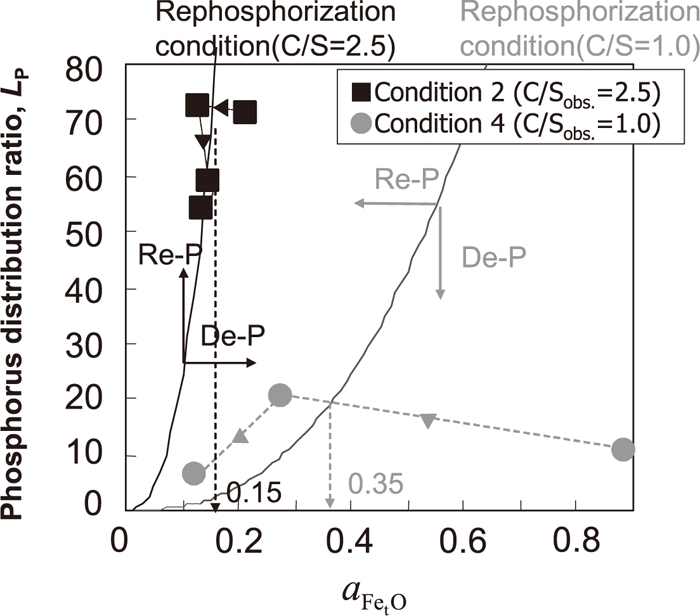
Based on Eqs. (7), (8), (9), the relationship between Lp and
a
Fe
t
O
can be obtained for conditions 2 and 4 in the laboratory experiments. The results are shown in Fig. 8. fP in Eq. (7) can be obtained by using the interaction parameters
e
P
C
and
e
P
P
, where
e
P
C
and
e
P
P
are given as 0.126 and 0.054.20) Fig. 8 also shows the actual changes of Lp and
a
Fe
t
O
under conditions 2 and 4. The actual
a
Fe
t
O
can be calculated by assuming
γ
Fe
t
O
as 2, which was obtained with plant slag by Iwase et al.22) From Fig. 8, it can be interpreted that rephosphorization occurred when the actual Lp was larger than the equilibrium Lp with the decrease of (FetO) content under both conditions 2 and 4. It can be interpreted that only a small amount of rephosphorization was confirmed under condition 2 because the relationships between the actual Lp and
a
Fe
t
O
under condition 2 are roughly the same as those between equilibrium Lp and
a
Fe
t
O
. On the other hand, it can be interpreted that rephosphorization was clearly confirmed under condition 4 because the gap between change of the actual Lp with
a
Fe
t
O
and change of the equilibrium Lp with
a
Fe
t
O
is wide. Critical point between dephosphorization and rephosphorization is obtained from cross point of change of the actual Lp with
a
Fe
t
O
and change of the equilibrium Lp with
a
Fe
t
O
. From Fig. 8,
a
Fe
t
O
at the critical point between dephosphorization and rephosphorization under condition 2 was estimated as 0.15, and that under condition 4 as 0.35. The oxygen potential in the slag phase at the critical point can be calculated from the above obtained
a
Fe
t
O
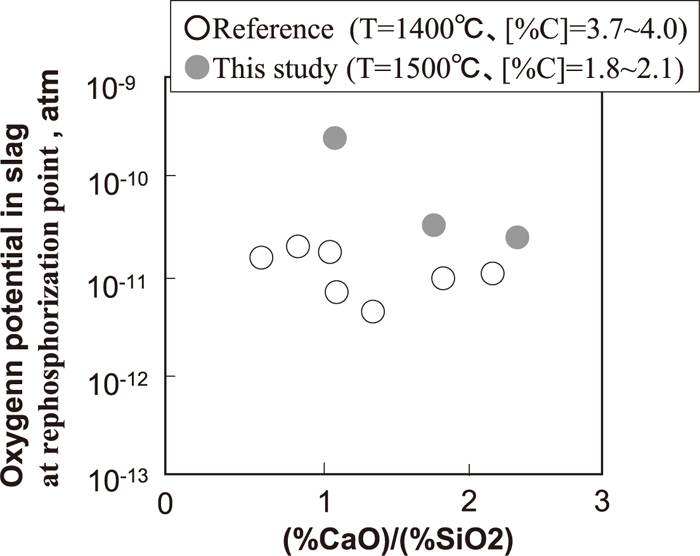
based on Eq. (6). The results are shown in Fig. 9, and are compared with the literature data after Miyamoto et al.,23) which were obtained under hot metal pretreatment conditions ([C]=3.7–4.0 mass%, T =1623±10 K). Miyamoto et al.23) reported that under the conditions of hot metal treatment, the oxygen potential in the slag phase at the critical point of rephosphorization increased slightly as a result of decreasing basicity. As shown in Fig. 9, the same tendency was observed with respect to the present data obtained in the higher decarburization rate period. It should be noted that the oxygen potential in the present work is higher than that in hot metal pretreatment because the temperature and [C] in the higher decarburization rate period are higher than those in hot metal pretreatment.
From these perspectives of hindering rephosphorization, it is indicated that (FetO) should be increased to the critical value in the higher decarburization rate period depending on such as temperature, [C] and basicity.
3.2. Results of FetO Control Experiments in 240 ton Scale Converter
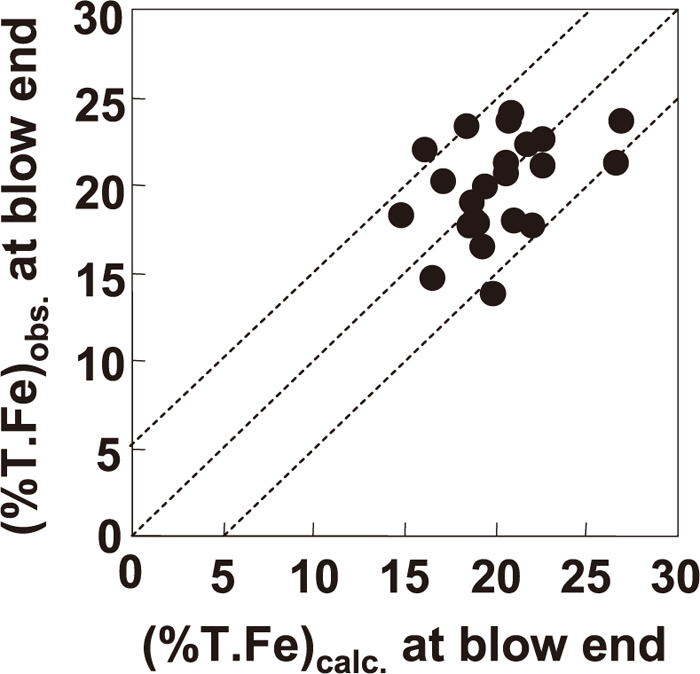
3.2.1. Accuracy of (FetO) Estimation in Decarburization Process
Figure 10 shows a comparison of the calculated and observed (FetO) contents at blow end. The observed (FetO) content showed good agreement with the calculated result. As shown in Fig. 10, the value of |(T. Fe)obs.–(T. Fe)calc.| was almost within 5%, the average of |(T. Fe)obs.–(T. Fe)calc.| was 2.4%, and the standard deviation of |(T. Fe)obs.–(T. Fe)calc.| was 1.5%. Therefore, the accuracy of (FetO) estimation was about ±5%.
3.2.2. Dephosphorization Behavior during Decarburization
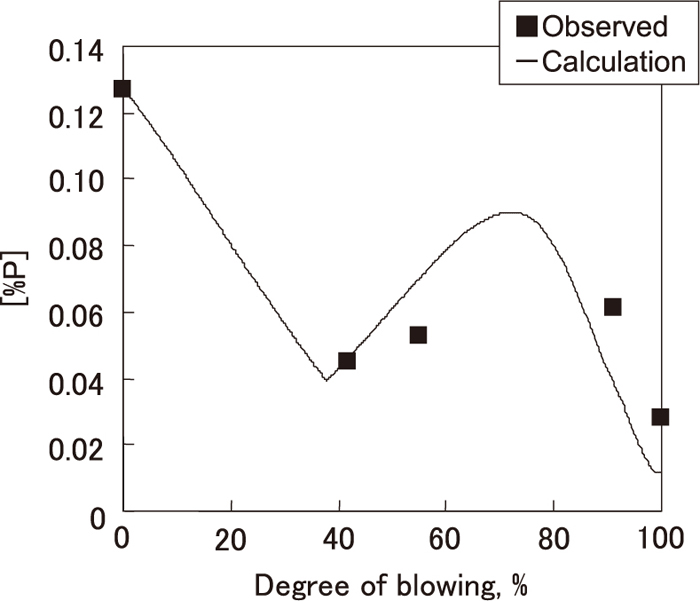
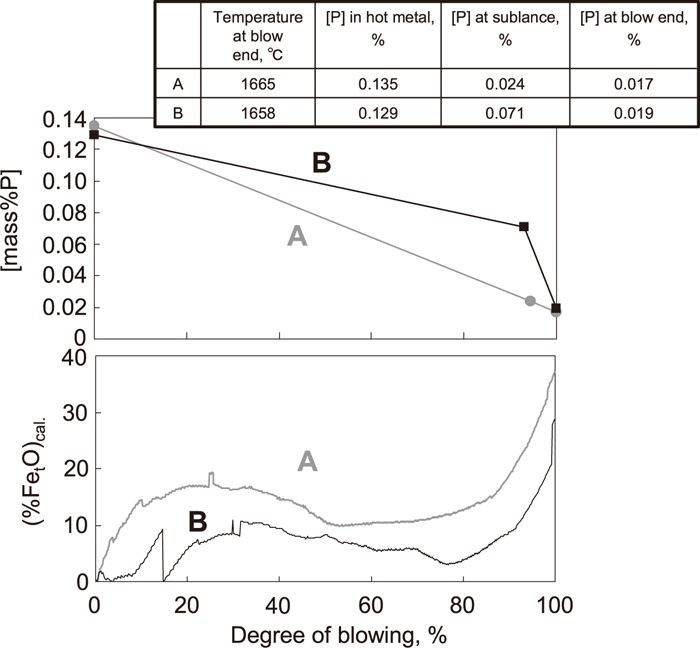
Figure 11 shows a comparison of the change in [P] and change of the calculated (FetO) contents in two typical heats in a 240 ton scale converter. In these heats, the specific consumption of lime and slag basicity were comparable. In heat B, there is discontinuous change of calculated (FetO) in the early stage of blowing. This is because silicon sourced was added in heat B and consumed immediately in the calculation, and then the oxygen balance became discontinuous. The degree of blowing means the percentage of oxygen in the total amount of oxygen during blowing. The sublance was thrown at 85–95% of blowing in order to measure temperature and [C]. In the following, the period after this point of blowing is described as the sublance stage of blowing. As shown in Fig. 11, in heat A, the dephosphorization rate between the initial stage and the sublance stage was higher when the calculated (%FetO) was at a higher level from the early stage of blowing compared to heat B. Higher (%FetO) would promote CaO dissolution in the early stage of blowing, and for this reason, the amount of dephosphorization from the initial stage to the sublance stage was increased. FetO was generated in the early stage of blowing, mainly within 40% of blowing, because after 40% of blowing almost all the supplied oxygen was consumed by decarburization.
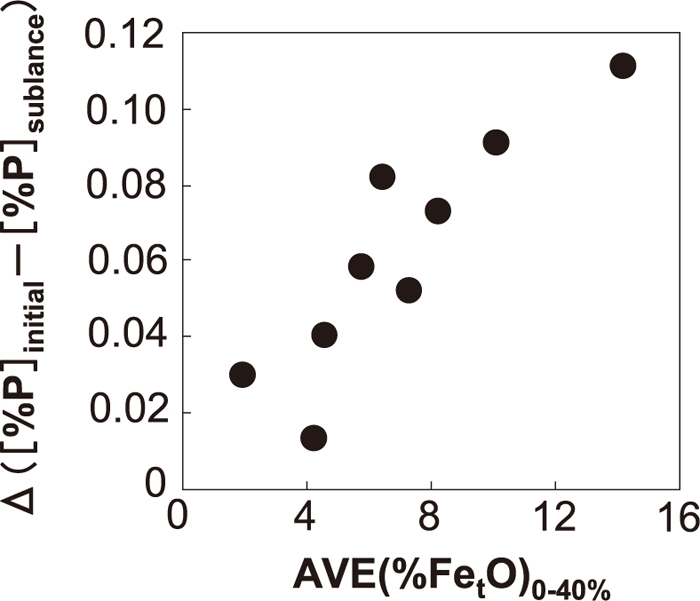
The relationship between FetO generation within 40% of blowing and dephosphorization behavior from the initial stage to the sublance stage was investigated from these viewpoints. The results are shown in Fig. 12. As shown in Fig. 12, the amount of dephosphorization from the initial stage to the sublance stage was increased by increasing the average of calculated (FetO) within 40% of blowing. This is because dephosphorization from the initial stage to 40% of blowing was promoted by promoting FetO generation in the early stage of blowing, and rephosphorization was hindered by the higher oxygen potential at the slag/metal interface, in line with the theory discussed in 3.1.
3.2.3. (FetO) Control by Top Blowing Conditions
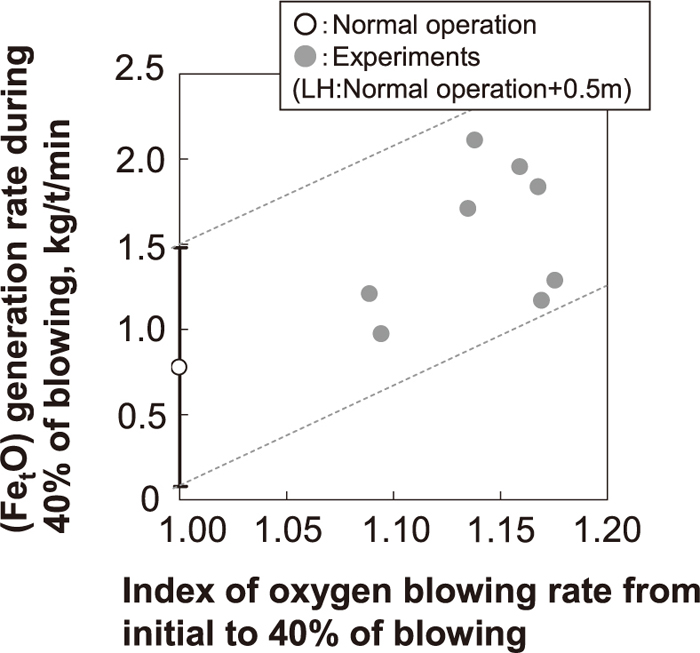
In order to promote FetO generation in the early stage of blowing, the influence of the oxygen flow rate and lance height on FetO generation during 40% of blowing was investigated. Under the condition that the lance height was increased by 0.5 m relative to the normal operation pattern, the FetO generation rate during 40% of blowing was evaluated by increasing the oxygen flow rate. The lance height was raised because the dynamic pressure at the surface of the molten hot metal was set to almost the same as the normal operation condition when the oxygen flow rate was increased. The results are shown in Fig. 13. The FetO generation rate during 40% of blowing was calculated by dividing the amount of FetO at 40% of blowing by the elapsed time to 40% of blowing. As shown in Fig. 13, FetO generation in the early stage of blowing can be promoted by increasing the oxygen flow rate and raising the lance height.
3.2.4. Dephosphorization Model in Decarburization Process
In order to suggest guidelines for effective dephosphorization in a 240 ton converter, construction of a dephosphorization model was attempted. In previous studies, a coupled reaction model was suggested by Oguchi et al.19) for the dephosphorization process of hot metal and developed by Kitamura et al.24) In the present study, a dephosphorization model for the decarburization process was suggested by incorporation of the coupled reaction model and the FetO estimation method as follows.
The reactions shown in Eqs. (10) and (11) are considered and the reaction rate of Eq. (10) is expressed by Eq. (12) on the assumption that the mass transfer of the slag and the metal phase is the rate controlling step. For decarburization, a phenomenological rate parameter for CO evolution (GCO) is introduced and the reaction rate is expressed by Eq. (13). The transfer rate of oxygen in the hot metal is expressed by Eq. (14).
|
[ M ]+n⋅[ O ]=(
MO
n
)
| (10) |
|
J
M
={
k
m
⋅
ρ
m
/(
100⋅
N
M
)
}{
[
%M
]
b
-
[
%M
]
i
}
={
k
s
⋅
ρ
s
/(
100⋅
N
M
O
n
)
}{
(
%
MO
n
)
i
-
(
%
MO
n
)
b
}
| (12) |
|
J
C
={
k
m
⋅
ρ
m
/(
100⋅
N
C
)
}{
[
%C
]
b
-
[
%C
]
i
}
=
G
CO
⋅(
P
CO
i
/
P
1
-1
)
| (13) |
|
J
O
={
k
m
⋅
ρ
m
/(
100⋅
N
O
)
}{
[
%O
]
b
-
[
%O
]
i
}
| (14) |
Where, JM: molar flux density of element M [mol·cm–2· sec–1], NM: molar weight of element M [g/mol], GCO: phenomenological rate parameter for CO evolution [mol·cm–2· sec–1],
P
CO
i
: saturation pressure of CO at interface [atm], P1: atmosphere pressure [atm], km: mass transfer coefficient of metal [cm/s], ks: mass transfer coefficient of slag [cm/s].
The equations for the equilibrium partition ratio of each reaction at an interface can be expressed by Eqs. (15) and (16) (effective equilibrium constant). The equilibrium constant and activity coefficient of each component in the metal phase were calculated based on thermodynamic data19) already reported. The activity coefficient of each component in the slag phase was calculated based on the regular solution model25) after Ban-ya et al. for a CaO–SiO2–MnO–MgO–FeO–Fe2O3–P2O5 system.
|
E
M
=
(
%
MO
n
)
i
[
%M
]
i
a
O
in
=
100C
N
MO
n
f
M
K
M
ρ
S
γ
MO
n
| (15) |
|
E
C
=
P
CO
i
[
%C
]
i
a
O
i
=
f
C
K
C
| (16) |
Where, EM: effective equilibrium constant of element M [–], KM: equilibrium constant of element M [–], fM: activity coefficient of element M [–], C: total molar concentration in slag [mol/cm3],
γ
MO
n
: activity coefficient of slag MOn [–],
a
O
i
: Henrian activity of oxygen at slag/metal interface on the weight percent basis.
a
O
i
is defined as following Eq. (17). The activity coefficient of oxygen fO is set to 1 because fO has little influence on JO.
From these equations and the electrical neutral equation, which is expressed by Eq. (18),
a
O
i
is obtained and the change of concentration for each element in the metal and the slag phase can be calculated.
|
2
J
Si
+
J
Mn
+
J
Fe
+2.5
J
P
+
J
C
-
J
O
-2
G
O
2
=0
| (18) |
Where,
G
O
2
: top-blowing oxygen supply rate per unit area of hot spot region [mol·cm–2·sec–1]. To calculate the influence of oxygen gas from the atmosphere, a similar treatment was proposed by Ohguchi et al.19) In the present case,
G
O
2
was estimated as the supply rate of top-blowing oxygen per cross section of hot metal in the converter.
The values of the parameters used in this calculation are shown in Table 3. The mass transfer coefficient in the metal phase (km) was calculated by Eq. (19), which was given by Kitamura et al.24) The mass transfer coefficient in the slag phase (ks) was calculated by Eq. (20).
|
log
k
m
=1.98+0.5log(
ε⋅
H
2
/L/100
)
-(
125 000/(
R⋅T
)
)
/2.3
| (19) |
|
k
s
=a⋅exp(
-
37 000
RT
)
⋅
ε
b
| (20) |
Table 3. Parameters used in dephosphorization model.
| Mass transfer coefficient of slag, ks’ | cm/s | 0.01–0.19 (based on Eq. (20)) |
| Mass transfer coefficient of metal, km’ | cm/s | 0.1–2.0 (based on Eq. (19)) |
| Metal density, ρm | g/cm3 | 7 |
| Slag density, ρs | g/cm3 | 3 |
| Temperature, T | K | 1500–1960 |
| Total molar concentration in slag, C | mol/cm3 | 0.035 |
| Oxygen activity coefficient, fO | | 1 |
| Partial pressure of CO gas, PCO | atm | 1 |
Where, ε: stirring energy [W/t], H: bass depth [cm], L: diameter of furnace [cm], R: gas constant [J·mol–1·K–1], a and b: fitting parameters [–]. In the Eq. (20), similar to Matsui et al.,1) a and b are assumed to be 1.7 and 0.25, respectively. The temperature measured in the decarburization experiment was used. The FetO content obtained by Eq. (2) at 2 second intervals was substituted for (%FeO)b in Eq. (12).
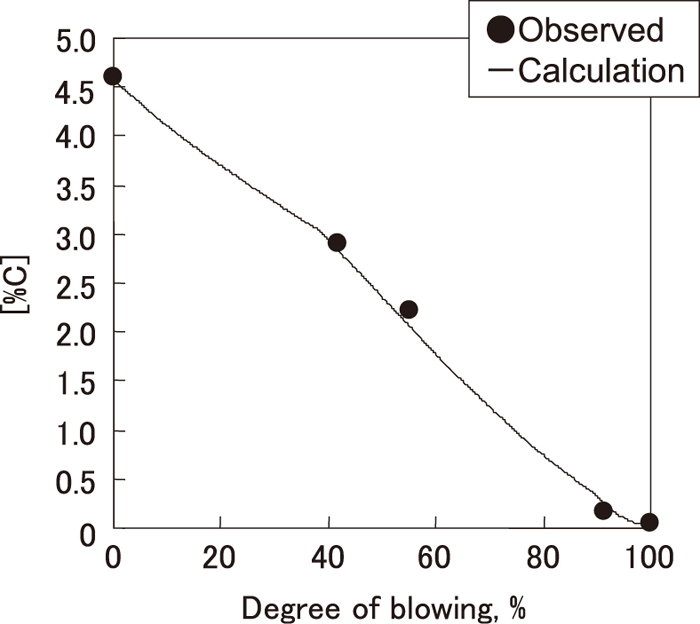
GCO was decided by fitting the calculated [C] to the observed [C] during blowing. In this study, GCO in the early stage of blowing was 5×10⁻⁹, and GCO in the higher decarburization rate period was 3×10⁻⁶. The change of calculated [C] based on the GCO obtained in this manner is shown in Fig. 14 with the observed [C]. GCO in the early stage of blowing was smaller than that in dephosphorization process reported by Matsui et al.1) (GCO=8×10⁻⁷). This is because [Si] in the hot metal was 0.24%, which was higher than that in Matsui et al.1) ([Si]=0.10–0.12), and the decarburization rate in the early stage of blowing was smaller.
The change in calculated [P] obtained by this method is shown in Fig. 15 with the observed results. As shown in Fig. 15, calculated [P] roughly corresponded to the observed values.
3.2.5. Effect of Bottom Gas Flow Rate Based on Dephosphorization Model in Decarburization Process
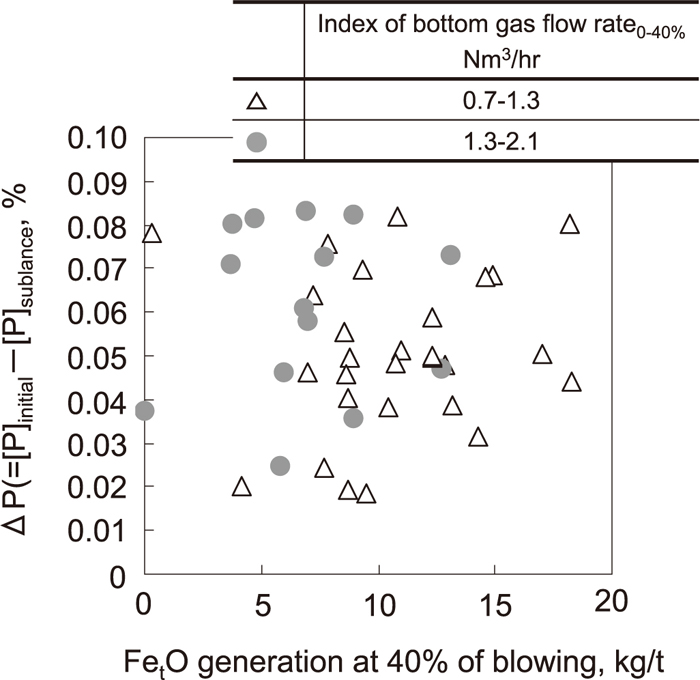
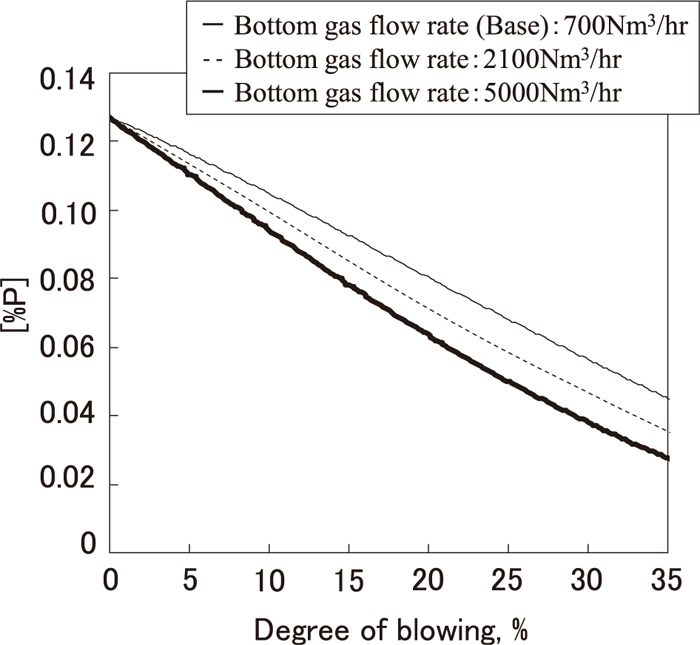
The influence of bottom gas stirring on the dephosphorization rate in the early stage of blowing was estimated by using the above dephosphorization model. The change of [P] was calculated in the case where bottom gas agitation in the early stage of blowing was changed. In these calculations, the (FetO) content obtained by Eq. (2) at 2 second intervals was assumed to be not changed by bottom gas agitation under the condition that the oxygen flow rate and the lance height were increased for promoting FetO generation as described in 3.2.3. The results are shown in Fig. 16. As shown in Fig. 16, the dephosphorization rate in the early stage of blowing was increased by increasing the bottom gas agitation, and when bottom gas agitation was increased to 7 times that in normal operation, the dephosphorization rate increased to 20% of that in normal operation. This is because the mass transfer coefficient in the metal phase (km) was increased by increasing the bottom gas agitation based on Eq. (18), and as a result, the dephosphorization rate was promoted. Based on these calculation results, experiments were performed by increasing the bottom gas agitation in the early stage of blowing in a 240 ton converter. The results are shown in Fig. 17. As shown in Fig. 17, the amount of dephosphorization during blowing increased in spite of decreasing FetO generation. From this, the effect of increasing the dephosphorization rate by increasing the bottom gas agitation, which was suggested by the dephosphorization model, was confirmed in a commercial-scale converter.
4. Conclusion
Small-scale laboratory experiments were carried out in order to investigate the rephosphorization condition in the higher decarburization rate period. Introduction of a (FetO) control technique for decarburization in a top and bottom blowing converter was attempted. The results are summarized as follows:
(1) Rephosphorization behavior was clarified qualitatively in laboratory experiments from the thermodynamic point of view based on the assumption of interfacial equilibrium.
(2) The oxygen potential in the slag phase at the rephosphorization point in the higher decarburization rate period obtained in laboratory experiments is higher than that in hot metal pretreatment reported in the literature.
(3) The (FetO) dynamic control system was introduced in a commercial 240 ton converter for the decarburization process. (FetO) can be estimated by the system, and the resulting accuracy of (FetO) was found to be within 5 mass% by comparison with slag samples.
(4) (FetO) generation estimated by this system was promoted by increasing the oxygen flow rate and raising the lance height in the early stage of blowing, and the amount of dephosphorization during blowing increased.
(5) A dephosphorization model was constructed by combining the coupled reaction model and the (FetO) estimation model. An increase of the amount of dephosphorization during blowing was suggested by this model, and this effect was confirmed in an experiment with the 240 ton converter.
References
- 1) A. Matsui, S. Nabeshima, H. Matsuno, N. Kikuchi and Y. Kishimoto: Tetsu-to-Hagané, 95 (2009), 207.
- 2) I. Tanaka, H. Shirono, M. Kanemoto, T. Yoshida, Y. Ueda and K. Isogami: Tetsu-to-Hagané, 66 (1980), S768.
- 3) Y. Onishi, K. Noro, T. Nakashima, S. Ogino, K. Iga, G. Yoshida, Z. Meguro and M. Mori: Tetsu-to-Hagané, 70 (1984), S260.
- 4) S. Nagata, Y. Ueda, A. Ochi, S. Eto, T. Yoshida and M. Kanemoto: Tetsu-to-Hagané, 71 (1985), S174.
- 5) T. Takawa, K. Katayama, M. Hoteiya and N. Hirayama: Tetsu-to-Hagané, 73 (1987), 836.
- 6) T. Takawa, K. Katayama, K. Katohgi and T. Kuribayashi: Tetsu-to-Hagané, 73 (1987), 844.
- 7) N. Bessho, S. Takeuchi, T. Fuzii, K. Nakanishi, H. Bada and J. Mori: Tetsu-to-Hagané, 75 (1989), 610.
- 8) J. Fukumi, C. Taki, S. Hatanaka and H. Ogura: Tetsu-to-Hagané, 76 (1990), 1956.
- 9) T. Saito, K. Ebato, I. Tsubone, H. Yamana and H. Takezoe: Tetsu-to-Hagané, 76 (1990), 1972.
- 10) B. Costa, P. Murino and G. Gameresi: Digital Computer Applications to Process Control, North-Holland Publishing Company, Amsterdam, (1977), 811.
- 11) P. Hahlin: Steel Times, Supplement, (1993), 4.
- 12) W. Lanzer and E. Weiler: IIASA Conf. Proc., Vol. 10, IIASA, Laxenburg, (1977), 71.
- 13) W. Vortrefflich, D. Bal and J. S. Wang: AISTech 2011 Proc., Vol. 1, Warrendale, PA, (2011), 1145.
- 14) C. Marique, J. M. Buydens, E. Castiaux, J. Claes, S. Knoops and M. Dutrieux: Steel Times, 4 (1992), 155.
- 15) D. Anderson, C. J. Parkin and E. A. du Bois: National Open Hearth and Basic Oxygen Steel Conf. Proc., Vol. 63, AIME, CO, (1980), 192.
- 16) A. Matsui, N. Kikuchi, S. Nabeshima and Y. Kishimoto: CAMP-ISIJ, 22 (2009), 131.
- 17) T. Kaneko, T. Matsuzaki and S. Tabuchi: Tetsu-to-Hagané, 78 (1992), 722.
- 18) P. Wei, M. Ohya, M. Hirasawa, M. Sano and K. Mori: Tetsu-to-Hagané, 76 (1990), 1488.
- 19) S. Ohguchi, D. G. C. Robertson, B. Deo, P. Grieveson and J. H. E. Jeffes: Ironmaking Steelmaking, 11 (1984), 202.
- 20) The Japan Society for Promotion of Science: The 19th Committee on Steelmaking, Steelmaking Data Sourcebook, rev. ed., Gordon and Breach Science Publishers, NY, (1984), 35, 289.
- 21) M. Iwase and E. Ichise: Physical Chemistry and Process Engineering of Steelmaking Reactions, ISIJ, Tokyo, (1985), 31.
- 22) H. Suito and R. Inoue: CAMP-ISIJ, 8 (1995), 183.
- 23) K. Miyamoto, K. Naito, I. Kitagawa and M. Matsuo: Tetsu-to-Hagané, 95 (2009), 199.
- 24) S. Kitamura, T. Kitamura, E. Aida, R. Sakomura, T. Kaneko and T. Nuibe: ISIJ Int., 31 (1991), 1322.
- 25) S. Banya: ISIJ Int., 33 (1993), 2.