Abstract
The standard Gibbs energy changes of the following reactions have been measured by using transpiration method;
The standard Gibbs energies of the formation of 4CaO·P2O5 (ΔG°f,(4CaO·P2O5)) and 3CaO·P2O5 (ΔG°f,(3CaO·P2O5)) have been derived as follows;
The reasons for discrepancies from reported values were discussed from the view point of whether the activity of phosphorus is measured directly or not.
1. Introduction
Current steelmaking processes using a blast furnace and converter unavoidably generate a large amount of steelmaking slag as by-product, consisting of CaO, SiO2 and FeO, etc. The effective reutilization of such the components is of great importance for the conservation of natural resource. Existence of phosphorus in the slag, however, impedes the reutilization. Recharging the slag containing phosphorus brings about closed circulation of phosphorus in the steelmaking system, resulting in the increase in phosphorus concentration in the produced steel. Thus, the most of steelmaking slag is currently recycled merely as road construction materials, in which case the phosphorus is essentially unrecycled.
Phosphorus has been used as fertilizer for long and balances between the irreplaceable phosphorus supply and the demand in developed countries are under fragile situation.1,2) Further, phosphate deposits yielding high-grade ore are rapidly disappearing, and available deposits may be exhausted within 100 years.3,4) Thus, the security of phosphorus is of urgent issues in the world. According to Matsubae et al.,5) in 2005, the amount of phosphorus imported to Japan as phosphate ore (101.4 kt-P) was almost the same as that in the slag generated in Japan (104 kt-P). It should be noted that the slag does not contain any naturally occurring radioactive materials (NORMs),6) different from natural phosphate ore. Hence, if only the phosphorus is recovered from steelmaking slag, we can not only recycle the entire component of slag but also contribute to securing phosphorous resource.
Phosphorus in the slag generally exists in the form of calcium phosphate. Nagata examined that vaporized yellow phosphorus could be obtained by baking the mixture of calcium phosphate in sewage, coke and silica at higher temperature.7) Shiomi et al. demonstrated phosphorus recovery from basic oxygen furnace slag with artificially added tin by using graphite powder as a reductant.8,9) It was reported that 78% of phosphorus was obtained from the slag with tin, 96.8% of which was recovered in vapor form.9) For such the vaporized recovery of phosphorus from calcium phosphate, the following reactions should be first considered;
|
4CaO⋅
P
2
O
5
(
s
)
+ 5C(
s
)
= 4CaO(
s
)
+P
2
(
g
)
+ 5CO(
g
)
| (1) |
|
4(3CaO⋅
P
2
O
5
)(
s
)
+ 5C(
s
)
= 3(4CaO⋅
P
2
O
5
)(
s
)
+
P
2
(
g
)
+ 5CO(
g
)
| (2) |
Theoretical estimation of vapor pressure of phosphorus based on thermodynamics is of great importance for the modeling of practical operation, and the standard Gibbs energy of formation of 4CaO·P
2O
5 (
ΔG°
f,(4CaO·P2O5)) and 3CaO·P
2O
5 (
ΔG°
f,(3CaO·P2O5)) should be well-known.
Discrepancies among reported ΔG°f,(4CaO·P2O5)10,11,12) and ΔG°f,(3CaO·P2O5),10,12,13) however, were about 100 kJ/mol and 50 kJ/mol, respectively at maximum. Such the discrepancy causes considerable misestimation in the pressure of phosphorus gas generated; for instance, the maximum phosphorus pressure is seven orders of magnitude higher than minimum in the case of reaction (1) (PCO = 0.1 atm, T = 1473 K). One of the possible reasons for the discrepancies is that in all of the reported methods using equilibrium between 4CaO·P2O5 and CaO (or 4CaO·P2O5 and 3CaO·P2O5) under a given gas atmosphere, the partial pressure of phosphorus gas is not directly measured but the activity of phosphorus in a liquid metal like iron, copper and silver simultaneously equilibrating with above mixture is measured instead. Even if the activity of phosphorus is precisely determined, since solubilities of phosphorus in the metals are low and therefore the standard Gibbs energy change for P2(g) = 2P (in metal) includes relatively higher experimental error, the finally obtained ΔG°f,(4CaO·P2O5) and ΔG°f,(3CaO·P2O5) unavoidably contain higher experimental error.
Hence, the aim of present study is to determine ΔG°f,(4CaO·P2O5) and ΔG°f,(3CaO·P2O5) by directly determining the vapor pressure of phosphorus and to evaluate their reliabilities by comparing reported values.
2. Experimental
2.1. Experimental Principle
The binary phase diagram for CaO–P2O5 in Fig. 1 indicates that pure 4CaO·P2O5 equilibrates with pure CaO below 1900 K since 4CaO·P2O5 and CaO do not have solubility mutually.14) Similarly, pure 3CaO·P2O5 is in equilibrium with pure 4CaO·P2O5 below 1850 K.14) The equilibrium constants, K(1) and K(2) for the reactions (1) and (2), respectively, are expressed by;
|
K
(
1
)
=
a
CaO
4
⋅
P
CO
5
⋅
P
P
2
a
4CaO⋅
P
2
O
5
⋅
a
C
5
| (3) |
|
K
(
2
)
=
a
3CaO⋅
P
2
O
5
4
⋅
P
CO
5
⋅
P
P
2
a
3CaO⋅
P
2
O
5
4
⋅
a
C
5
,
| (4) |
where
ai and
Pi are activities and partial pressures of component
i with the reference to pure substance under 1 bar, respectively. Assuming that the activities of CaO, 4CaO·P
2O
5, 3CaO·P
2O
5 and C are unity, the standard Gibbs energy changes for the reactions (1),
ΔG°
(1), and (2) ,
ΔG°
(2), are expressed as follows;
|
ΔG
°
(1)
=-RT ln(
P
P
2
⋅
P
CO
5
)
| (5) |
|
ΔG
°
(2)
=-RT ln(
P
P
2
⋅
P
CO
5
)
,
| (6) |
where
R is the gas constant (8.314 kJmol
–1) and
T is the absolute temperature. When the mixture of powders, consisting of CaO, C and 4CaO·P
2O
5 for reaction (1) and 4CaO·P
2O
5, 3CaO·P
2O
5 and C for reaction (2), is allowed to equilibrate with CO gas at given partial pressure, phosphorus gas is immediately generated. By measuring the partial pressure of generated phosphorus gas, the standard Gibbs energy changes are obtained.
In this study, a transpiration method was used to determine the partial pressure of phosphorus gas. The carrier gas of Ar–CO delivers saturated phosphorus gas downstream, followed by solidified trapping of phosphorus, the weight increase rate of which provides the partial pressure of phosphorus gas.
It should be noted that phosphorus gas exists in the forms of not only P2 but also P and P4. By thermodynamics calculation of the reaction, 2P (g) = P2 (g), the partial pressure of P is negligible.15) Thus, it is assumed in this study that phosphorus gas consists of only P2 and P4. Since experimental conditions of this study are atmospheric pressure and elevated temperatures, the following equations can be introduced based on ideal gas law;
|
P
P
2
dV
dt
=RT
d
n
P
2
dt
=
RT
2
M
P
d
m
P
dt
| (7) |
|
P
P
4
dV
dt
=RT
d
n
P
4
dt
=
RT
4
M
P
d
m
′
P
dt
,
| (8) |
where
V indicates gas flow volume at sample temperature,
t, time,
ni, molarity of component
i,
MP, atomic weight of phosphorus,
mP and
m’
P, weight of solidified phosphorus from P
2 and P
4, respectively. Therefore, next equation obtains total weight of solidified phosphorus from P
2 and P
4,
mtotal;
|
d
m
total
dt
=
2
M
P
(
P
P
2
+2
P
P
4
)
RT
dV
dt
| (9). |
Values of
T and
dV/
dt can be determined from experimental conditions, and
dmtotal/dt is measurable. By combining
Eqs. (9) and
(10), the latter of which shows the thermodynamic relationship between
PP2 and
PP4,
15) the partial pressure of phosphorus gas can be determined.
|
P
P
4
P
2
P
2
=exp(
-17.805+
26 992.4
T
)
| (10) |
Reagent grade of powders of 4CaO·P2O5 and 3CaO·P2O5 (Taihei Chemical Industrial Co. Ltd.) with mean particle size of about 10 μm. CaO powder was obtained by the calcination of CaCO3 (Shuzui Hikotaro Shoten) with 99.9 mass% purity at 1473 K for 12 h in air. Graphite with the purity of > 99.7% and particle size of 5 μm was purchased from Soekawa Chemical Co. Ltd. The mixtures of powders, satisfying stoichiometric compositions of the reaction (1) and (2), were weakly milled for 20 min using a mortar.
Figure 2 shows the schematic diagram of experimental apparatus. Argon and carbon monoxide gases were prepared by mass flow controller, followed by introduction into a reaction chamber, which was heated by an infrared gold image furnace (ULVAC-RIKO). Outlet gas was introduced into cold trap described below. At the end of experimental system, the outlet gas was burned with city gas.

Details of the reaction chamber are drawn in Fig. 3. The reaction chamber made from quartz is transparent to infrared. About 20 g of mixed powder was placed in the reaction chamber covered with a gas-permeable sheet made from carbon fiber (Toho Tenax Co. Ltd., W-6110). Since the surface of the carbon fiber sheet is coated by resin, it was immersed into acetone and fired at 573 K before use to avoid the formation of unexpected gas species. Upper space of reaction chamber was occupied with porous brick which plays roles of not only thermal buffer but also prevention of reverse flow by thermal convection. Sample temperature was monitored by R-type thermocouple placed on the sample.

The Ar–CO gas delivers generated phosphorus gas into a downstream cold trap cooled by water with ice. Unexpected phosphorus deposition apart from the cold trap is avoided by thermal insulation of reaction chamber using glass fiber. The cold trap with inner diameter of 50 mm and height of 75 mm is made from aluminum, inside of which is filled with plenty of aluminum foils to increase surface area. Total weight of the cold trap is less than about 10 g and the measurement accuracy of a used electro-balance in the weight range is 0.001 g.
2.3. Experimental Procedure
The measurements were carried out in the following procedure; After placing the sample into given position in the reaction chamber, the reaction chamber was then purged by Ar gas, followed by heat treatment at 473 K for 10 min to remove remaining acetone from the carbon fiber sheet. Then, the cold trap was connected with the reaction chamber, and the entire system was purged by CO gas with atmospheric pressure, preventing the sample from generating phosphorus gas at elevated temperatures. After reaching at given temperature, the reaction chamber was purged by Ar-CO gas, which was set as start of measurement. After finishing the measurement, the reaction chamber was purged by CO gas, followed by cooling. Below the temperature of 773 K, the reaction chamber was replaced by Ar gas and the cold trap was removed around room temperature to measure the weight increase.
2.4. Experimental Conditions
Experimental conditions were summarized in Table 1. The experimental conditions were determined from the results of preliminary experiments in order to obtain 0.1–1 g of phosphorus because higher pressure of CO causes a larger amount of phosphorus formation resulting in non-equilibrium reaction and lower pressure of CO requires longer experimental duration. When the gas flow rate of carrier gas is too fast, the phosphorus gas does not saturate in the carrier gas, resulting in underestimation of partial pressure. On the contrary, when it is too slow, phosphorus possibly deposits in unexpected positions and reverse flow by thermal convection may occur, resulting in also underestimation. Hence, the flow rate of the carrier gas was varied from 100 to 400 cm3/min to confirm the saturation of phosphorus gas in the carrier gas, namely, equilibrium condition. As the results, constant partial pressure was measured when the gas flow rate ranges from 100 to 400 cm3/min at 1373 K as shown in Fig. 4. Thus, we employed 400 cm3/min as the gas flow rate in this study, in which condition the change in the partial pressure of CO gas by the generation of CO gas as the results of reactions (1) and (2) are regarded as negligible small.
Table 1. Experimental conditions for 4CaO·P
2O
5 and 3CaO·P
2O
5.
| 4CaO·P2O5 |
Temperature
(K) |
Gas flow rate
(L/min) |
CO pressure
(atm) |
Measuring time
(hour) |
| 1373 |
0.4 |
0.02 |
3, 6, 9 |
| 1423 |
0.4 |
0.05 |
3, 6, 9 |
| 1473 |
0.4 |
0.1 |
3, 6, 9 |
| 1523 |
0.4 |
0.25 |
1, 2, 3 |
| 1573 |
0.4 |
0.5 |
0.5, 1, 1.5 |
| 3CaO·P2O5 |
Temperature
(K) |
Gas flow rate
(L/min) |
CO pressure
(atm) |
Measuring time
(hour) |
| 1448 |
0.4 |
0.12 |
1, 2, 3 |
| 1473 |
0.4 |
0.2 |
1, 2, 3 |
| 1498 |
0.4 |
0.35 |
1, 2, 3 |
| 1523 |
0.4 |
0.6 |
1, 2, 3 |
3. Results
3.1. Relation between the Mass Increase in Phosphorus and the Measuring Time
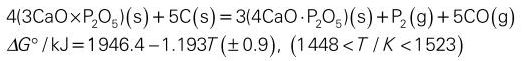
Figure 5 shows the relationship between the experimental time and the weight increase in phosphorus deposited for 3CaO·P2O5 at 1498 K, as a representative result. There is a good linearity. Similar results were obtained for other temperatures and for the case of 4CaO·P2O5. From the slope of linear relationship and Eqs. (5) and (6), the standard Gibbs energy changes for the reactions (1) and (2) are determined as follows;
|
4CaO⋅
P
2
O
5
(
s
)
+5C(
s
)
= 4CaO(
s
)
+
P
2
(
g
)
+ 5CO(
g
)
ΔG
°
(1)
/kJ=1 623.6-0.953T(
±2.7
)
(
1 373<T/K<1 573
)
| (11) |
|
4(3CaO⋅
P
2
O
5
)(
s
)
+5C(
s
)
=3(4CaO⋅
P
2
O
5
)(
s
)
+P
2
(
g
)
+ 5CO(
g
)
ΔG
°
(2)
/kJ=1 946.4-1.193T(
±0.9
)
(
1 448<T/K<1 523
)
,
| (12) |
which are shown in Fig. 6.
The standard Gibbs energy of formation for tetracalcium phosphate and tricalcium phosphate from elements, ΔG° f(4CaO·P2O5) and ΔG°(3CaO·P2O5), are derived using the standard Gibbs energy of formation for CaO15) and CO15) as shown in the following equations;
|
ΔG°
f(4CaO⋅
P
2
O
5
)
/kJmol
-1
=5ΔG°
f(CO)
+4ΔG°
f(CaO)
-ΔG°
(1)
=-4 765.4+0.965T(
±2.7
)
(
1 373<T/K<1 573
)
| (13) |
|
ΔG°
f(3CaO⋅
P
2
O
5
)
/
kJmol
-1
=(5ΔG°
f(CO)
+3ΔG°
f(4CaO⋅
P
2
O
5
)
-ΔG°
(2)
)/4
=-4 200.1+0.912T(
±0.9
)
(
1 448<T/K<1 523
)
,
| (14) |
where experimental errors of following reactions are ignored.
|
ΔG°
f(CaO)
=-646.0+0.113T
| 15) |
|
ΔG°
f(CO)
=-111.6+0.0881T.
| 15) |
4. Discussion
4.1. Confirmation of Equilibrium
Considering the amount of generated phosphorus gas (0.1–1 g), it is expected by theoretical calculations that neither of initial sample components was fully consumed during the experiments. Figures 7 and 8 shows the representative XRD patterns before and after the experiments for 4CaO·P2O5 and 3CaO·P2O5, respectively. It is confirmed that no remarkable disappearance or appearance is seen in these patterns after the experiments. This means that the part of initial components still existed after the experiments. It also means that any unexpected reactions were not occurred during the experiments. Thus, it is said that the reactions (1) and (2) proceeded till the end of experiments keeping the equilibrium conditions set in Fig. 4.
4.2. Experimental Error
In this study, the generation of phosphorus gas during heating was suppressed by keeping CO pressure 1 atm. However, a slight amount of phosphorus gas generation should be considered. Among all the experiments in this study, the partial pressure of phosphorus of the reaction (2) at 1523 K is highest. In this condition, total amount of phosphorus gas generated during heating is calculated to be 3.9 × 10⁻⁵ g/min which corresponds to 2.2 mass% of total amount of phosphorus generated during whole experiment. The estimated error considering the phosphorus generation is less than the experimental error shown in the Eqs. (13) and (14). Thus, such the experimental error can be ignorable.
Further it is possible that carbon from carbon fiber sheet reacts with SiO2 from reaction chamber, resulting in the generation of SiO gas by following reaction;
|
SiO
2
(
s
)
+ C(
s
)
= SiO(
g
)
+ CO(
g
)
.
|
The generated SiO gas is delivered together with phosphorus gas and deposits as SiO
2 by reverse reaction of above, resulting in the overestimation of partial pressure of phosphorus gas. However, it is found that the partial pressure of SiO gas is lower than two orders of magnitude from thermodynamic calculation.
15) If it is supposed that phosphorus deposit contains 1 mass% of SiO
2, the experimental error in the standard Gibbs energy change is estimated to be ± 0.1 kJ. Thus, above effect can be ignorable.
4.3. Comparison with Other Reports
Since there are great discrepancy among the reported values of standard Gibbs energy of the formation for CaO, the following reactions estimated from Eqs. (11) and (12) and the standard Gibbs energy of formation for CO15) will be used for the comparison in this section;
|
4CaO(
s
)
+ P
2
(
g
)
+
5/2O
2
(
g
)
= 4CaO⋅
P
2
O
5
(
s
)
| (15) |
|
ΔG°
(15)
/kJmol
-1
=-2 181.4+0.513T(
±2.7
)
(
present study
)
| (16) |
|
3CaO(
s
)
+
P
2
(
g
)
+
5/2O
2
(
g
)
= 3CaO⋅
P
2
O
5
(
s
)
| (17) |
|
ΔG
°
(17)
/
kJmol
-1
=-2 262.1+0.573T(
±0.9
)
(
present study
)
| (18) |
Figures 9 and 10 show the ΔG°(15) and ΔG°(17) compared with reported values, respectively. The used values of ΔG°(15) and ΔG°(17) in the figures calculated from other reports are summarized in Table 2. Since the vapor pressures of phosphorus gas were not directly measured in the previous reports, we use ΔG°(15) and ΔG°(17) for the comparison. Before the discussion, experimental method for each reported value will be briefly summarized.

Table 2. The calculated standard Gibbs energy change of the reaction from reported values; 4CaO(s) + P
2(g) + 5/2O
2(g) = 4CaO·P
2O
5(s) and 3CaO(s) + P
2(g) + 5/2O
2(g) = 3CaO·P
2O
5(s).
| 4CaO(s) + P2(g) + 5/2O2(g) = 4CaO·P2O5(s) |
| Aratani et al.19) | –2729 + 0.801T, (1813 < T/K < 1873) |
| Ban-ya et al.16,20) | –2334 + 0.589T, (1803 < T/K < 1853) |
| Bookey10) | –2265 + 0.547T, (1523 < T/K < 1823) |
| Iwase et al.11) | –2316 + 0.521T, (1423 < T/K < 1523) |
| Tagaya et al.12) | –2207 + 0.505T, (1473 < T/K < 1598) |
| Present study | –2181 + 0.513T, (1373 < T/K < 1573) |
| 3CaO(s) + P2(g) + 5/2O2(g) = 3CaO·P2O5(s) |
| Bookey10) | –2247 + 0.541T, (1523 < T/K < 1823) |
| Tagaya et al.12) | –2198 + 0.504T, (1473 < T/K < 1598) |
| Yama-zoe et al.13) | –2299 + 0.525T, (1423 < T/K < 1523) |
| Present study | –2262 + 0.573T, (1448 < T/K < 1523) |
Unit: kJmol–1
Tagaya et al.12) determined ΔG°f(4CaO·P2O5) and ΔG°f(3CaO·P2O5) by combining the standard Gibbs energy changes of following reactions;
|
3(4CaO⋅
P
2
O
5
)(
s
)
+ 2P(
mass% in Fe
)
+ 5CO(
g
)
=4(3CaO⋅
P
2
O
5
)(
s
)
+ 5C(
s
)
| (19) |
|
3CaO⋅
P
2
O
5
(
s
)
+ Ca(
mass% in Ag
)
+ CO(
g
)
= 4CaO⋅
P
2
O
5
(
s
)
+ C(
s
)
| (20) |
|
1/2P
2
(
g
)
= P(
mass%, in Ag
)
| (21) |
|
ΔG°
(21)
/kJmol
-1
=-20.5+0.53×
10
-3
T
| (22) 12) |
|
P(
mass%, in Ag
)
= P(
mass%, in Fe
)
| (23) |
|
ΔG
°
(23)
/
kJmol
-1
=137.2+10.34×
10
-3
T
| (24) 16) |
|
1/2 P
2
(
g
)
=P(
mass%, in Fe
)
| (25) |
|
ΔG
°
(25)
/kJmol
-1
=-157.7+5.4×
10
-3
T
| (26) 17) |
Iwase et al.11) employed the following electrochemical cell to determine ΔG°(27) ;
|
Mo/Mo+MoO
2
// ZrO
2
(
MgO
)
/
(
Cu+P
)
alloy
+
(
CaO+CaCl
2
+P
2
O
5
)
slag
+CaO+4CaO⋅
P
2
O
5
/Mo
4CaO(
s
)
+2P(
mass% in Cu
)
+
5/2O
2
(
g
)
= 4CaO⋅
P
2
O
5
(
s
)
| (27) |
By compiling the reactions (27) and (28),
ΔG°
f(4CaO·P2O5) is obtained.
|
1/2P
2
(
g
)
= P(
mass%, in Cu
)
| (28) |
|
ΔG
°
(28)
/kJmol
-1
=-125+0.54×
10
-3
T
| (29) 18) |
Yama-zoe et al.13) measured the standard Gibbs energy of the following reaction;
|
4(3CaO⋅
P
2
O
5
)(
s
)
+ 2P(
1% in Cu
)
+ 5CO(
g
)
= 3(4CaO⋅
P
2
O
5
)(
s
)
+ 5C(
s
)
| (30) |
By combining the reactions (30) and (28), they obtains;
|
3CaO⋅
P
2
O
5
(
s
)
+
P
2
(
g
)
+
5/2O
2
(
g
)
= 4CaO⋅
P
2
O
5
(
s
)
| (31) |
|
ΔG
°
(30)
/kJmol
-1
=-2 295+0.536T
| (32) |
Since they did not derive
ΔG°
f(3CaO·P2O5), we calculate it by compiling the reactions (27) and (30).
Bookey10) reported ΔG°(15) and ΔG°(17) from following reactions;
|
4CaO(
s
)
+
P
2
(
g
)
+
5H
2
O(
g
)
= 4CaO⋅
P
2
O
5
(
s
)
+
5H
2
(
g
)
| (33) |
|
3(4CaO⋅
P
2
O
5
)(
s
)
+P
2
(
g
)
+5H
2
O(
g
)
= 4(3CaO⋅
P
2
O
5
)(
s
)
+
5H
2
(
g
)
| (34) |
Aratani et al.19) studied the equilibrium between Fe–P alloy and H2–H2O mixture in a CaO crucible and obtained the following results;
|
4CaO(
s
)
+2P(
mass% in Fe
)
+
5H
2
O(
g
)
= 4CaO⋅
P
2
O
5
(
s
)
+
5H
2
(
g
)
| (35) |
|
ΔG
°
(33)
/kJmol
-1
=-1 180+0.510T
| (36) |
Ban-ya et al.16,20) measured ΔG°(38) by equilibrium between the Fe–C–P melts with solid CaO and 4CaO·P2O5 under a CO–CO2 mixture.
|
4CaO(
s
)
+ 2P(
mass% in Fe
)
+
5CO
2
(
g
)
= 4CaO⋅
P
2
O
5
(
s
)
+ 5CO(
g
)
| (37) |
|
ΔG
°
(38)
/kJmol
-1
=-613.8+0.152T
| (38) |
Since ΔG°f(4CaO·P2O5) was not directly reported by them, we derive it by the combination between the reactions (38) and (26) and obtain ΔG°(15).
It is found that the slopes of ΔG°(15) and ΔG°(17) determined in the present study are roughly in agreement with the reported values, respectively, while absolute values are different. The reason for the differences can be explained in terms of experimental method used, as described in the introduction. Namely, since phosphorus concentrations in molten metals seen in other studies are considerably low, experimental errors in the determination of phosphorus concentration may become greater. Thus, even if ΔG°(27) or ΔG°(35) were precisely measured, the experimental errors in ΔG°(28) or ΔG°(25) become dominant. In the present study, since phosphorus pressure is directly measured as weight change of deposited phosphorus, such the experimental error due to other reaction can be avoided. Although Bookey did not use the equilibrium between the molten metal and the phosphorus either, the partial pressure of phosphorus gas was not measured directly but stoichiometrically estimated as one fifth of water vapor pressure, and the equilibriums of reaction (33) and (34) were not sufficiently confirmed. By the way, the reason why the slopes are roughly in good agreement with one another is that temperature coefficients of ΔG°(22), ΔG°(26) and ΔG°(29) are relatively small.
Looking at Fig. 9 carefully, ΔG°(15) by Ban-ya et al.16,20) and Aratani et al.19) show similar values, and they used common equilibrium between the phosphorus and the molten iron. The ΔG°(15) by Iwase et al.11) using molten copper is lowest and that by Tagaya et al.12) using molten silver is intermediate. Same order can be seen in Fig. 10 in the case of ΔG°(17). This order can be partly explained from the viewpoint of the measurement temperatures which seems to be restricted by the melting point of metals used. In the case of ΔG°(15) (Fig. 9), for example, the measurement temperatures by Iwase et al. are 1423–1523 K, by Tagata et al., 1473–1598 K and by Ban-ya et al., 1803–1853 K. The differences between the reported values of ΔG°(15) and those (or extrapolated values to higher temperatures) of present study become clearly smaller when the measurement temperatures are higher. In the case of reaction (2), it is seen in Fig. 10 that the values of ΔG°(17) measured by Tagaya et al. using molten silver is closer to our values than those by Yama-zoe et al. using molten copper. This implies a possibility that the dissolution reaction of phosphorus into molten metal in previous investigations did not reach equilibrium sufficiently, especially when the measurements temperature was lower, resulting in the underestimation of phosphorus activity.
5. Conclusion
The standard Gibbs energy changes of the following reactions have been measured by using transpiration method;
|
4CaO⋅
P
2
O
5
(
s
)
+5C(
s
)
= 4CaO(
s
)
+
P
2
(
g
)
+ 5CO(
g
)
ΔG°/kJ=1 623.6-0.953T(
±2.7
)
, (
1 373<T/K<1 573
)
|
|
4(3CaO⋅
P
2
O
5
)(
s
)
+5C(
s
)
=3(4CaO⋅
P
2
O
5
)(
s
)
+ P
2
(
g
)
+5CO(
g
)
ΔG°/kJ=1 946.4-1.193T(
±0.9
)
,(
1 448<T/K<1 523
)
|
The standard Gibbs energies of the formation of 4CaO·P
2O
5 (
ΔG°
f,(4CaO·P2O5)) and 3CaO·P
2O
5 (
ΔG°
f,(3CaO·P2O5)) have been derived as follows;
|
ΔG°
f(4CaO⋅
P
2
O
5
)
/
kJmol
-1
=-4 765.4+0.965T(
±2.7
)
,
(
1 373<T/K<1 573
)
|
|
ΔG°
f(3CaO⋅
P
2
O
5
)
/
kJmol
-1
=-4 200.1+0.912T(
±0.9
)
,
(
1 448<T/K<1 523
)
,
|
where experimental errors ignore those of standard Gibbs energies of the formation for CaO and CO.
The standard Gibbs energy changes of following reactions determined in the present study show maximum values compared with reported values;
|
4CaO(
s
)
+P
2
(
g
)
+5/2O
2
(
g
)
= 4CaO⋅
P
2
O
5
(
s
)
ΔG°/
kJmol
-1
=-2 181.4+0.513T(
±2.7
)
|
|
3CaO(
s
)
+P
2
(
g
)
+5/2O
2
(
g
)
= 3CaO⋅
P
2
O
5
(
s
)
ΔG°/
kJmol
-1
=-2 262.1+0.573T(
±0.9
)
|
Acknowledgement
This work has been partly supported by Research Institute of Science and Technology for Society of Japan Science and Technology Agency, (JST-RISTEX) as the research program on Science of Science, Technology and Innovation Policy.
References
- 1) D. A. Vaccari: Chemosphere, 84 (2011), No. 6, 735.
- 2) D. Cordell, A. Rosemarin, J. J. Schröder and A. L. Smit: Chemosphere, 84 (2011), No. 6, 747.
- 3) K. Christen: Environ. Sci. Technol., 41 (2007), No.7, 2078.
- 4) P. H. Abelson: Science, 283 (1999), 2015.
- 5) K. Matsubae-Yokoyama, H. Kubo, K. Nakajima and T. Nagasaka: J. Ind. Ecology, 13(5) (2009), 687.
- 6) A. J. Poole, D. J. Allington, A. J. Baxter and A. K. Young: Sci. Total Environ., 173–174 (1995), 137.
- 7) K. Nagata: Kinzoku, 54 (1986), 17.
- 8) S. Shiomi, N. Sano and Y. Matsushita: Tetsu-to-Hagané, 63 (1977), No. 9, 1520.
- 9) S. Shiomi, M. Maeda, N. Sano and Y. Matsushita: Tetsu-to-Hagané, 65 (1979), No. 14, 2032.
- 10) J. B. Bookey: J. Iron Steel Inst., 172 (1952), No. 1, 61.
- 11) M. Iwase, H. Fujiwara, E. Ichise, H. Kitaguchi and K. Ashida: Trans. ISS, 11 (1990), 31.
- 12) A. Tagaya, F. Tsukihashi and N. Sano: Trans. ISS, 13 (1992), 59.
- 13) H. Yama-zoe, E. Ichise, H. Fujiwara and M. Iwase: Trans. ISS, 12 (1991), 75.
- 14) E. M. Levin, C. R. Robbins and H. F. Macmurdie: Phase Diagram for Ceramists, 5th ed., Vol. I, The American Ceramic Society, Westerville, OH, (1985).
- 15) I. Barin and G. Platzki: Thermochemical Data of Pure Substances, VCH, Westerville, OH, (1995).
- 16) S. Ban-ya and M. Suzuki: Tetsu-to-Hagané, 61 (1975), No. 14, 2933.
- 17) M. Yamamoto, K. Yamada, L. L. Meshkov and E. Kato: Tetsu-to-Hagané, 66 (1980), No. 14, 2032.
- 18) M. Iwase, E. Ichise and N. Yamada: Steel Res., 56 (1985), 319.
- 19) F. Aratani, Y. Omori and K. Sanbongi: Tetsu-to-Hagané, 54 (1968), No. 2, 143.
- 20) S. Ban-ya and S. Matoba: Tetsu-to-Hagane, 49 (1963), No. 4, 666.