Abstract
A quantitative analysis of copper in steel scraps was investigated by using laser induced plasma spectrometry. A Nd:YAG laser at a wavelength of 532 nm was employed to generate the plasma under reduced argon atmospheres. Several experimental parameters, such as an argon pressure, a gate width and a delay time of the spectrometer were optimized to obtain a calibration curve having higher sensitivity and better linearity. Several line pairs of copper and iron were also investigated as a candidate of the analytical line for measuring the intensity ratio converted into the atomic ratio of copper to iron in steel scraps. The Cu I 324.754-nm line was more suitable for the analytical line than the Cu I 327.396-nm line due to its higher intensity. Line pairs of Cu I 324.754 nm to several iron lines, Fe I 381.583 nm, Fe I 382.043 nm, and Fe II 276.750 nm, were measured to compare criteria of their calibration curves, such as a slope, an intercept and a regression coefficient. As a result, it was recommended that a calibration curve for the intensity ratio of Cu I 324.754 nm/Fe II 276.750 nm could be employed in the actual application because it had a regression coefficient of almost unity over a concentration range up to 1.0 mass% Cu in standard reference samples of iron-copper binary alloy. The limit of detection, based on three times the standard deviation of the emission intensity at 324.75 nm in a pure iron sample, was estimated to be the Cu/Fe atomic ratio of 0.00059.
1. Introduction
Iron ore, which is employed as a main raw material in worldwide steel-making industries, is now decreasing in production, while the price of the iron ore becomes several times higher in this decade. In contrast with the iron ore, larger amounts of steel scrap have been consumed in the production of various steel materials. Recycling of scrapped steels needs to meet the requirement of steel production more effectively, and the cost of steels would be reduced accordingly. Alloyed elements in steels, such as copper, nickel, chromium, vanadium and molybdenum, should be recovered appropriately due to higher prices and rare resources of them. Moreover, several elements such as copper and tin, we call tramp elements, fundamentally determine the quality of the final products, so that these elements should be strictly controlled. Therefore, a rapid and accurate detection technique is required for checking the composition of scraps before melting and the content of tramp elements can be controlled on site.
Laser induced plasma spectrometry (LIPS) is widely recognized as a direct analytical method for various samples because of the rapid response and no-pretreatment of sample.1,2,3,4,5) A pulsed laser beam with high power density, which is generated by a Nd:YAG laser in several generation modes, is irradiated on a sample surface and a plasma body is generated subsequently in the surrounding gas zone, and sample atoms ablated by the laser irradiation are ionized/excited in the plasma immediately. The spatial and temporal features of the laser induced plasma (LIP), varied by several experiment factors such as the kind and pressure of the plasma gas, are dominantly derived from the expansion process of the plasma plume.6,7) The reason for this is that the emission zone is largely varied with a progress of the plasma, depending on the nature of the plasma gas.6,7) It is also known that relatively low fluctuations and high signal to background ratios of the emission intensity can be obtained under reduced pressures compared with the medium and high pressure conditions, which is relatively independent of the kind of the plasma gas.8,9,10,11) For the actual applications, argon is employed most commonly, due to the good analytical characteristics as well as its low cost. The LIPS using argon gas has attracted an increasing attention for analytical uses in recently years; one of these applications is that minor amounts of the alloyed elements in metallic samples can be determined by a calibration curve method.12)
A calibration curve in LIPS, which is a plot of the intensity ratio of an analytical line to a reference line versus the atomic ratio of an analyte element, is obtained with standard reference materials of known elemental concentration which should have a similar matrix of the unknown sample to be analyzed. The experimental conditions affecting the analytical performance must be well studied for obtaining the accurate quantitative result by the calibration curve method. The regression coefficient (R2) indicates the precision of the calibration curve, and it is one of the important parameters which affect the analytical performance, also in LIPS. Self-absorption,13) line broadening and a strong background continuum are remarkable disadvantages of LIPS, especially when the plasma is generated under air ambient atmosphere, as reported by Sabbsabi and Cielo.14,15) The self-absorption of an analytical line frequently causes reversal in the emission intensity, which leads to a calibration curve having a significant curvature; as a result, the accurate determination is hardly carried out.16,17,18,19,20,21,22,23) Furthermore, it is generally difficult to determine an analyte element at minor concentration ranges, because the plasma is pulsating and thus gives large fluctuations in the emission intensity.
Argon has been employed as the plasma gas in LIPS most widely, compared to nitrogen, air, and the other noble gases, because it can be easily obtained at relatively low price. Furthermore, under the low pressure conditions, the self-absorption can be effectively reduced, and emission lines with minimum background can be measured. In particular, several emission lines are selectively enhanced in the case where singly-ionized argon can work as an energy donor, which would improve the accuracy of a calibration curve. The emission characteristics of copper and iron lines emitting from LIP have been discussed in our previous studies, when argon is employed as the plasma gas.24,25)
In the present work, we focus on the determination of copper in steel samples, because it is a typical tramp element containing in steel scraps. For this purpose, the intensity variations of iron emission lines as well as copper atomic lines were investigated in various experimental conditions in LIPS, in order to obtain the optimum operating parameters for the laser as well as the detection system, when argon was selected as the plasma gas. Several pairs of iron and copper emission lines were tested to improve the performance of the calibration curve.
2. Experimental
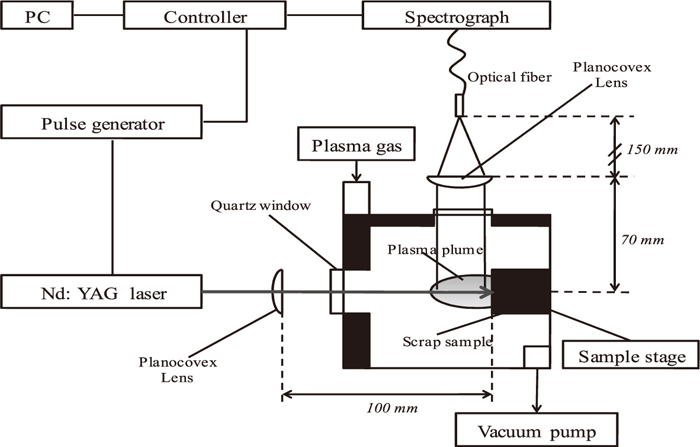
A schematic diagram of the experiment setup is shown in Fig. 1.24,25) The laser beam at a wavelength of 532 nm was generated by a Nd:YAG laser (LOTIS TII LS-2135, Tokyo, Japan. SHG mode). The energy of laser varying from 98 to 100 mJ/pulse was irradiated on a sample surface, and the repetition rate was set to be 10 Hz at a pulse duration of 10 ns. The laser energy was measured with a thermopile absorber head equipped with a laser power or energy monitor (OPHIR JAPAN 3A-P-CAL, NOVA, Tokyo, Japan). The laser beam was focused onto the sample surface with a planoconvex fused-silica lens having a 100-mm focal length. A high-purity iron plate (99.9%) was employed as the bulk sample. The emission signal was detected by an Echelle-type monochoromator (ME-5000, Andor, USA) equipped with an ICCD detector (DH-735, Andor, USA). After the surface was cleaned by laser irradiation for the first 10 s, the emission intensity was integrated for the next 25 s (during ca. 250 laser shots). An optical fiber for collecting the emission signal was set in front of the viewing window, so that a whole image of the plasma plume could be focused onto the entrance holder of the optical fiber with a planoconvex fused-silica lens having a focal length of 150 mm. The emission spectrum was obtained at delay times from 300 ns to 3000 ns when the gate width was fixed to be 1000 ns.
Three standard reference materials of iron-copper binary alloys, whose copper contents were 0.20, 0.50, and 1.0 mass%, were employed for making calibration curves. They were purchased from The Japan Iron and Steel Federation (standard reference materials for X-ray fluorescence analysis numbered FXS-350, 351, and 352). Pure argon (99.999%) was selected as the plasma gas, and the pressure was regulated with a needle valve after evacuating the chamber pressure down to 1.3 Pa. A Pirani gauge (GP-2, ULVAC Corp., Japan) and a capacitance manometer (MK 113B-2-P and 127AA-001003, NKS Instrument Inc., Andover, USA), which were installed between the evacuation port and a rotary vacuum pump (GLD-166, ULVAC Engineering Inc., Japan), were employed as pressure monitors.
3. Results and Discussion
3.1. Selection of Spectral Lines
The selection of spectral lines for both the analyte element (copper) and the reference element (iron) must fulfill the following principles in order to gain an analytical result with high reproducibility: first, both of the emission lines should have fairly strong intensities, but their resonance lines are not necessarily suitable to be selected, because the self-absorption may appear at the high concentrations; as the second requirement, both of the lines should be definitely free from any interference with other spectral lines; finally, the sensitivity of the spectrometer system can be sufficient so that the intensities of both the lines can be observed with good precision. A self-absorption effect occurs when the emission of analyte atoms is absorbed by the same kind of atoms in the ground state, resulting in reduction of the emission intensity. Therefore, a resonance line is not generally appropriate to be employed for the calibration curve, especially when the analyte concentration is high. However, the resonance line would not suffer from the self-absorption if the concentration is in an impurity level. In this research, two copper resonance lines at wavelengths of 324.754 nm and 327.396 nm, whose lower energy level is 3d64s 2S1/2 (0.0000 eV),26) were selected when considering the low content of copper in general steel materials as well as in the standard samples prepared. The Fe I 381.584-nm and the Fe I 382.043-nm lines, which are derived from de-excitation to the 3d74s 3F4 level (1.4849 eV) and the 3d74s 5F5 level (0.8590 eV),27) respectively, would not be affected by self-absorption, because these energy levels are less populated than the ground state of iron atom. The Fe II 276.750-nm line, assigned to the transition from the 3d64p 2I13/2 level (7.7234 eV) to the 3d64s 2H11/2 level (3.2447 eV),27) has fairly strong emission intensity. These iron lines were tested as the reference line to prepare a calibration curve for copper determination in steel samples. The assignment for the analytical lines is summarized in detail in Table 1.
Table 1. Assignment and configuration of copper and iron emission lines measured.
| Wavelength/nm | Assignment26,27) |
|---|
| Upper/eV | Lower/eV |
|---|
| Cu I 324.754 | 3.8166 | 3d104p 2P3/2 | 0.0000 | 3d104s 2S1/2 |
| Cu I 327.396 | 3.7858 | 3d104p 1P1/2 | 0.0000 | 3d104s 2S1/2 |
| Fe I 381.584 | 4.7331 | 3d74p 3D3 | 1.4849 | 3d74s 3F4 |
| Fe I 382.043 | 4.1034 | 3d74p 5D4 | 0.8590 | 3d74s 5F5 |
| Fe II 276.750 | 7.7234 | 3d64p 2I13/2 | 3.2447 | 3d64s 2H11/2 |
Important experimental parameters in LIPS for measuring the copper content in steel scraps are the gate width, the gas pressure and the delay time. In general, it is easier to determine the gate width; in this research, it was fixed to be 1000 ns to obtain sufficient emission intensity. The gas pressure and the delay time were both crucial experimental parameters to measure the emission lines of both copper and iron with a high signal-to-background ratio.
Figure 2 shows spectral scans of the Cu I 324.754-nm and the Cu I 327.396-nm lines at a delay time of 1000 ns, when argon pressure is varied from 130 to 2000 Pa. In this measurement, a pure copper plate was employed as the sample. Their emission intensities increase with increasing argon pressures up to 1000 Pa; however, further increase in the gas pressure causes a decrease in the emission intensity. The background intensity is almost constant when the gas pressure is varied from 130 to 1000 Pa, and the background level is raised at an argon pressure of 2000 Pa. The intensity variation with gas pressure could be explained from the following effect.6,24,25) With increasing the argon pressure in the plasma chamber, the probability for inelastic collisions becomes larger and thus the excitation of copper atom would be caused more actively, leading to the intensity increase of the copper emission lines. However, when the argon pressure becomes too high, the energy is consumed through gas-gas collisions, and thus the plasma would be shrunk and quenched, so that it cannot contribute to the excitation of copper atom.

The Nd:YAG laser generates a transient plasma, and thus the resulting plasma varies with a duration time after the breakdown. Therefore, the emission characteristics as a function of the delay time should be estimated to improve the precision and accuracy of the calibration curve.
Figure 3 shows spectral scans of LIPS using the iron-copper alloy sample (FXS-352, 1.0 mass% Cu), in wavelength ranges of 324–328 nm, 276–277 nm, and 381–382 nm, when the delay time is set to be 300 ns, 500 ns, 1000 ns, and 3000 ns, respectively. In this measurement, the argon pressure was maintained at 1000 Pa. It is found in Fig. 3 that the intensities of both copper and iron emission lines show large dependence on the delay time. The emission of Cu I 324.754 nm and Cu I 327.396 nm was observed at 500 ns, 1000 ns and 3000 ns, as shown in the left figure of Fig. 3. The intensities of Fe atomic lines became very weak at delay times of 300 ns and 3000 ns, as presented in the middle and right figures of Fig. 3. Because of their higher emission intensities as well as low background levels, the results obtained at 500 ns or 1000 ns were taken into account for preparing a calibration curve in the determination of copper in steel scraps. It was found from these results that an optimum experimental condition could be obtained at an argon pressure of 1000 Pa and at a gate width of 1000 ns, in combination with longer gate widths (1000 ns or more), not only to reduce the self-absorption but also to improve the sensitivity of the calibration curve.

In order to correct for variations in the sampling amount every laser shot, we needed to measure the intensity ratio of copper to iron emission lines in the standard reference samples. A calibration curve was acquired by fitting the intensity ratio against the atomic ratio for each line pair, where each plot was estimated from an average value for ten individual determinations.
Figure 4 shows typical calibration curves; as an example, the intensity ratio of Cu I 324.754 nm or Cu I 327.396 nm to Fe I 381.583 nm, against the atomic ratio of copper to iron at a delay time of 1000 ns. As presented in Fig. 4, the data plots generally followed each linear relationship with a positive slope value, although the plots at the atomic ratio of 0.0089 might slightly deviate downwards from the corresponding straight line, probably because of a weak self-absorption effect appearing in the resonance transition of Cu I 324.754 nm. There are several criteria in a calibration curve to estimate the analytical performance: a variance of the data point (error bar), a slope and an intercept of the calibration curve, and a regression coefficient of the linear relationship. The variance of the intensity ratio can be estimated from a relative standard deviation: a standard deviation divided by the corresponding average value. A regression coefficient closer to unity means more complete linearity of the calibration curve. In the case of Fig. 4, the relative standard deviation ranged from 9 to 15% for Cu I 324.754 nm and from 11 to 35% for Cu I 327.396 nm, which were almost independent of line selection for the reference line of iron but dependent on the net emission intensity of the copper lines. For the line pair of Cu I 324.754 nm, the regression coefficient was 0.9805 at a delay time of 500 ns and 0.9946 at a delay time of 1000 ns, whereas, for the line pair of Cu I 327.396 nm, it was 0.9364 and 0.9788, respectively. The slope of the calibration curve for Cu I 324.754 nm was larger than that for Cu I 327.396 nm, resulting from larger emission intensity of Cu I 324.754 nm; however, the intercept of the calibration curve was also larger in the case of Cu I 324.754 nm, possibly due to overlapping with a faint emission line of iron. This overlapping in some cases worsens the limit of detection due to fluctuations of the blank signal.

Table 2 summarizes the slope, the intercept and the regression coefficient of calibration curves for several line pairs: the intensity ratios of Cu I 324.754 nm or Cu I 327.396 nm to the reference lines of iron, such as Fe I 381.583 nm, Fe I 382.043 nm and Fe II 276.750 nm, at delay times of 500 ns and 1000 ns. Obviously, the Cu I 324.754-nm line is more suitable for the determination of smaller copper amounts compared to the Cu I 327.396-nm line, because of its larger emission intensity and thus larger slope values of the calibration curve. Generally, larger slope values and better regression coefficients were obtained at a delay time of 1000 ns rather than 500 s. The best linear relationship was obtained for a line pair of Cu I 324.754 nm/Fe II 276.750 nm at a delay time of 1000 ns, where the regression coefficient was 0.9991, while line pairs of Cu I 324.754 nm to Fe I 381.583 nm or Fe I 382.043 nm also gave linear relationships having a regression coefficient of 0.9946 or 0.9932. Therefore, these line pairs could be recommended for the analytical application.
Table 2. Parameters of calibration curve for several line pair of Cu/Fe at an argon pressure of 1000 Pa.
| Line pair | Delay time (ns) | Slope | Intercept | Regression coefficient |
|---|
| CuI 324.754/FeI 381.584 | 500 | 39.43 | 0.0928 | 0.9805 |
| 1000 | 40.18 | 0.0648 | 0.9946 |
| CuI 324.754/FeI 382.043 | 500 | 31.89 | 0.0449 | 0.9527 |
| 1000 | 33.95 | 0.0515 | 0.9931 |
| CuI 324.754/FeII 276.750 | 500 | 32.90 | 0.0890 | 0.9286 |
| 1000 | 71.25 | 0.0120 | 0.9991 |
| CuI 327.396/FeI 381.584 | 500 | 4.66 | 0.0116 | 0.9365 |
| 1000 | 9.92 | 0.0040 | 0.9788 |
| CuI 327.396/FeI 382.043 | 500 | 3.87 | 0.0097 | 0.9673 |
| 1000 | 8.26 | 0.0031 | 0.9823 |
| CuI 327.396/FeII 276.570 | 500 | 4.13 | 0.0111 | 0.9410 |
| 1000 | 18.37 | 0.0067 | 0.9855 |
Using the calibrational relation denoted in Table 2, the limit of detection could be estimated from an average value and the standard deviation of the intensity ratio when a pure iron sample was employed for the blank estimation. We defined the limit of detection as an atomic ratio corresponding to three times the standard deviation of an averaged intensity ratio in ten replicate measurements. When using optimized experimental parameters at the 1000-ns delay time, the limit of detection of the Cu I 324.754-nm line was an atomic ratio of 0.00069 for Fe I 381.583 nm, 0.00064 for Fe I 382.043 nm, and 0.00059 for Fe II 276.750 nm, respectively.
3.4. Actual Application to Steel Scrap
Finally, a piece of stainless steel scrap, which was obtained from a market for recycling, was measured using the LIPS to determine the copper content. The measurement was carried out at a delay time of 1000 ns and an argon pressure of 1000 Pa. Table 3 shows atomic ratios in this specimen determined for three line pairs of Cu I 324.754 nm; however, all of them were smaller than each atomic ratio corresponding to the limit of detection. Therefore, it should be concluded that the copper content in this stainless steel scrap is lower than a Cu/Fe atomic ratio of 0.00069 (the largest value of the limits of detection).
Table 3. Analytical results of copper content in a stainless steel scrap.
| Line pair | Observed Atomic Ratio | Limit of Detection Atomic Ratio |
|---|
| CuI 324.754/FeI 381.584 | 0.00055 | 0.00069 |
| CuI 324.754/FeI 382.043 | 0.00036 | 0.00064 |
| CuI 324.754/FeII 276.750 | 0.00007 | 0.00059 |
4. Conclusions
This study focused on a selection for the experimental parameters to conduct the quantitative analysis of copper in steel scraps by LIPS, where several criteria for a calibration curve, such as a slope, an intercept, and a regression coefficient, were estimated by using six pairs of copper and iron emission lines, when argon was employed as the plasma gas under low pressure conditions and a delay time for the measurement was varied. Emission lines of both copper and iron generally had higher intensities with lower background levels at an argon pressure of 1000 Pa compared to the other pressures. Even when the argon pressure was fixed to be 1000 Pa, the emission intensities were dependent on the delay time; the delay times of 300 ns and 3000 ns generally worsened the performance of the calibration curves for all of the line pairs, and therefore, calibrational relations should be estimated at delay times of 500 ns or 1000 ns. Our study could recommend that a line pair of Cu I 324.754 nm/Fe II 276.750 nm at a delay time of 1000 ns is the most suitable for the determination of copper in steel scraps.
Acknowledgments
This research is supported by a Grant-in-Aid from the Ministry of Education, Science, Sports and Culture of Japan (No. 23310049). Several parts of the optical apparatus were installed under a support of the A-STEP program in Japan Science and Technology Agency (No. 241FT0286).
References
- 1) T. M. Naeem, H. Matsuta and K. Wagatsuma: ISIJ Int., 42 (2002), 1318.
- 2) K. Kuzuya, M. Murakami and N. Maruyama: Spectrochim. Acta, Part B, 58 (2003), 957.
- 3) Y. Ushirozawa and K. Wagatsuma: Anal. Sci., 22 (2006), 1011.
- 4) Y. Iida: Spectrochim. Acta, Part B, 45 (1990), 1353.
- 5) T. L. Thiem, R. H. Salter, J. A. Gardner, Y. I. Lee and J. Sneddon: Appl. Spectrosc., 48 (1994), 4.
- 6) C. Kitaoka and K. Wagatsuma: Anal. Sci., 23 (2007), 1261.
- 7) C. Kitaoka and K. Wagatsuma: Anal. Sci., 24 (2008), 785.
- 8) T. M. Naeem, H. Matsuta and K. Wagatsuma: Spectrochim. Acta, Part B, 58 (2003), 891.
- 9) H. Matsuta and K. Wagatsuma: Appl. Spectrosc., 57 (2002), 1156.
- 10) H. Hakkanen, J. Houni, S. Kaski and J. E. I. Tommola: Spectrochim. Acta, Part B, 56 (2001), 737.
- 11) Y. Ushirozawa and K. Wagatsuma: Spectrosc. Lett., 38 (2005), 539.
- 12) L. Fornarini, F. Colao and R. Fantoni: Spectrochim. Acta, Part B, 60 (2005), 1186.
- 13) V. Lazic, F. Brrbini and R. Fantoni: Spectrochim. Acta, Part B, 56 (2001), 807.
- 14) M. Sabsabi and P. Cielo: Appl. Spectrosc., 49 (1995), 499.
- 15) M. Sabsabi and P. Cielo: J. At. Anal. Spectrom., 10 (1995), 643.
- 16) G. Gupta, B. Suri and A. Verma: J. Alloy. Compd., 509 (2011), 3740.
- 17) P. Stavropoulos, C. Palagas and G. Angelopoulos: Spectrochim. Acta, Part B, 59 (2004), 1885.
- 18) M. Garcimuno, M. Pace and G. Bertuccelli: Optics Laser Tech., 47 (2013), 26.
- 19) P. Bailey and E. Pungor: Anal. Chim. Acta, 64 (1973), 423.
- 20) A. Sarker, D. Alamelu and S. Aggarwal: Optics Laser Tech., 44 (2012), 30.
- 21) C. Davies, H. Telle and R. Montgomery: Spectrochim. Acta, Part B, 50 (1995), 1059.
- 22) M. Vieitez, J. Hedberg, O. Launila and L. Berg: Spectrochim. Acta, Part B, 60 (2005), 920.
- 23) S. Beatrice, A. David and A. Sylvestre: Spectrochim. Acta, Part B, 60 (2005), 479.
- 24) L. Zhang, S. Kashiwakura and K. Wagatsuma: J. Key Eng. Mater., 508 (2012), 331.
- 25) L. Zhang, S. Kashiwakura and K. Wagatsuma: Spectrosc. Lett., 46 (2013), 1.
- 26) C. E. Moore: NBS Circular, 467 (1952), 111.
- 27) J. Sugar and C. Corliss: J. Phys. Chem. Ref. Data, 14 (1985), 407.