Abstract
The formation of strain-induced ferrite was investigated in two low carbon steels and in a 0.036% Nb microalloyed low carbon steel at temperatures above the Ae3. Two distinct stages were observed, the first of which was characterized by the formation of Widmanstätten colonies with very fine plates of similar orientation. In the second stage, observed after further straining, the initial plates coalesced into polygonal ferrite grains. The transition from stage I to stage II was retarded by additions of carbon and niobium and slightly by an increase in strain rate. EBSD analysis revealed that the small misorientations (<1.5°) between Widmanstätten plates allow them to coalesce into grains. The 60° misorientations between some of the colonies suggest that they form from twinned regions of the parent austenite. A common characteristic of the polygonal grains is the presence of planar high angle boundaries, a feature inherited from the original Widmanstätten microstructure.
1. Introduction
When steel is deformed at elevated temperatures, the application of a stress as well as the high density of dislocations introduced can induce the γ-to-α transformation at temperatures appreciably above the Ae3, that is, in the nominally single phase regime.1,2,3,4) Yada and coworkers5,6,7) were the first to report the occurrence of dynamic transformation (referred to as DT in this work ) during the 1980’s. Later, in 2000, Yada et al.8) verified that the transformation is indeed dynamic by carrying out in-situ X-ray diffraction measurements on 0.096C–Fe–Ni and 0.29C–Fe–Ni alloys. In 2001, Ping9) et al. investigated the formation of strain-induced ferrite in a 0.16%C–0.2%Si–0.61%Mn steel and showed that the transformation could be induced at temperatures as high as 960°C (i.e. at Ae3 + 125°C). More recently, Basabe10,11) et al. reported that the addition of niobium to a low carbon steel retards both the forward dynamic transformation as well as the reverse static reaction. The current authors have also shown that DT ferrite nucleates in the form of Widmanstätten colonies that coalesce into polygonal ferrite grains as the strain is increased.12) Although a considerable increase in the understanding of the microstructure of the ferrite formed dynamically above the Ae3 has been achieved in the last three decades, more detailed analyses are necessary to better understand the characteristics of the nucleation and growth of such ferrite.
With the exception of the EBSD analysis reported by the present authors mentioned above,12) previous treatments have relied on conventional microscopy and etching techniques that did not reveal the very fine plate-like morphology of DT ferrite. This requires use of the electron backscatter diffraction EBSD methods employed in the present investigation in which the dynamic transformation behavior of three low carbon steels was determined. In what follows, we describe in detail the effects of strain and chemical composition on the microstructural evolution of DT ferrite.
2. Experimental Procedure
2.1. Torsion Testing
The chemical compositions of the three low carbon steels investigated here are given in Table 1, together with their orthoequilibrium and paraequilibrium Ae3 temperatures. The latter were determined by both the FACT13) and Thermo-Calc thermodynamic softwares.14) The thermomechanical treatments to which the steels were subjected are illustrated in Fig. 1 and described in Table 2. The specimens were heated in an argon atmosphere to which 5% H2 was added so as to minimize decarburization and oxidation. The first deformation was applied to condition the austenite and refine the grain size. In the second deformation, the specimens were deformed to strains of 0.25–2 so as to determine the effect of strain on the microstructure. After the second deformation, the samples were quenched in about 1 s, which has been shown to be rapid enough to prevent the static formation of polygonal ferrite and pearlite on cooling.15) Further details of the experimental procedure as well as the flow behavior are available elsewhere.10,11,16)
Table 1. Chemical composition (mass%) and equilibrium temperatures Ae
3.
| Steel | C | Mn | Si | Nb | Orthoequilibrium Ae3 (°C) | Paraequilibrium Ae3 (°C) |
|---|
| I | 0.06 | 0.30 | 0.01 | – | 877 | 870 |
| II | 0.09 | 1.30 | 0.02 | 0.036 | 836 | 820 |
| III | 0.21 | 1.30 | 0.24 | – | 822 | 808 |
Table 2. Thermomechanical schedules and specimen dimensions.
| Steel | Thermomechanical Schedule | Specimen diameter (mm) | Specimen length (mm) | Reference |
|---|
| I | a | 6.3 | 22.4 | 11 |
| II | a | 6.3 | 22.4 | 10 |
| III | b | 5 | 15 | 16 |
Optical microscopy, scanning electron microscopy and electron backscatter diffraction (EBSD) methods were employed to follow the microstructural evolution of DT ferrite. A Philips XL-30 FEG microscope with a TSL orientation imaging system was used for the SEM and EBSD observations. The experimental parameters were: acceleration voltage 20 KeV, working distance 15 mm, spot size setting No. 5, tilt angle 70° and the step size between measurements was between 10 and 25 nm. The OIMTM Analysis for Windows software from TSL was used to automatically process the EBSD information.
Cross-sections perpendicular to the longitudinal axis were cut from the deformed specimens and mounted in a conductive resin. Then, they were polished with silicon carbide paper and 5 micron colloidal silica. After polishing, the specimens were etched with a 2% nital solution.
In a torsion test, the strain in a solid cylindrical specimen varies linearly from zero along the axis to a maximum at the surface. As shown by Fields and Backofen,17) the shear stress, τ, is given by:
|
τ=(1/2π
r
3
)T(3+n+m)
| (1) |
where T is the torque, r the radius of the specimen, n the twist sensitivity coefficient and m the twist rate sensitivity coefficient. Here n and m are defined by the slopes of plots of log T vs. log
θ at a constant
θ
˙
and of log T vs. log
θ
˙
at a constant
θ, respectively, where
θ is the amount of twist in the specimen (radians).
At temperatures above 500°C, the average value of n is close to zero and m can be taken as approximately 0.3. These values lead to:
Note that
τ =
σ/√3, where
σ is the von Mises equivalent stress, so that,
The shear strain and equivalent strain are in turn given by
where L is the gauge length of the specimen.
It is evident from Eq. (4), that the strain is at a maximum at the surface of the specimen, while it is zero along the axis. The amount of dynamic transformation is therefore expected to be at a maximum at the outer surface and to decrease to zero along the radius.17,18) For this reason, the metallographic observations were carried out close to the surface at radii 0.8 times the outer radius.
3. Results
3.1. Steel 1
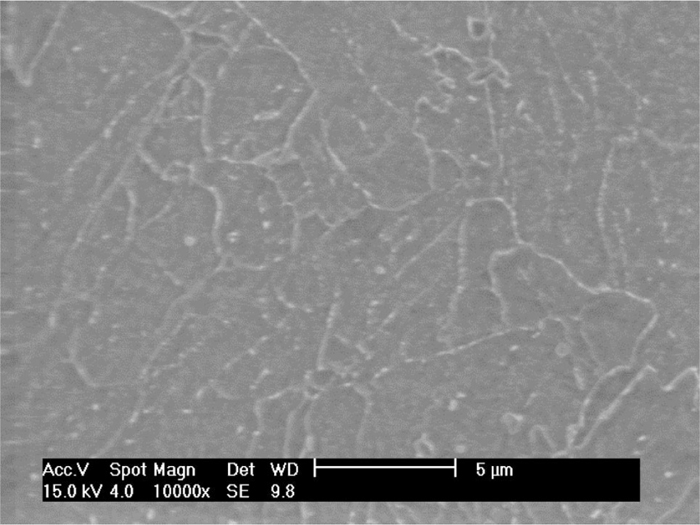
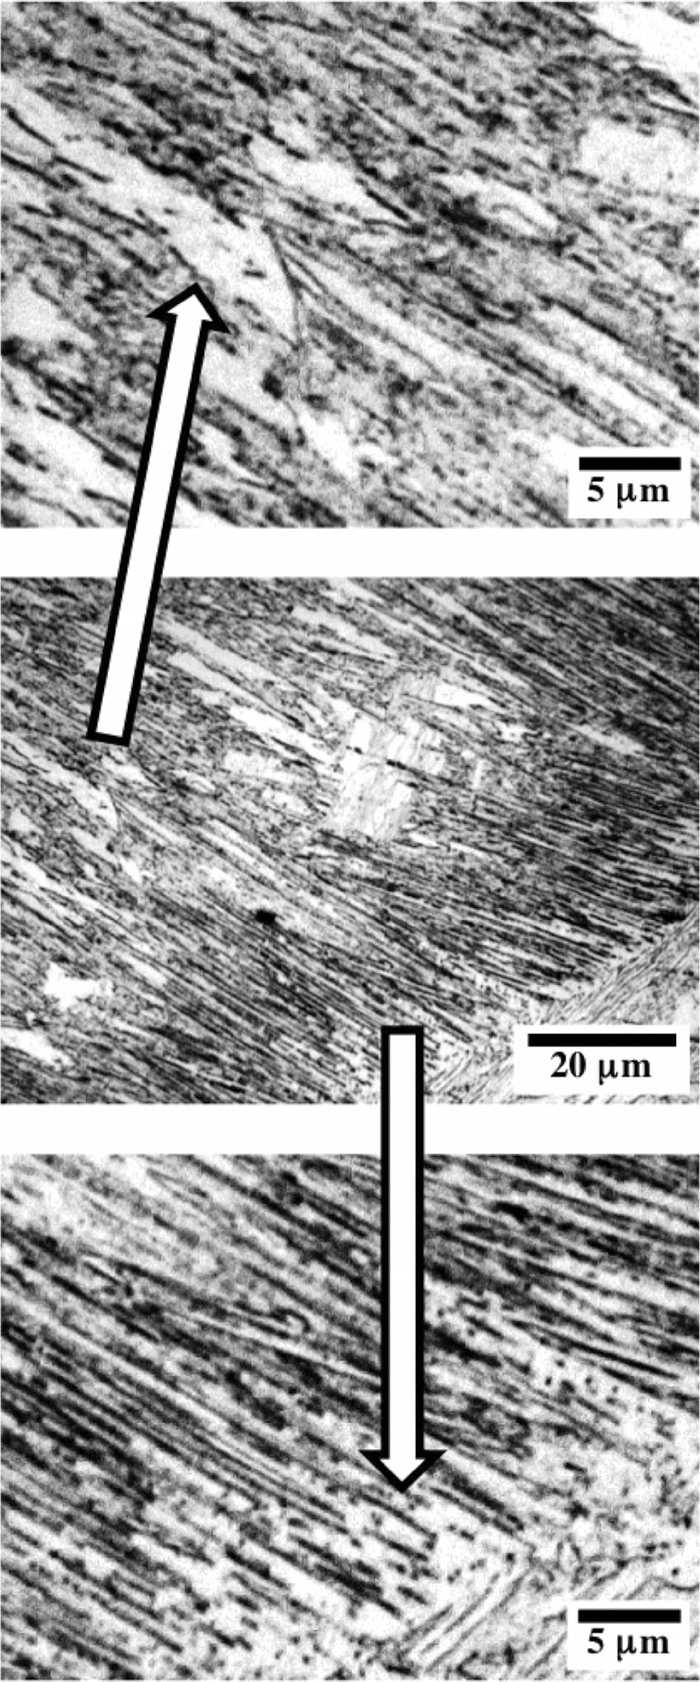
In all three steels, the strain-induced ferrite nucleated in the form of Widmanstätten colonies. The critical strain for the formation of DT ferrite in the 0.06% C steel was 0.08, as determined by the double differentiation method.19,20) A typical optical microstructure of a sample deformed to a strain of ε = 0.2 is illustrated in Fig. 2. It can be seen that DT ferrite has been nucleated both at the prior austenite grain boundary as well as within the grain. This type of microstructure is shown at higher magnification in Figs. (3(a), 3(b)). Note that these plates are about 300 nm wide and so are not detectable using optical methods. During formation of the plates, C is rejected into the remaining austenite,21) which is transformed into martensite on quenching. The distribution and morphology of the retained austenite (martensite after quenching) is illustrated in Fig. 3(c), where it can be seen that it is located at the grain boundaries and absent at the plate boundaries.
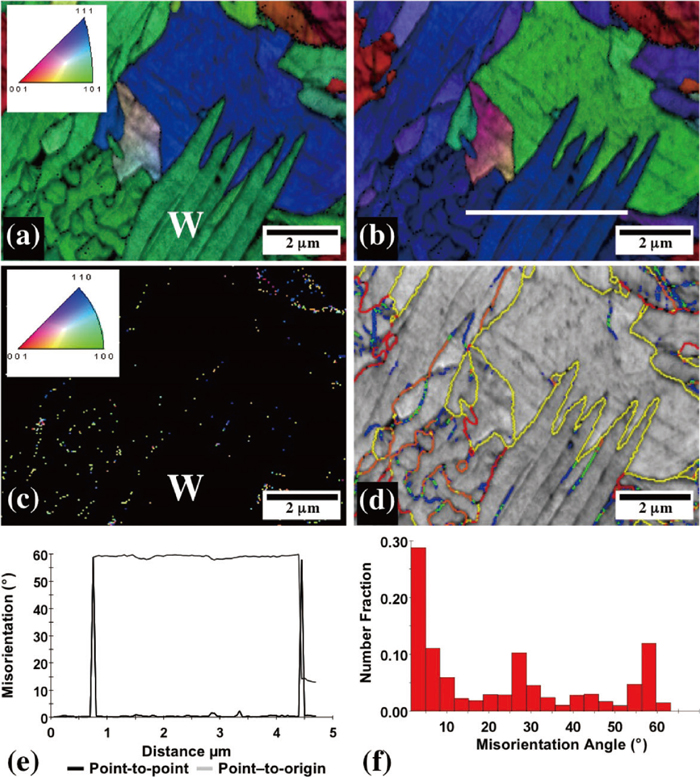
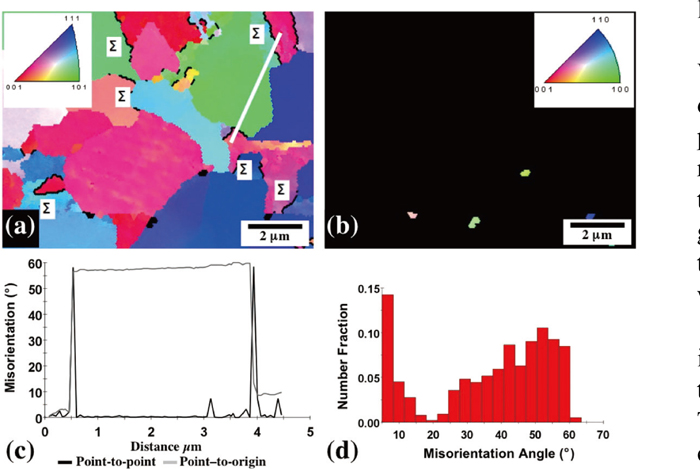
The Widmanstätten nature of these plates is seen to better effect in Fig. 3(d), where the small misorientations between the plates are shown in the IQ map. The blue boundaries have misorientations between 1.5° and 3° degrees whereas the absence of color represents a misorientation of less than 1.5 degrees. The lack of misorientation between the plates is also apparent from their uniform colors in Figs. (3(a), 3(b)). The similarity in orientation is a factor that permits the coalescence of the plates at larger strains, as discussed in more detail later. The presence of small twinned regions (see Fig. 3(e)) indicates that the parent austenite phase was twinned prior to transformation. The misorientation angle distribution of Fig. 3(f) is also consistent with the presence of plates of similar orientations and of twin boundaries.
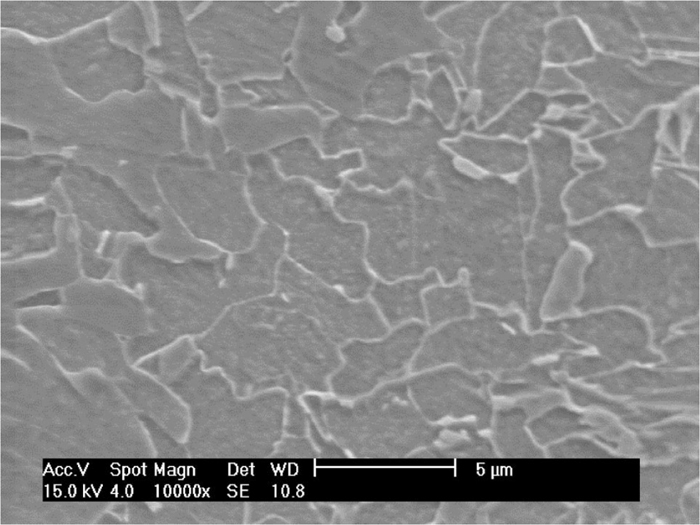
The results obtained at strains of 0.4, 0.8 and 1.2 are shown in Fig. 4. At a strain of about 0.2; the volume fraction of ferrite was about 20% and the ratio of plates to grains was about 1 (not shown here). As the strain was increased to 0.4, the volume fraction of ferrite increased to about 40% and the plate volume fraction decreased to about 3%. This signified that the initial plates had coalesced into grains, while new plates were continuing to be formed. Finally, at a strain of 0.8, no further plates were being formed and the ferrite microstructure was almost entirely polygonal. The IPF maps of Fig. 4 reveal the frequent presence of planar high angle boundaries. These were also reported by Yada and coworkers in a 0.14%C-0.33%Si-1.06%Mn steel.5) The presence of twinned regions was evident at all strains. An increase in strain rate from 0.4 to 4.5 s–1 resulted in a similar transition from plates to grains and after a strain of 0.5 the DT ferrite was mostly polygonal, see Fig. 5.

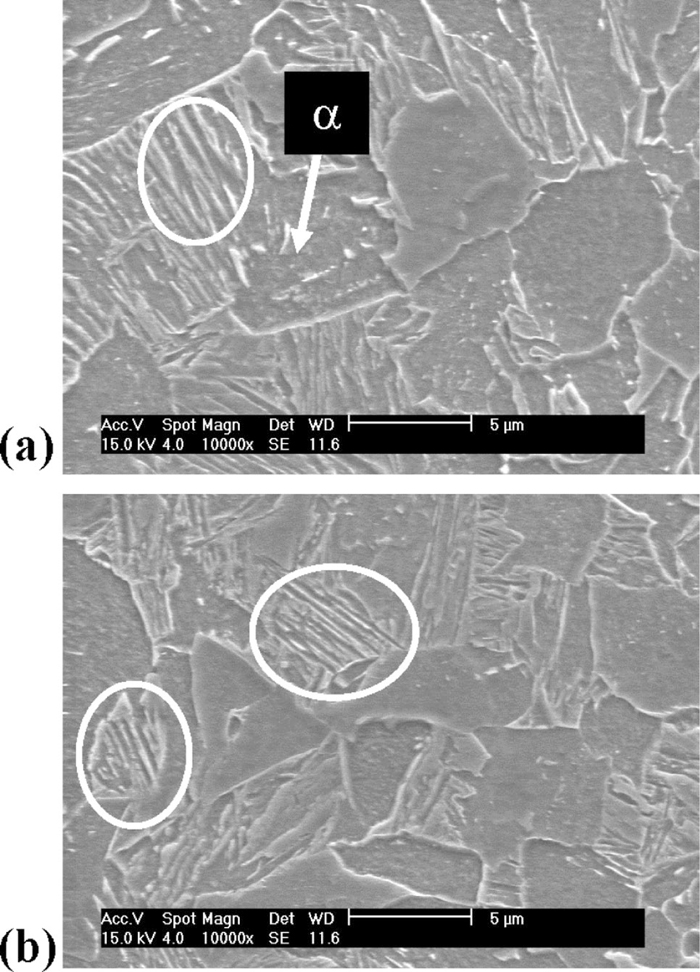
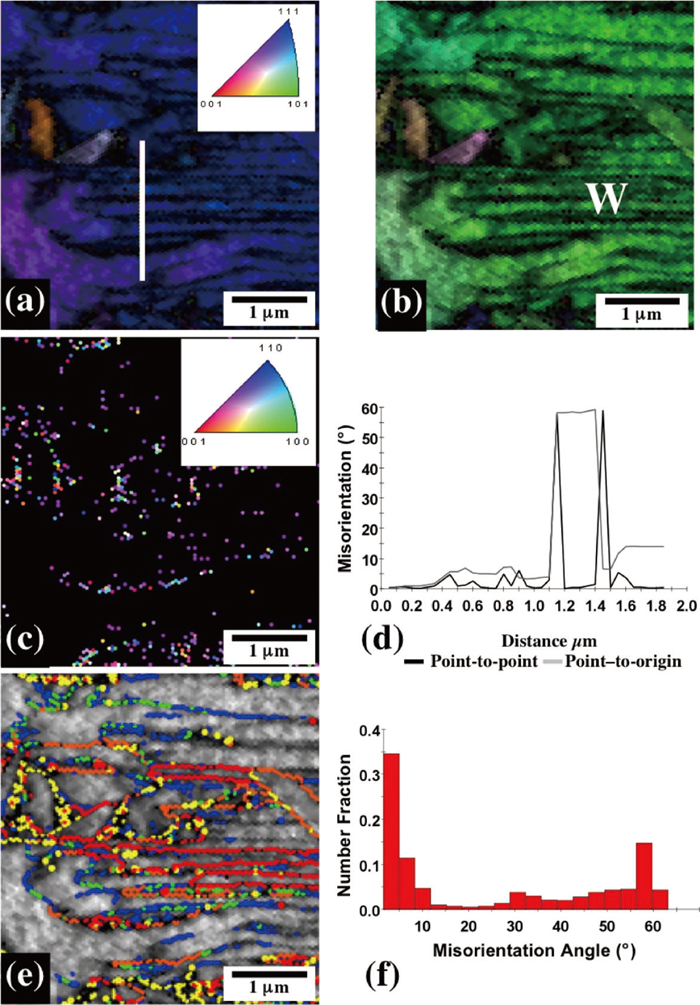
In this Nb-containing steel, the critical strain had increased to 0.17, as determined by the double differentiation method.19,20) As in the case of steel 1, the nucleation of DT ferrite took place at both austenite grain boundaries and within the grains. At a strain of 0.4, both Widmanstätten plates and polygonal grains were present (see Figs. (6(a), 6(b)); the plate:grain area ratio in this case was about 1. In contrast to the distribution of the martensite (prior austenite) in steel 1, here this phase was located at the plate boundaries, Fig. 6(c). As before, the ferrite plates within a Widmanstätten colony have similar orientations, with the exception of some twinned regions, Fig. 6(d). The small misorientations between the plates can be seen more clearly in the IQ map of Fig. 6(e). The blue and green boundaries are of low misorientation (θ < 5°), while the yellow ones are of misorientation (10° ≤ θ < 55°). It is also evident from the misorientation angle distribution of Fig. 6(f) that the plates have similar orientations and that twin boundaries are present.

An increase in the strain from 0.4 to 0.8 resulted in the conversion of many of the Widmanstätten plates into polygonal ferrite grains, Fig. 7, as reported in an earlier work.12) By increasing the applied strain to 0.8, the plate:grain area ratio was reduced to about 0.14. In contrast to Steel 1, in which plate formation was essentially complete at a strain of 0.4 (compare Figs. 3 and 7), Widmanstätten plates were still being formed. Thus it is evident that the addition of niobium increases the strain range over which plates are formed as well as the strain required for the plates to coalesce into grains. The martensite phase is distributed along the plate and grain boundaries, Fig. 7(c), while the Widmanstätten plates within a given colony have similar orientations (with the exception of the twinned regions), Fig. 7(d). As in the case of Steel 1, planar high angle boundaries were frequently observed, see Figs. (7(e), 7(f)).

At a strain of 1.2, DT ferrite was present almost entirely in the form of equiaxed grains, i.e. the transition from plates to grains was essentially complete, Fig. 8, although vestiges of the plates could still be detected. The presence of twinned regions and planar boundaries were common features in these microstructures. An increase in strain rate from 0.4 to 4.5 s–1 resulted in a similar transition from plates to grains and after a strain of 0.5 the DT ferrite was mostly polygonal, see Fig. 9.
3.3. Steel 3
The critical strain for the formation of DT ferrite in the 0.21% C steel was 0.14.19,20) As in the case of the previous steels, DT ferrite nucleated both at the grain boundaries and within the grains. At a strain of 0.4, the ferrite was present in the form of both Widmanstätten plates and grains, see Figs. (10(a), 10(b)). At this strain, the plate:grain area ratio was about 1.9. Note that the increase in carbon concentration has resulted in finer plates about 100–200 nm wide (compare Figs. (3(a), 3(b)) and (10(a), 10(b)). In this case, the martensite (prior austenite) was located both at the ferrite plate and grain boundaries, Fig. 10(c). The presence of twinned regions in the austenite is again evident, Fig. 10(d). The low misorientation between the plates is shown in the IQ map of Fig. 10(e). The relative frequencies of similarly oriented plates, high angle boundaries, and austenite twin boundaries are illustrated in the misorientation angle distribution of Fig. 10(f).
The results obtained at a strain of 0.8 are shown in Fig. 11. The plate:grain area ratio has now decreased to about 1. As in the microstructure corresponding to the lower strain, Widmanstätten plates of similar orientations are present, Figs. (11(a), 11(b)). The martensite distribution is depicted in Fig. 11(c), where it can be seen that it is located at both the plate and grain boundaries. The low misorientations associated with the Widmanstätten plates located along the white line in Fig. 11(b) are shown in Fig. 11(d). These are also apparent in the IQ map of Fig. 11(e) as well as the misorientation angle distribution of Fig. 11(f).
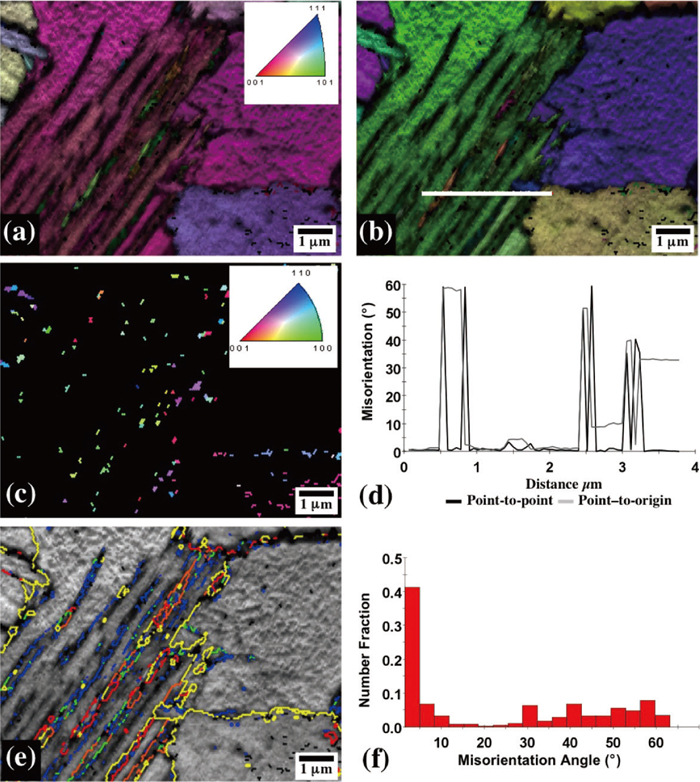
At a strain of 1.2, the plate:grain area ratio has decreased further to about 0.3. The misorientations between the plates are illustrated in Figs. (12(a), 12(b)) and the martensite phase distribution m Fig. 12(c). The low misorientations between the Widmanstätten plates are also evident from the misorientation profile of Fig. 12(d). The absence of color, i.e. of θ < 1.5°, in some of the plate boundaries in Fig. 12(e) explains why the plates were able to merge so readily during straining. The misorientation angle distribution Fig. 12(f) is consistent with the presence of plates of similar orientations and of twin boundaries, as in the previous steels.
A further increase in the strain from 1.2 to 1.6 resulted in a transition from a plate dominant microstructure into grain dominant one (plate:grain area ratio 0.17), with planar high angle boundaries and transformed twin regions (see Fig. 13).
4. Discussion
4.1. Microstructure
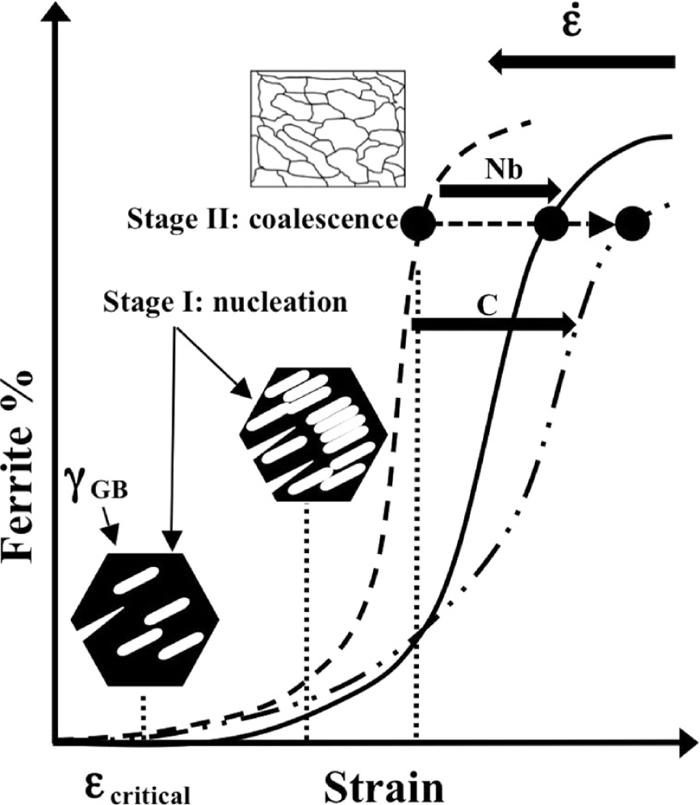
An interesting feature of the micrographs presented above is the gradual conversion of the Widmanstätten plate colonies into polygonal ferrite grains. This appears to be occurring continuously as follows: i) there are DT ferrite plates introduced with each increment of strain; ii) the new ferrite plates coalesce into grains and are replaced by the polygonal microstructure; iii) more plates are introduced and the cycle begins again.
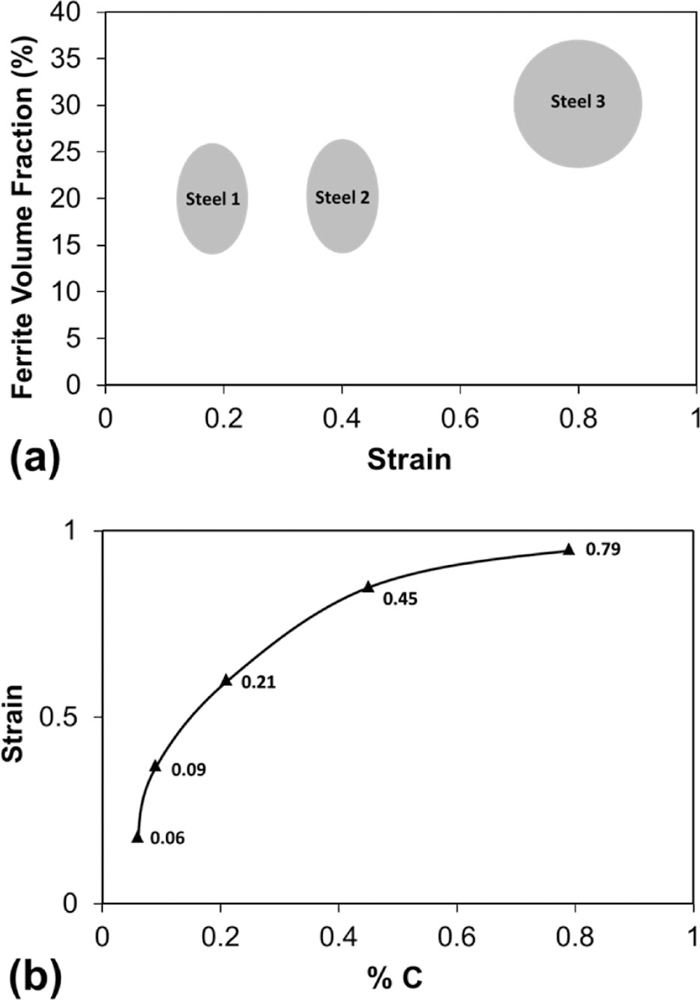
The present investigation has shown that DT ferrite first forms as very thin Widmanstätten plates and that these evolve into approximately equiaxed grains as the strain is increased. The continuous formation of new plates during dynamic transformation while others are coalescing into grains leads to the formation of a microstructure consisting of a mixture of both plates and grains. The effect of strain, strain rate and chemical composition on the ferrite volume fraction is depicted in Fig. 14(a). Here it can be seen that the volume fraction of ferrite increases with strain, as reported in previous publications.10,11,16) It also decreases with an increase in temperature above the respective Ae3. It is evident from Fig. 14(a) that more and more strain is required to form ferrite when the C content is increased while holding constant the temperature interval above the Ae3. This may be because the addition of C lowers the Ae3 temperature, leading to slower plate growth kinetics. The effect of the strain rate on the volume fraction of DT ferrite was small as reported previously.10)

The dependence on strain and strain rate on the ratio of ferrite plates to grains is illustrated in Fig. 14(b). As can be seen, the proportion of plates decreased with the strain. Steel 1 required the least strain to convert plates into grains, while plates were still present in Steel 3 at a strain of 1.6. The effect of strain rate on the transition from plates to grains was negligible. This indicates that the microstructural evolution of DT ferrite is related to strain rather than strain rate.
As shown above, the misorientations between the Widmanstätten plates were generally in the range 0 < θ < 1.5 degrees. During coalescence, the misorientations of the plates decreased with strain. The presence of twinned regions was common in all the steels and was observed over the entire strain range. After the transition from plates to grains, the initial twinned regions maintained their identities, so that the 60° misorientations between ferrite grains were retained on further straining.
The martensite phase (prior austenite) found on quenching was at the grain boundaries in Steel 1 and both between the plates as well as at grain boundaries in Steels 2 and 3. The absence of martensite between the plates in steel 1 is consistent with the thermodynamic analysis of Ref. 4), in which it is shown that C is only rejected during plate formation when the C level exceeds about 0.1%. Transmission electron microscopy5) and atom probe tomography15) revealed the presence of fine carbides on dislocations and at grain boundaries; however, due to their fine scale they could not be detected using the EBSD techniques employed in the present work.
4.2. Dynamic Transformation
The critical strain required to initiate dynamic transformation was about 0.08 in the 0.06% C steel and about 0.14 in the 0.21% C steel. In two other plain C steels tested recently,20,22) these strains were about 0.1 ± 0.03. It should be noted, however, that in the present Nb steel, the critical strain increased to 0.17. A similar effect was reported in the Nb steels of Ref 22). Thus it appears that Nb addition increases the critical strain for dynamic transformation, perhaps because of its strong solute drag effects.
4.3. Rate of Plate Coalescence
In the present work, the state of coalescence was followed by measuring the ratio of ferrite plates to grains; this was illustrated as a function of strain in Fig. 14(b). The strain at which half the ferrite was in plate form was also determined, as illustrated in Fig. 15(a). It can be seen that the volume fractions of both plate and polygonal ferrite increase slightly with C concentration. The effect of C level on the the amount of strain required for ferrite formation is shown in Fig. 15(b). Here, data determined on two additional steels are included to extend the C concentration range investigated. It is evident that higher C contents are associated with greater strains required for ferrite formation. This is because the low solubility of carbon in ferrite implies that, during plate formation, the carbon must diffuse to the plate boundaries and partition into the austenite or precipitate as fine carbides. This requirement will retard plate growth4) and also slow the transition from plate to polygonal ferrite. This can account for the observation that the volume fraction of DT ferrite at a given strain decreases as the carbon content is increased, Figs. 14(a) and 15(b).
The presence of austenite and of carbides at the plate boundaries renders coalescence more difficult. As shown above, martensite (previous austenite) was absent between the plates of the 0.06C steel, so that coalescence occurred relatively rapidly in this material. By contrast, the presence of martensite between the plates in the two higher C steels was responsible for the larger coalescence strains. The presence of austenite between the plates can have such a strong effect on preventing coalescence that, in Steel 3, Widmanstätten colonies are still present at a strain of 3, as shown in Fig. 16. The behavior described above is summarized for the convenience of the reader, in Fig. 17.
4.4. Industrial Implications
Recent strip mill simulations at McGill University have shown that dynamic transformation and dynamic recrystallization take place simultaneously under industrial rolling conditions.24) The present observations are indicative of the type of Widmanstätten ferrite that is likely to form in the roll bite. These plates are probably converted into grains as the steel passes through the mill. As the density of ferrite is lower than that of austenite, this indicates that, although the mass flow rate through the mill remains constant, the volume flow rate gradually increases as the bar passes through the mill. Thus, allowances should be made for the volume increase associated with ferrite formation in mill models.
5. Conclusions
Electron backscatter diffraction (EBSD) techniques were used to characterize the microstructures of steels undergoing dynamic transformation while being deformed above the Ae3. The results obtained can be summarized as follows:
(1) DT ferrite forms in two stages. In the first stage, colonies of Widmanstätten ferrite are nucleated at austenite grain boundaries and in the interiors of the grains. The misorientations between the plates are low, about 0° ≤ θ < 1.5. In a second stage, the plates coalesce into grains as straining continues. The transition from stage I to II is delayed by the addition of niobium or of carbon.
(2) The grains formed in the second stage are bounded by high angle boundaries, with misorientations θ ≥ 15°. These boundaries are often planar, an indication of the Widmanstätten nature of the original microstructure. This observation is in agreement with the work of Yada,5) who reported the presence of straight boundaries in their dynamically formed ferrite.
(3) The characteristics of the DT ferrite plates appear to be independent of the chemical composition. As the plates are only 100–300 nm wide, they are too narrow to be observable by conventional optical microscopy.
(4) The present study indicates that Widmanstätten ferrite is likely to form in strip mills and that these are probably transformed into polygonal grains before exit from the mill. The formation of ferrite during rolling increases the volume flow rate through the mill.
Acknowledgements
The authors are grateful to the Natural Sciences and Engineering Research Council of Canada for funding this work.
References
- 1) D. N. Hanlon, J. Sietsma and S. van der Zwaag: ISIJ Int., 41 (2001), 1028.
- 2) X. Sun, H. Luo, H. Dong, Q. Liu and Y. Weng: ISIJ Int., 48 (2008), 994.
- 3) C. Özgür: Master’s Thesis, Delft University of Technology, Netherlands, (2010).
- 4) C. Ghosh, V. V. Basabe, J. J. Jonas, Y. Kim, I. Jung and S. Yue: Acta Mater., 67 (2013), 2348.
- 5) H. Yada, Y. Matsumura and T. Senuma: Proc. of Int. Conf. on Martensitic Transformation, JIM, Sendai, Japan, (1986), 515.
- 6) Y. Matsumura and H. Yada: Trans. Iron Steel Inst. Jpn., 27 (1987), 492.
- 7) H. Yada, Y. Matsumura and T. Senuma: Proc. of 1st Conf. Physical Metallurgy of Thermomechanical Processing of Steels and Other Metals (THERMEC-88), ed. by I. Tamura, ISIJ, Tokyo, (1988), 200.
- 8) H. Yada, C. M. Li and H. Yamagata: ISIJ Int., 40 (2000), 200.
- 9) P. Yang, Y. Fu, F. Cui and Z. Sun: Acta Metall. Sin., 37 (2001), 601.
- 10) V. V. Basabe and J. J. Jonas: ISIJ Int., 50 (2010), 1185.
- 11) V. V. Basabe, J. J. Jonas and H. Mahjoubi: ISIJ Int., 51 (2011), 612.
- 12) V. V. Basabe, J. J. Jonas and C. Ghosh: Steel Res. Int., doi: 10.1002/srin.201200226.
- 13) C. W. Bale, E. Bélisle, P. Chartrand, S. A. Decterov, G. Eriksson, K. Hack, I.-H. Jung, Y.-B. Kang, J. Melançon, A. D. Pelton, C. Robelin and S. Petersen: Calphad, 33 (2009), 295.
- 14) B. Sundman, B. Jansson and J. O. Anderson: Calphad, 9 (1985), 153.
- 15) C. Ghosh, V. V. Basabe, J. J. Jonas, S. Yue and X. Y. Xiong: ISIJ Int., 53 (2013), 900.
- 16) V. V. Basabe, J. J. Jonas and C. Ghosh: Adv. Mater. Res., 409 (2012), 829.
- 17) D. S. Fields and W. A. Backofen: Proc. ASTM, 57 (1957), 1259.
- 18) G. A. Wilber, J. R. Bell, J. H. Bucher and W. J. Childs: Trans. TMS-AIME, 242 (1968), 2305.
- 19) C. Ghosh, V. V. Basabe and J. J. Jonas: Steel Res. Int., 84 (2013), No. 757, 490.
- 20) J. J. Jonas, F. Montheillet, L. Toth and C. Ghosh: Mater. Sci. Eng., A, in press.
- 21) A. Yamanaka, T. Takaki and Y. Tomita: Mater. Trans., 47 (2006), 2725.
- 22) J. J. Jonas, C. Ghosh, X. Quelennec and V. V. Basabe: ISIJ Int., 53 (2013), No. 1, 145.
- 23) V. V. Basabe and J. J. Jonas: unpublished data.
- 24) J. J. Jonas, V. V. Basabe, C. Ghosh and C. Aranas Jr.: Proc. of 5th Baosteel Biennial Academic Conf., Baosteel Corp., Shanghai, China, (2013), C1.

 ; 3 ≤ θ < 5
  ; 5 ≤ θ < 10
  ; 10 ≤ θ < 55
  ; 55 ≤ θ ≤ 60
  .
.