Abstract
The dislocation characteristics and subgrain size of cold-drawn pearlitic steels with different carbon compositions were analyzed using X-ray diffraction line profile analysis to determine the work-hardening mechanism, with particular focus on microstructural deformation resulting from the rotation of pearlitic colonies. Modified Williamson—Hall and modified Warren—Averbach methods, which use multiple diffraction profiles, were applied to evaluate the microstructural parameters of the ferrite phase. Although the dislocation density increased with an increase in the drawing strain, the subgrain size was almost constant up to a strain of about 0.7. It was also shown that the higher carbon composition in the pearlitic steels contributes to the refinement of subgrains of the ferrite phase and the accumulation of dislocations. Moreover, the single-line profile analysis was performed for the cementite powder, which was prepared by electrolytic extraction from the steel specimens. The thickness of the cementite lamellae decreased with increasing drawing strain, indicating that the decomposition of the cementite phase occurred at the low strain level of 0.7. On the basis of these microstructural parameters, the strengthening mechanism as a function of the strain level is discussed.
1. Introduction
Cold drawing is a typical process for producing wires and rods of full pearlitic steels in industrial applications. The cold-drawn pearlitic steels exhibit the highest tensile strength among steels, at levels over 5 GPa.1) This property originates from the periodic lamellae structure composed of soft ferrite and hard cementite phases in the steels. Although the elastic constants of the ferrite and cementite phases are comparable,2) the yield strength of cementite, typically 4 GPa,3) is significantly higher than the yield strength of ferrite. Consequently, plastic deformation takes place preferentially in the ferrite phase, and the deformed pearlitic microstructures have characteristic features that include not only fine pearlite colonies but also lamellar curvature, fault formation, and branching. Along with these microstructural deformations, large phase stresses arise as a consequence of the inhomogeneous plastic deformations with the deformation of the lamellae. According to previous studies of stress analyses using X-ray or neutron diffraction,4,5,6,7) the ferrite phase is subjected to a compressive residual stress in the drawn direction, whereas the cementite phase has a large tensile residual stress of about 1 GPa. These microstructural characteristics of the deformed pearlitic lamellae introduce high-density dislocations into the severely deformed ferrite phase. Considering that dislocations play an important role in the reinforcement of the pearlitic steels, the technological challenges in terms of further improvement of the mechanical properties of the pearlitic steels has led to quantification of the dislocations. In addition to the effect on the mechanical properties, dislocations also affect the decomposition of cementite and the dissolution of carbon into ferrite at high strain rates, owing to the interaction between the dislocations and carbon in cementite.8,9) Recent analysis using atom probe field ion microscopy revealed that cementite in the lamellae decomposes at a high strain rate, and Takahashi et al. suggested that the lattice defects in ferrite, induced by vacancies, dislocations, and boundaries attract carbon atoms.10) Further discussion on these interesting microstructural features of cementite, as well as on dislocations, requires quantitative characterization such as the measurement of dislocation density and thickness of cementite.
Despite extensive research on the microstructure of pearlitic lamellae using electron microscopy, the dislocations have not been sufficiently characterized mainly owing to the difficulty in characterizing the fine microstructure of thin cementite lamellae. As an exception, the dislocation density of ferrite for heavily deformed pearlitic steels was estimated on the basis of the distance of dislocation walls originating from geometrically necessary (GN) dislocations.9,11) Nonetheless, this method can only give the order of dislocation density, not a statistically significant value. In addition, dislocations except for the GN type were not considered in the estimation.
X-ray diffraction (XRD) has been often used to characterize the microstructure of crystalline materials. Line profiles of XRD are broadened, especially when the lattice is distorted by dislocations and/or the subgrain size is lower than several hundred nanometers. Several methods have been proposed to separate these two effects. The basic methods of line profile analysis are the Williamson–Hall12) and Warren–Averbach13) procedures, which are based on the peak breadths and the Fourier coefficients, respectively. These methods use two diffraction peaks of the same family of planes to obtain the subgrain size and mean-square strain of lattice. In the classical theory, the mean-square strain gives the dislocation density by assuming that the dislocations are randomly distributed.14) However, the evaluation of dislocations from the line profiles is not so simple because of complex dislocation characteristics such as the dislocation strain field, which depends on the dislocation arrangements, the anisotropic strain broadening of the line profile, and the dislocation type, i.e., whether screw or edge. Ungár et al. addressed this problem and proposed modified Williamson–Hall and modified Warren–Averbach procedures, which analyze multiple diffraction peaks by introducing the contrast factors of dislocations.15,16,17) Various alloys of face-centered cubic, body-centered cubic, and hexagonal close-packed structures have been investigated with these procedures,18,19,20) and the validity of the microstructural parameters from the line profile analysis has been verified by comparing the results with the values estimated from the direct imaging using transmission electron microscopy.21) Apart from dislocation density, this method yields microstructural parameters such as the outer cut-off radius of dislocations and the subgrain size. Therefore, it is interesting to evaluate the microstructure of ferrite in the deformed pearlitic steels using this method. On the other hand, the application of line profile analysis to cementite is challenging because the crystal structure of cementite is orthorhombic and many diffraction peaks overlap with each other. In this case, single-line profile analysis with a specific diffraction peak seems to be a possible approach. Although the single- line profile analysis cannot give exact values of the microstructural parameters, the simple analytical procedure can provide information on relative changes in the microstructural parameters as a function of characteristics such as the composition of the alloys and the strain employed.
In this study, we analyzed the microstructures of drawn pearlitic steels with different strains mainly by using XRD line profile analysis. The strain-induced evolution of the dislocation characteristics and the effect of carbon composition on the microstructural parameters were analyzed. On the basis of the dislocation density, a strengthening mechanism in force during drawing will be discussed. Additionally, the crystallite size of cementite was investigated to determine the effect of carbon composition and dislocation density on the thickness of the lamellae.
2. Experimental
Straight rods of pearlitic steel with carbon compositions of 0.73 mass% and 0.84 mass%, referred to as 73C and 84C, respectively, around the eutectoid point were used for this research. The chemical compositions of the steels are listed in Table 1. The rods were cold drawn at two drawing strains up to about 0.7, and a summary of the strain and mechanical properties are listed in Table 2. These specimens were supplied by Tokyo Rope Mfg. Co., Ltd. For the XRD measurements, the rods were cut perpendicular to the axial direction. The resulting cross sections of the specimens were first mechanically polished and then electropolished in an acetic acid-20 vol% perchloric acid solution to eliminate the machining damage done to the cross-section surface.
Table 1.
Chemical composition (mass%) of steels used in this investigation.
| Steel |
C |
Si |
Mn |
P |
S |
| 73C |
0.73 |
0.19 |
0.50 |
0.021 |
0.007 |
| 84C |
0.84 |
0.21 |
0.75 |
0.021 |
0.005 |
Table 2.
Summary of strain and mechanical properties of the steel specimens.
| Steel* |
Diameter (mm) |
Total reduction (%) |
True strain |
Tensile strength (MPa) |
Elongation (%) |
| 73C |
5.00 |
17.3 |
0.19 |
1194 |
2.41 |
| 4.05 |
45.8 |
0.61 |
1370 |
2.38 |
| 84C |
4.05 |
22.5 |
0.25 |
1412 |
2.31 |
| 3.20 |
51.6 |
0.73 |
1584 |
2.15 |
* The initial diameters of 73C and 84C were 5.50 and 4.60 mm, respectively.
The XRD measurements for the line profile analysis were performed in Bragg–Brentano (2θ–θ) geometry using an X-ray diffractometer equipped with a Cu Kα radiation source; and X-rays were generated at 40 kV and 40 mA. Because X-ray scattering of white X-rays and the Cu Kα2 component distorts the line profile, incident X-rays were monochromated to the Cu Kα1 line (0.15406 nm) with a Johansson-type monochromator of quartz-101 reflection. A physical (specimen) line profile, which includes structural imperfection effects, should be deconvoluted from the measured line profiles. Therefore, in the present study, instrumental line profiles were obtained from diffraction peaks of an annealed high-purity (99.99%) iron plate, and the Stokes method22) was used for the deconvolution. The analysis of the physical line profiles of ferrite in the pearlitic steels was based on the modified Williamson–Hall and Warren–Averbach procedures, which were presented by Ungár et al.15,16,17) According to their theory, a nonmonotonic increase in line broadening with increasing diffraction order is explained as strain anisotropy caused by dislocations. The modified Williamson–Hall equation is expressed as follows:
|
ΔK=1/D+
π
B
2
b
2
/2
⋅
ρ
(
K
⟨ C ⟩
1/2
)
+O
(
K
⟨ C ⟩
1/2
)
2
,
| (1) |
where
K = 2sin(2
θ/2)/
λ and Δ
K = Δ2
θ·cos(2
θBragg/2) /
λ. In
Eq. (1), Δ2
θ and
θBragg are the integral breadth and Bragg angle, respectively;
ρ and
b are the dislocation density and the Burgers vector, respectively;
B is a parameter depending on the outer cut-off radius of the dislocations; and
O stands for a higher-order term in
K〈
C〉
1/2. The variable 〈
C〉 is a dislocation contrast factor that depends on the relative orientations between the Burgers and line vectors of dislocations and the diffraction vector:
|
⟨ C ⟩=⟨
C
h00
⟩(1-q
H
2
),
| (2) |
where
H2 = (
h2k2 +
h2l2 +
k2l2)/(
h2 +
k2 +
l2)
2 for
hkl reflections in a cubic crystal and
q is an experimentally obtainable parameter that depends on the characteristics of the dislocations in the crystal. The value 〈
Ch00〉 can be determined from the three elastic constants,
c11,
c12, and
c44 in the cubic system.
17) The value 〈
C〉 is determined by carrying out the modified Williamson–Hall analysis. To estimate the dislocation density and the outer cut-off radius, a further calculation of the line profiles is required using the modified Warren–Averbach method:
|
ln A(L)≅ln
A
S
(L)-(π
b
2
/2)⋅ρ
L
2
⋅
ln (
R
e
/L)(
K
2
⟨ C ⟩)+
O
′
(
K
2
⟨ C ⟩)
2
,
| (3) |
where
Re and
L are the effective outer cut-off radius of dislocations and the Fourier variable, respectively;
AS is the size Fourier coefficient; and
O′ stands for a higher-order term in
K2〈
C〉. Consequently,
ρ and
Re can be obtained by analyzing
A(
L) with
Eq. (3). Furthermore, a dislocation arrangement parameter
M=
R
e
ρ
is determined using the values of
ρ and
Re.
M parameters that are smaller or larger than unity indicate a strong or weak dipole character of the dislocation, respectively.
23) With these analytical procedures, the values relating to dislocations in the ferrite phase in the pearlite microstructure can be obtained.
However, the modified procedures do not cover the orthorhombic structure of cementite. Moreover, most of the diffraction peaks from cementite either overlap or are located close to each other. Therefore, line profile analysis using multiple peaks is not realistic. A compromised XRD analytical procedure is a single-line analysis. Although several methods have been proposed to analyze a single-line profile, we applied the de Keijser method,24) which can separate the size effect from the microstrain effect. In the de Keijser method, a diffraction peak is fitted with a Voigt function. It is assumed that Lorentzian and Gaussian components of the Voigt profile are due to the crystallite size and strain, respectively. The apparent crystallite size Dcementite and microstrain ε is given by
|
D
cementite
=λ/
β
L
cosθ,
| (4) |
where
βL and
βG are the breadths of the Lorentzian and Gaussian components, respectively. We adopted this method for discussing relative changes in these structural parameters with carbon compositions and area-reduction rates. It should be mentioned that the diffraction intensity of the cementite phase from pearlite specimens was considerably weak. Therefore, the cementite powder was prepared especially for the XRD measurements by electrolytic extraction in a solution of 10% acetylacetone–1% tetramethylammonium chloride–methanol (10%AA–1%TMAC–MeOH). To suppress the damage to cementite in the extraction process, the electrolytic extraction was carried out at –100 mV
vs. a saturated calomel electrode at 293 ± 2 K.
25) The cementite powder was separated from the solution by filtration through a membrane filter with a pore size of 0.05
μm. Meanwhile, the specimen for scanning electron microscopy (SEM) observation was prepared from the specimen cut along the axial direction and etched electrically in a 10%AA–1%TMAC–MeOH solution. The morphology of the pearlitic lamellae was observed in the etched specimens by SEM operated at 25 kV with the etched specimens.
3. Results and Discussion
3.1. Morphology of Pearlitic Lamellae
Figure 1 shows the microstructures of 73C and 84C in the longitudinal section of rods at different strains. Owing to the dissociation of the ferrite phase by electroetching in the 10%AA–1%TMAC–MeOH solution, the cementite lamellae were clearly observed. Although the directions of the pearlitic lamellae were not strongly oriented along the drawing direction at strains of 0.19 and 0.25 for 73C and 84C, respectively, the cementite lamellae did align to the drawing direction at higher strains. It should be mentioned that the drawing strains of 0.61 and 0.73 for 73C and 84C, respectively, are regarded as low strain levels for the pearlitic steels. Therefore, the rotation of the pearlitic lamellae in colonies is considered to be the dominant deformation mode up to these strains. Since the rotation of the colonies is associated with the substantial distortion of the pearlitic lamellae, it is expected that high densities of dislocations would be introduced into the ferrite phase.

The mechanical properties of deformed pearlitic steels are dominated mainly by the refinement of the ferrite phase and dislocation storage. In other words, the subgrain size and dislocation density of the ferrite phase is essential for understanding the work-hardening mechanism of drawn pearlitic rods. Therefore, these microstructural parameters were analyzed using XRD line profile analysis.
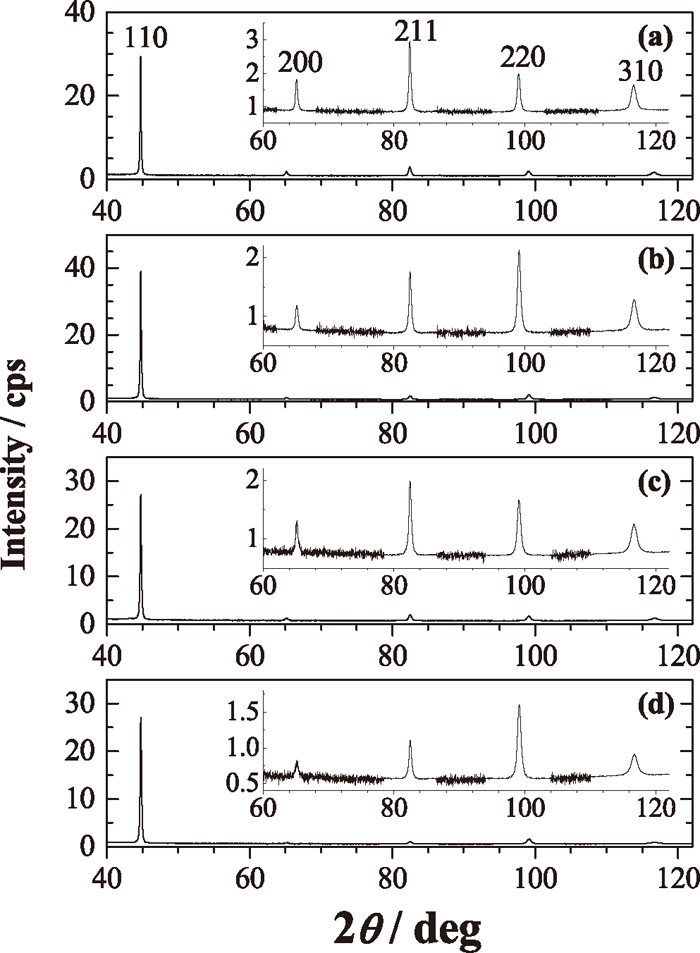
XRD patterns of 73C and 84C were obtained from 110 to 310 reflections, as shown in Fig. 2. Because the diffraction intensity of the 200 reflection for 84C was rather weak for obtaining the exact shape of the line profile, the 200 reflection for 84C was excluded from this analysis. As an example of the variation of line profile with the strain, the line profiles of 73C at strains of 0.19 and 0.65 are compared in Fig. 3. The horizontal axis is expressed in reciprocal units K – KB (= 2sinθ/λ – 2sinθB/λ), where θB is the Bragg angle. The instrumental profile obtained from an annealed iron plate is also shown in the figure. Generally, the deconvolution with the Stokes method becomes unstable and inaccurate when the broadening of the measured profile is comparable to instrumental broadening. Compared to the breadth of the instrumental profile, that of the measured profile is more than 4 times larger, which allows for a reliable deconvolution of the physical profiles. The breadths of the measured profiles increased with increasing strains from 0.19 to 0.61, indicating that microstructural defects such as dislocations and subgrains developed with increasing strain. It is noteworthy that the breadth of the 200 reflection is larger than that of the 211 reflection. According to the classical Williamson–Hall theory, the strain-induced broadening of a line profile increases with the reflection index.12) This contradiction is caused by the strain anisotropy explained by Eq. (2). The 200 reflection tends to have a higher contrast factor than other reflections, as determined from Eq. (2), indicating that the 200 reflection is sensitive to lattice strain caused by dislocations. Therefore, the distinct broadening of the 200 reflection, which can be ascribed to the strain anisotropy, needs to be corrected through the modified Williamson– Hall method.

The integral breadths of the physical profiles corresponding to 73C and 84C, which were deconvoluted from the measured profiles, are plotted in the classical Williamson–Hall plot as a function of K in Fig. 4. The data in the plots deviate from a smooth curve, indicating the presence of strain anisotropy. The modified Williamson–Hall plots of the integral breadths for 73C and 84C are shown in Fig. 5. The data follow smooth curves that were fitted according to Eq. (1). The slope of the fitted curve increased with an increase in the strain in both 73C and 84C. Because the slope in Eq. (1) contains the parameters of dislocation density and outer cut-off radius of dislocations, the increase in the slope with the increase in strain indicates that the lattice distortion was enhanced by the increase in these dislocation parameters. However, the contribution of each of these dislocation parameters cannot be separated using the plots in Fig. 5. Therefore, the modified Warren–Averbach procedure was carried out to analyze the dislocation characteristics in detail.

Using the Fourier coefficients of the line profile, a modified Warren–Averbach plot is analyzed. Figure 6 shows an example of the analysis for 84C at a strain of 0.25. The fitted curves give the intercepts and initial slopes X(L). The intercepts provide the size coefficient AS(L), as shown in Fig. 7. The intercept of the straight line fitted to the data provides the subgrain size at AS(L) = 0. From Eq. (3), X(L) is evaluated according to the equation:
|
X(L)/
L
2
=-ρ(π
b
2
/2)ln
R
e
+ρ(π
b
2
/2)lnL.
| (6) |
Figure 8 shows the plot of X(L)/L2 as a function of lnL. The dislocation density and outer cut-off radius of dislocations are obtained by fitting the plot with a linear line.
The parameters relating to subgrain and dislocations are summarized in Table 3. The subgrain size is almost constant regardless of strain, whereas the subgrain size decreases with an increase in the carbon composition. This indicates that the refinement of ferrite subgrains did not progress in this strain range. It is deduced that the subgrains formed at the beginning of deformation would be stable up to this strain range, and the difference in subgrain size between 73C and 84C may be correlated to the thickness of the ferrite lamellae. It should be mentioned that work-hardening due to grain size effects is likely to be minimal in this strain range.
Table 3.
Subgrain size
dSG, dislocation density
ρ, outer cut-off radius of dislocations
Re, and dislocation arrangement parameter
M for 73C and 84C.
| Steel |
Strain |
dSG (nm) |
ρ(1015 m–2) |
Re (nm) |
M |
| 73C |
0.19 |
69 |
2.7 |
8.1 |
0.42 |
| 0.61 |
70 |
4.1 |
7.6 |
0.48 |
| 84C |
0.25 |
55 |
3.8 |
6.8 |
0.42 |
| 0.73 |
53 |
5.5 |
6.5 |
0.48 |
The dislocation density was found to be on the order of 1015 m–2, and it was found to increase with the increase in the strain. It should be noted that the dislocation density of 84C was higher than that of 73C at any strain level, probably because 84C has a higher concentration of interstitial carbon in the ferrite phase than does 73C. On the other hand, the outer cut-off radius of dislocations decreased with the increase in strain. It is physically more appropriate to use the dimensionless parameter
defined by Wilkens as the dislocation arrangement parameter.
23) The value of
M gives the strength of the dipole characteristics of dislocations. If
M is small or large, the dipole characteristics and the screening of the displacement field of dislocations are strong and weak, respectively. Typically,
M > 1 indicates that dislocations are randomly distributed, while
M < 1 indicates the development of dislocation dipoles. The
M values in
Table 3 were between 0.4 and 0.5, regardless of the carbon composition and strain level, suggesting that the dipole character is strong and that the evolution of dislocation dipoles is almost independent of the concentration of interstitial carbon and the dislocation density.
3.3. Decomposition of Cementite
The aim of carrying out XRD measurements for the cementite phase is to quantify the partial decomposition of cementite caused by the drawing process. The XRD patterns of cementite powder extracted from 73C and 84C specimens are shown in Fig. 9. The XRD patterns have numerous peaks, and most of the peaks mutually overlap. This is why the line profile analysis based on multiple peaks is difficult to carry out for a cementite sample. On the other hand, whereas the 122 reflection around 52° is weak, the reflection is isolated from other peaks. Thus, single-line profile analysis was performed using the 122 reflection. It should be mentioned that the representative crystallographic orientation relationship at the interface between cementite and ferrite is (–103)cementite//(110)ferrite,26) which suggests that the angle between the <122>cementite direction and the thickness direction of cementite is about 50°. On the basis of this orientation relationship and the crystallite size along the <122>cementite direction, the thickness of cementite lamellae can be estimated.
To separate the 122 reflection from adjacent peaks, the diffraction pattern was fitted with a Voigt function, as shown in Fig. 9. Consequently, the values of βG and βL in Eqs. (4) and (5) , respectively, were obtained. Because the value of βG for all samples was estimated to be negligible, the crystallite size was estimated only from βL with Eq. (4). The value of βL, the crystallite size, and the thickness of cementite lamellae are summarized in Table 4. It is found that the thickness of cementite lamellae decreases with increasing strain. This is consistent with the results of the study using atom probe field ion microscopy, which showed that the cementite phase of pearlitic steels is decomposed with an increase in strain.10) It should be mentioned that the singleline profile analysis gives only an approximate value because of the rough theoretical assumptions. However, it can be safely said that we can discuss the ratio of change in the thickness. The decrease in the thickness of the cementite lamellae, which was promoted by plastic deformation, is estimated to be about 10% in both 73C and 84C. According to Table 2, the reduction in cross section in 73C (reduction in diameter from 5.0 to 4.05 mm) and that in 84C (reduction in diameter from 4.05 to 3.20 mm) are about 20%. Therefore, the corresponding decrease in the thickness of cementite is about half of the area reduction. This suggests that the decomposition of cementite is less likely to proceed in proportion to deformation up to strain levels of 0.7.

Table 4.
βG of Voigt function fitted to 122 reflection of cementite, crystallite size
Dcementite estimated from the 122 reflection, and thickness
tcementite of the cementite lamellae for 73C and 84C.
| Steel |
Strain |
βG/deg |
Dcementite/nm |
tcementite/nm |
| 73C |
0.19 |
0.51 |
18.9 |
12.3 |
| 0.61 |
0.58 |
16.6 |
10.8 |
| 84C |
0.25 |
0.54 |
17.6 |
11.4 |
| 0.73 |
0.63 |
15.2 |
9.9 |
The strengthening mechanisms of drawn pearlitic steels are explained by using the linear additive of the contributions of microstructural parameters:11)
|
σ(ε)=
σ
0
+
σ
d
(ε)+
σ
ρ
(ε)+
σ
SS
(ε),
| (8) |
where
σ(
ε) is the flow stress at a drawing strain of
ε,
σ0 is the friction stress of pure ferrite,
σd(
ε) and
σρ(
ε) are the strengthening relating to grain refinement and dislocations, respectively, and
σss(
ε) is the solid solution hardening relating to carbon concentration in the ferrite phase.
Generally, σd(ε) is expressed by the equation:27)
|
σ
d
(ε)=
K
HP
d
G
-1/2
,
| (9) |
where
KHP and
dG are the Hall–Petch constant and average grain size, respectively. Balogh
et al. proposed that the subgrain size
dSG should be used instead of
dG.
28) They introduced the Hall–Petch constant
K
SG
HP
, which is associated with the subgrain size, into the equation and successfully evaluated the strengthening contribution of deformed alloys. Thus, it is acceptable to use the subgrain size obtained from line profile analysis to evaluate the contribution of
σd(
ε). According to
Table 3, the subgrain size was almost independent of strain level. Therefore, the contribution of
σd(
ε) is negligible in the present investigation.
With the assumption of dislocation hardening, σρ(ε) can be expressed as29)
|
σ
ρ
(ε)=
M
T
αGb
ρ
1/2
,
| (10) |
where
MT is the Taylor factor (3),
30) α is a constant (0.24),
11) G is the shear modulus of ferrite (77.5 GPa), and
b is the Burgers vector (0.248 nm). The increments in
σρ(
ε) between the two strains are summarized in
Table 5, together with the increments in tensile strength. It should be mentioned that the dislocation hardening expressed by
Eq. (10) should be compared to yield strength in a straightforward manner. However, the yield strength of the pearlitic steels used in this study was not available. On the other hand, because the elongation of all specimens was consistently small, about 2% as shown in
Table 2, the increment in the tensile strength between the two strains is expected to be close to that of the yield stress. In addition, it has been reported that the difference between the tensile strength and yield stress of pearlitic steels tends to be comparable among the steels given different pretreatments.
31) Therefore, it is reasonable to use the increment in tensile strength with strain for discussing the work hardening of the present specimens.
Table 5.
Increments in tensile strength
ΔTS and dislocation strengthening
Δσρ between the low and high strains for 73C and 84C.
| Steel |
ΔTS (MPa) |
Δσρ(MPa) |
| 73C |
176 |
164 |
| 84C |
172 |
156 |
The increment in tensile strength in Table 5 is comparable to the increase in the dislocation hardening. Because the values of MT and α are based on data in literatures, the resultant values in Table 5 are somewhat ambiguous. However, it can be safely said that the principal hardening mechanism of the pearlitic steels is dislocation hardening up to the strain level of about 0.7. Consequently, the contribution of solid-solution hardening seems to be insignificant. This is consistent with the results of a previous study, which deduced that the dissolved carbon exceeding a certain super-saturated concentration would be located in vacancies or lattice defects, resulting in a weak effect on solid-solution hardening.10) Moreover, it can be deduced that the decomposition of cementite may lead to the loss of the strength of the material. As a result, the dissolution of cementite into the ferrite phase would apparently generate a fractional effect on the solid-solution hardening.
4. Conclusions
The microstructural parameters dislocation density and subgrain size of the cold-drawn pearlitic steels with carbon compositions of 0.73% and 0.84% were analyzed using XRD line profile analysis. The dislocation density in the ferrite phase increased with increasing plastic deformation. On comparing the dislocation density at similar strain levels for these steels, we found that dislocations tended to accumulate more in the steel having higher carbon composition. On the other hand, the subgrain size of the ferrite phase was independent of the plastic deformation up to a low drawing strain of about 0.7 and was found to be dependent on the carbon composition; the size was more refined with the increase in the carbon composition. The strengthening of the pearlitic steels up to the low drawing strain of about 0.7 can be explained by the contribution of the increase in the dislocation density. The cementite lamellae decomposed with increasing plastic deformation, which was confirmed by the line profile analysis for cementite. The contribution of the solid-solution hardening of carbon in the ferrite phase was probably cancelled by the decrease in the thickness of the cementite lamellae.
Acknowledgments
The authors are grateful to Tokyo Rope MFG. Co., Ltd. for providing specimens. This work was supported by ISIJ Research Promotion Grant and the Japan Society for the Promotion of Science, a Grant-in-Aid for Scientific research (C) (24560869).
References
- 1) I. Ochiai, S. Nishida, H. Ohba and A. Kawana: Tetsu-to-Hagané, 79 (1993), 1101.
- 2) H. Ledbetter: Mater. Sci. Eng. A, 527 (2010), 2657.
- 3) W. W. Webb and W. D. Forgeng: Acta Metall., 6 (1958), 462.
- 4) K. Van Acker, J. Root, P. Van Houtte and E. Aernoudt: Acta Mater., 44 (1996), 4039.
- 5) Y. Tomota, P. Lukáš, D. Neov, S. Harjo and Y. R. Abe: Acta Mater., 51 (2003), 805.
- 6) T. Suzuki, Y. Tomota, M. Isaka, A. Moriai, N. Minakawa and Y. Morii: ISIJ Int., 44 (2004), 1426.
- 7) M. L. Martinez-Perez, F. J. Mompean, J. Ruiz-Hervias, C. R. Borlado, J. M. Atienza, M. Garcia-Hernandez, M. Elices, J. Gil-Sevillano, R. L. Peng and T. Buslaps: Acta Mater., 52 (2004), 5303.
- 8) K. Hono, M. Ohnuma, M. Murayama, S. Nishida, A. Yoshie and T. Takahashi: Scr. Mater., 44 (2001), 977.
- 9) T. Tarui, N. Maruyama and H. Tashiro: Tetsu-to-Hagané, 91 (2005), 265.
- 10) J. Takahashi, M. Kosaka, K. Kawakami and T. Tarui: Acta Mater., 60 (2012), 387.
- 11) X. Zhang, A. Godfrey, X. Huang, N. Hansen and Q. Liu: Acta Mater., 59 (2011), 3422.
- 12) G. K. Williamson and W. H. Hall: Acta Metall., 1 (1953), 22.
- 13) B. E. Warren and B. L. Averbach: J. Appl. Phys., 21 (1950), 595.
- 14) G. K. Williamson and R. E. Smallman: Philos. Mag., 1 (1956), 34.
- 15) I. Groma, T. Ungár and M. Wilkens: J. Appl. Cryst., 21 (1988), 47.
- 16) T. Ungár and A. Borbély: Appl. Phys. Lett., 69 (1996), 3173.
- 17) T. Ungár, I. Dragomir, Á. Révész and A. Borbély: J. Appl. Cryst., 32 (1999), 992.
- 18) T. Ungár, M. Victoria, P. Marmy, P. Hanák and G. Szenes: J. Nucl. Mater., 276 (2000), 278.
- 19) T. Ungár, S. Ott, P. G. Sanders, A. Borbély and J. R. Weertman: Acta Metall., 46 (1998), 3693.
- 20) I. C. Dragomir and T. Ungár: J. Appl. Cryst., 35 (2002), 556.
- 21) T. Ungár, J. Gubicza, G. Ribárik and A. Borbély: J. Appl. Cryst., 34 (2001), 298.
- 22) A. R. Stokes: Proc. Phys. Soc. Lond., 61 (1948), 382.
- 23) M. Wilkens: Phys. Stat. Sol. (A), 2 (1970), 359.
- 24) Th. H. de Keijser, J. I. Langford, E. J. Mittemeijer and A. B. P. Vogels: J. Appl. Cryst., 15 (1982), 308.
- 25) K. Narita: Tetsu-to-Hagané, 66 (1980), 2119.
- 26) I. V. Isaichev: Zh. Tekh. Fiz., 17 (1947), 835.
- 27) R. W. Armstrong, I. Codd, R. M. Douthwaite and N. J. Petch: Philos. Mag., 7 (1962), 45.
- 28) L. Balogh, T. Ungár, Y. Zhao, Y. T. Zhu, Z. Horita, C. Xu and T. G. Langdon: Acta. Mater., 56 (2008), 809.
- 29) N. Hansen: Mater. Sci. Eng. A, 409 (2005), 39.
- 30) S. Allain and O. Bouaziz: Mater. Sci. Eng. A, 496 (2008), 329.
- 31) A. M. Elwazri, P. Wanjara and S. Yue: Mater. Sci. Eng. A, 404 (2005), 91.


