Regular Article
Nitrogen Solubility in Liquid Manganese Alloys Containing Silicon, Iron and Carbon
2013 Volume 53 Issue 5 Pages 768-773
Details
2013 Volume 53 Issue 5 Pages 768-773
The nitrogen solubility in liquid Mn–Si, Mn–Si–Fe, Mn–Si–C and Mn–Si–Fe–C alloys has been measured by the gas-liquid metal equilibration technique in the temperature range of 1673–1773 K. The additions of silicon, iron and carbon significantly decreased the nitrogen solubility in liquid manganese alloys. The experimental results were thermodynamically analyzed by the Wagner’s formalism to determine the first- and the second-order interaction parameters of silicon, iron and carbon on nitrogen in liquid manganese. The thermodynamic parameters can be used to predict the nitrogen solubility in ferromanganese and silicomanganese alloy melts as functions of the melt composition and temperature at given nitrogen partial pressures.
Ferromanganese and silicomanganese alloys are the main sources of manganese for various grades of steels. Recent development of high manganese steels such as Twinning Induced Plasticity(TWIP) steels prompted the research on the production of high purity manganese alloys.1,2,3,4) The nitrogen control in manganese alloys became also important for the production of low nitrogen containing high manganese steels. The thermodynamics of nitrogen in manganese alloys containing iron, silicon and carbon over wide ranges of melt composition and temperature is very important to control the nitrogen content in commercial manganese alloys.
The nitrogen solubility in pure Mn5,6,7,8,9,10) and Mn–Fe alloy melts10,11,12,13) has been studied by various investigators. In the authors’ previous study, the thermodynamics of nitrogen in Mn–Fe–C melts has been also investigated.10) Typical manganese alloys such as ferromanganese and silicomanganese alloys contain silicon up to 2 mass% and 20 mass%, respectively, however, the studies on the effect of silicon on nitrogen in liquid manganese alloys are very limited. Baratashvili et al.13) measured the nitrogen solubility in liquid Mn–Si alloy containing silicon up to 8 mass% at 1683 and 1933 K. There is no nitrogen solubility data in ternary or quaternary manganese alloy melts containing silicon.
In the present study, the nitrogen solubility in Mn–Si, Mn–Si–Fe, Mn–Si–C and Mn–Si–Fe–C melts was measured by the gas-liquid metal equilibration technique in the temperature range from 1673 to 1773 K. From the analysis of all the data obtained by the present study and the authors’ previous study,10) the first- and the second-order interaction parameters of silicon, iron and carbon on nitrogen in liquid manganese were determined to establish the database for the prediction of nitrogen solubility in ferromanganese and silicomanganese alloy melts as functions of the melt composition and temperature at a given nitrogen partial pressure.
In order to measure the nitrogen solubility in manganese alloy melts, the gas-liquid metal equilibration experiments were carried out using an electric resistance furnace heated by the silicon carbide with a mullite reaction tube (outer diameter [OD]: 70 mm, inner diameter [ID]: 63 mm, height [H]: 1100 mm) at 1673 and 1773 K as shown in Fig. 1. The reaction temperature was measured with a Pt/Pt–13%Rh thermocouple protected with an alumina tube at the bottom of the outer alumina crucible, and it was controlled within ± 1 K using a proportional-integral-derivative (PID) controller. The temperature reading of the thermocouple was corrected by measuring the temperature inside the crucible using a separate thermocouple prior to experiments.

A schematic diagram of the experimental apparatus.
Master alloys of Mn–21 mass% Si, Mn–30 mass% Fe and Mn–8 mass% C were prepared by melting electrolytic manganese (99.99% purity), metallic silicon (99.95% purity), electrolytic iron (99.99% purity) and high purity graphite powder in a high purity alumina crucible in an Ar–10%H2 atmosphere using a high frequency induction furnace. Desired portions of master alloys were charged to make an aimed melt composition for each experiment. Six grams of alloys were placed in a high purity alumina or graphite crucibles (OD: 13 mm, ID: 10 mm, H: 23 mm). Six crucibles containing different compositions were tied up by Mo wire and placed in the outer alumina crucible.
When the temperature had reached to a desired value, the gas was switched from an Ar–10%H2 to a mixture of N2 and Ar–10%H2 gases to have a nitrogen partial pressure of 0.01 or 0.03 atm in the reaction tube. The individual gas flow rates were controlled by the mass-flow controller, and the total gas flow rate was 1000 ml/min. The gas mixture was introduced above the surface of the melt through a 6 mm ID alumina inlet tube. The mass-flow controller was calibrated at the exit of the gas inlet with a precision wet-test meter. In order to establish the equilibration time for the nitrogen solubility measurement, a separate experiment was carried out for pure manganese melt at 1773 K. Figure 2 shows that the holding time of 5 hours is sufficient to obtain the gas-liquid metal equilibrium for these melts.
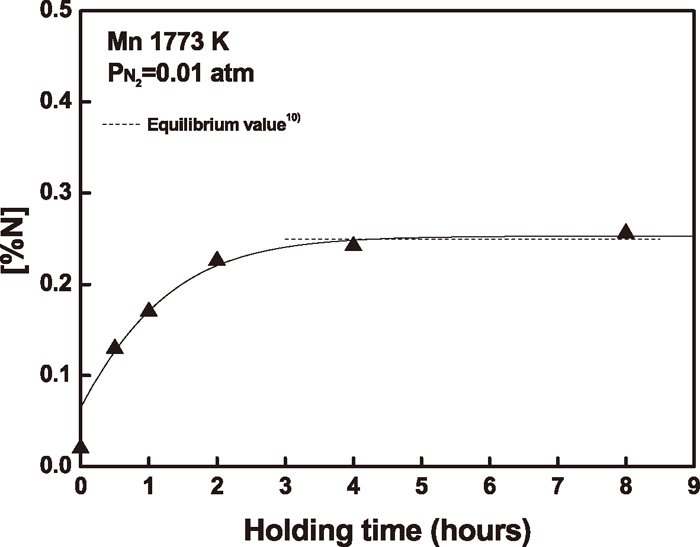
Variation of nitrogen content with time in pure Mn melt.
After each experiment, the crucible was pulled out of the furnace and quenched rapidly in a helium gas stream on the water-cooled copper plate. The metal samples were carefully crushed for the chemical analysis. The nitrogen and carbon contents in the metal samples were measured by the nitrogen/oxygen analyzer (LECO TC-600 apparatus; LECO Corporation, St. Joseph, MI) and the carbon/sulfur analyzer (CS-800, Eltra, Neuss, Germany), respectively. The iron and silicon contents in the metal samples were measured by the inductively coupled plasma atomic emission spectroscopy (ICP-AES, SPECTRO ARCOS apparatus, manufactured by Spectro Analytical Instruments, Kleve, Germany).
The experimental concern in dealing with liquid manganese alloy is its relatively high vapor pressure. The nitrogen partial pressure over the melt surface should be corrected by the following equation:
| (1) |
| (2) |
| (3) |
The dissolution of nitrogen in liquid manganese can be written as
| (4) |
| (5) |
The nitrogen solubility in liquid manganese is very high compared to the solubility in liquid iron. In the authors’ previous study,10) the standard Gibbs free-energy change for the dissolution of nitrogen in liquid manganese was determined by measuring the nitrogen solubility under various nitrogen partial pressures and temperatures. It was found that the dissolution of nitrogen did not follow the Sieverts’ law at high nitrogen partial pressures due to the interaction between nitrogen atoms in the melt at high nitrogen contents. Sieverts’ law was followed at low nitrogen contents below 1 mass% in liquid manganese where the interaction between nitrogen atoms in the melt could be neglected.10) Therefore, in the present study, the nitrogen solubility in manganese alloy melts was measured under reduced nitrogen partial pressures of 0.01 and 0.03 atm to keep the nitrogen content below 1 mass%.
3.1. Manganese-Silicon AlloysThe nitrogen solubility in Mn–Si melts containing silicon up to 21 mass% was measured to determine the effect of silicon on nitrogen in liquid manganese. The experimental results are summarized in Table 1. Figure 3 shows the nitrogen solubility in Mn–Si melts as a function of silicon content under different nitrogen partial pressures at 1673 and 1773 K. The addition of silicon in liquid manganese sharply decreases the nitrogen solubility. The temperature dependence of nitrogen solubility in these manganese-rich melts is negative.
| Temp. (K) | PN2 (atm) | [% Si] | [% N] |
|---|---|---|---|
| 1673 | 0.01 | – | 0.3290 |
| 0.98 | 0.3320 | ||
| 4.95 | 0.2010 | ||
| 10.25 | 0.0806 | ||
| 14.91 | 0.0253 | ||
| 19.03 | 0.0090 | ||
| 0.03 | – | 0.5663 | |
| 0.97 | 0.5270 | ||
| 5.33 | 0.3120 | ||
| 10.02 | 0.1487 | ||
| 15.85 | 0.0428 | ||
| 20.24 | 0.0138 | ||
| 1773 | 0.01 | – | 0.2730 |
| 1.04 | 0.2540 | ||
| 5.60 | 0.1517 | ||
| 11.27 | 0.0578 | ||
| 16.10 | 0.0240 | ||
| 21.01 | 0.0068 | ||
| 0.03 | – | 0.4130 | |
| 0.94 | 0.4090 | ||
| 5.11 | 0.2620 | ||
| 10.95 | 0.1150 | ||
| 15.34 | 0.0387 | ||
| 20.27 | 0.0153 |
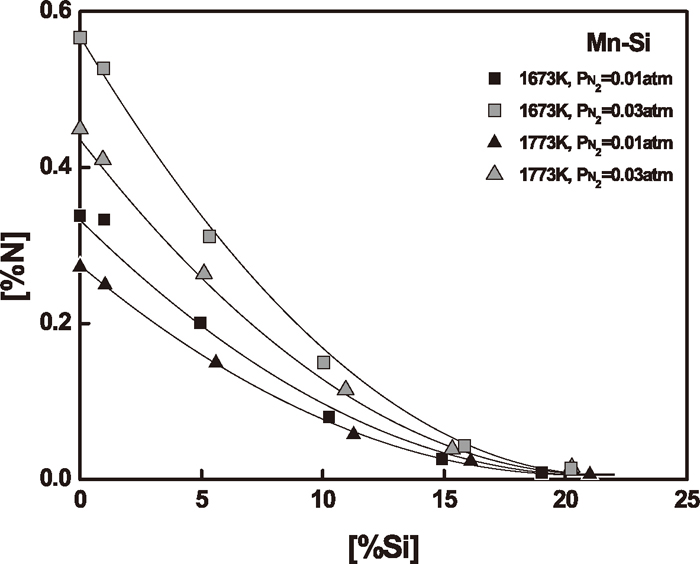
Effect of silicon content on nitrogen solubility in Mn–Si melts.
Figure 4 shows the apparent equilibrium constants, ln
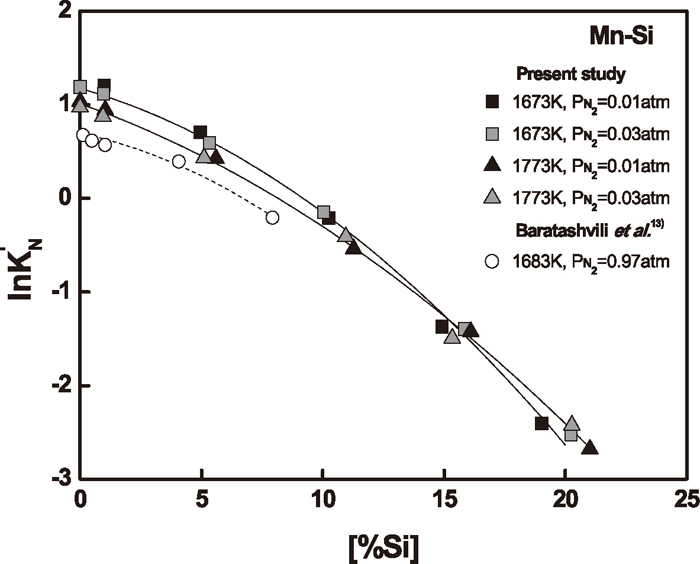
Variation
Figure 4 also compares the
The activity coefficient of nitrogen, fN in manganese-silicon melts can be calculated using Eq. (5) as a function of silicon content. In this calculation, the nitrogen partial pressure was corrected by Eq. (1) for the manganese vapor pressure from the PMn data in manganese-silicon melts determined by Gee et al.14) as shown in Fig. 5. However, the correction of PN2 values for manganese-silicon melts did not appreciably affect the fN values. For example, the vapor pressures of pure manganese melt at 1673 and 1773 K are 9.5·10–3 and 2.5·10–2 atm, and they reduce the nitrogen partial pressure over the melt surface about 0.95 and 2.5%, respectively. However, since the calculated fN values from Eq. (5) using corrected PN2 values are within 1% error, the effect of manganese vapor pressure could be neglected in the present study.
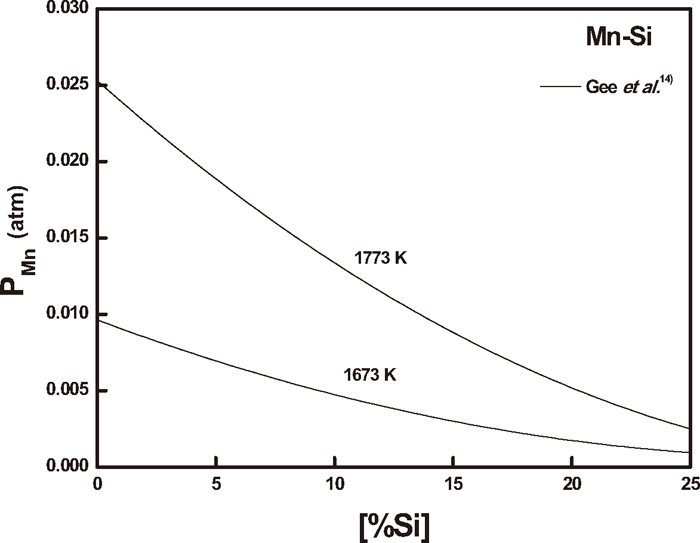
Change of manganese vapor pressure with silicon content in Mn–Si melts.
The resulting values of logfN are plotted versus silicon content in Fig. 6. The activity coefficient of nitrogen increases sharply with increasing silicon content. The data determined at different nitrogen partial pressures show an excellent correlation with silicon content at each experimental temperature. In other words, the Sieverts’ law of the nitrogen dissolution was obeyed at reduced nitrogen partial pressures in the present study.
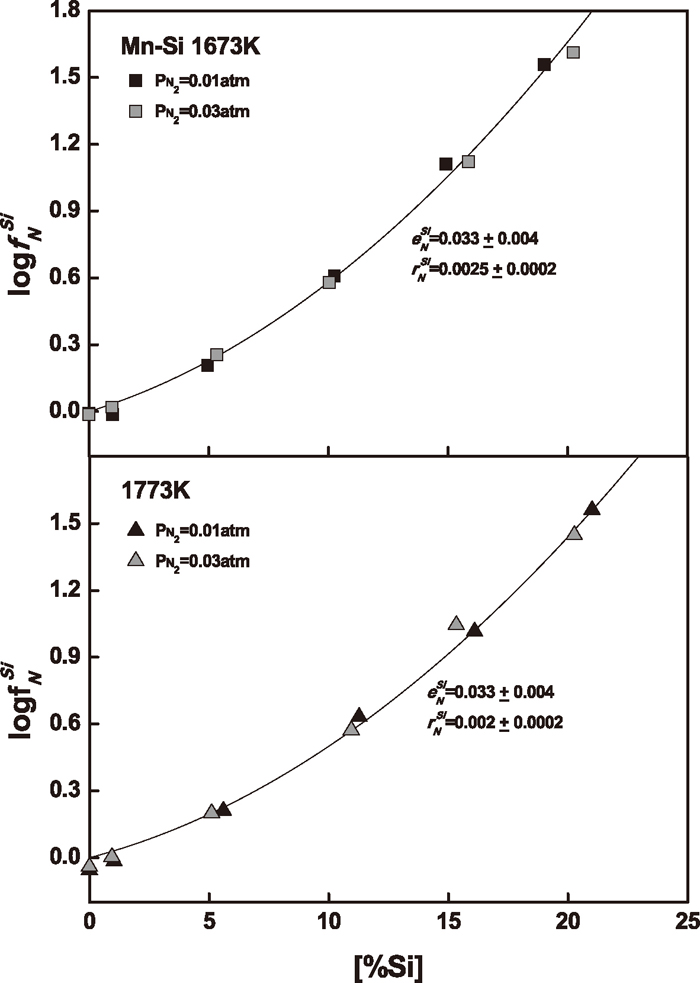
Variation of activity coefficient of nitrogen with Si content in Mn–Si melts.
The relationship can be analytically expressed using the first- and second-order interaction parameters:15)
| (6) |
The nitrogen solubility in Mn–Si–Fe melts was measured to determine the simultaneous effect of silicon up to 11 mass% and iron up to 21 mass% on nitrogen in liquid manganese at 1673 and 1773 K. The experimental results are summarized in Table 2. The activity coefficient of nitrogen in Mn–Si–Fe melts can be calculated from Eq. (5) using the nitrogen solubility data at given nitrogen partial pressures.
| Temp. (K) | PN2 (atm) | [% Si] | [% Fe] | [% N] |
|---|---|---|---|---|
| 1673 | 0.01 | 1.28 | 20.04 | 0.1537 |
| 1.38 | 9.88 | 0.2210 | ||
| 5.12 | 9.34 | 0.1457 | ||
| 7.05 | 19.72 | 0.0761 | ||
| 7.74 | 9.44 | 0.0987 | ||
| 8.80 | 19.56 | 0.0560 | ||
| 10.40 | 9.30 | 0.5720 | ||
| 1773 | 0.03 | 3.41 | 10.02 | 0.2273 |
| 4.55 | 10.60 | 0.1977 | ||
| 6.24 | 20.15 | 0.1100 | ||
| 7.12 | 9.61 | 0.1403 | ||
| 7.99 | 20.10 | 0.0870 | ||
| 9.84 | 20.02 | 0.0656 | ||
| 10.90 | 8.88 | 0.0856 |
Then the following relationship can be expressed using the interaction parameters.
| (7) |
Equation (7) can be rearranged as
| (8) |
Figure 7 shows the plot for the relation of Eq. (8) to determine the
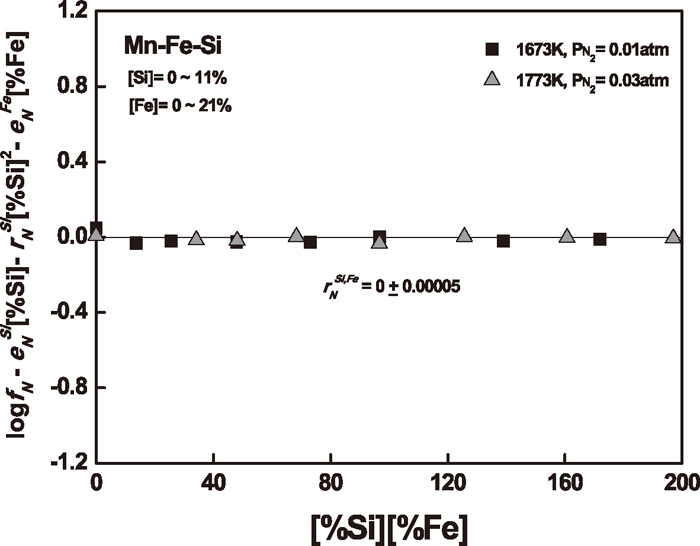
Relation of Eq. (8) to determine the
The nitrogen solubility in Mn–Si–C melts was also measured to determine the simultaneous effect of silicon up to 15 mass% and carbon up to its saturation on nitrogen in liquid manganese at 1673 and 1773 K. The experimental results are summarized in Table 3. The activity coefficient of nitrogen in Mn–Si–C melts can be obtained from Eq. (5), and it can be expressed as the following relationship using relevant interaction parameters.
| (9) |
| Temp. (K) | PN2 (atm) | [%Si] | [%C] | [%N] |
|---|---|---|---|---|
| 1673 | 0.01 | 10.92 | 1.49 | 0.0394 |
| 10.89 | 2.36 | 0.0207 | ||
| 0.03 | 2.81 | 1.85 | 0.2437 | |
| 3.00 | 6.44* | 0.0237 | ||
| 4.53 | 2.79 | 0.1186 | ||
| 5.18 | 5.64* | 0.0215 | ||
| 9.57 | 0.86 | 0.1085 | ||
| 13.29 | 3.03* | 0.0142 | ||
| 15.08 | 2.47* | 0.0122 | ||
| 1773 | 0.01 | 10.18 | 2.36 | 0.0240 |
| 10.69 | 3.68 | 0.0088 | ||
| 0.03 | 1.76 | 0.79 | 0.3057 | |
| 3.47 | 4.94 | 0.0383 | ||
| 4.48 | 4.93 | 0.0289 | ||
| 5.00 | 5.92* | 0.0157 | ||
| 6.50 | 3.90 | 0.0350 | ||
| 7.00 | 5.10* | 0.0156 | ||
| 9.58 | 2.40 | 0.0414 |
Using the similar method described in the preceding section, the
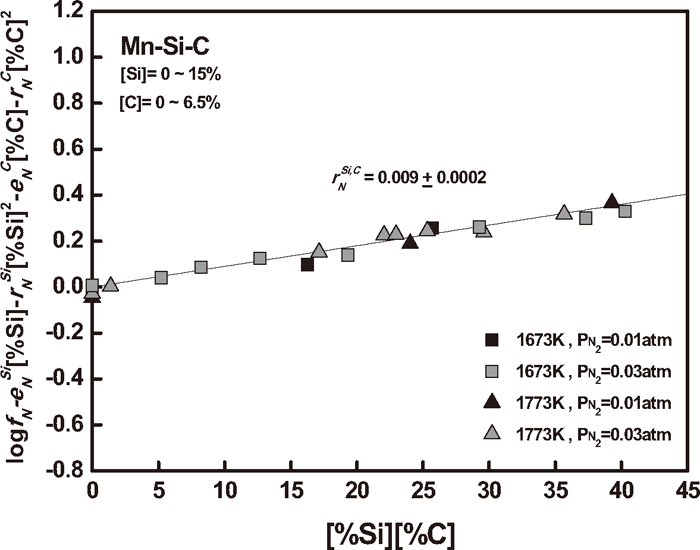
A relationship to determine the
Table 4 summarizes the first- and second-order interaction parameters of elements on nitrogen in liquid manganese alloys determined in the present study and the authors’ previous study.10) Using these interaction parameters, the activity coefficient of nitrogen in Mn–Si–Fe–C alloy melts can be evaluated. Then the nitrogen solubility in commercial manganese alloy melts can be calculated at given nitrogen partial pressures and melt temperatures from the following relation.
| (10) |
| System | i |
|
|
Temp. (K) | Ref. |
|---|---|---|---|---|---|
| Mn–N | N | 0.005 | 0.029 | 1623–1823 | 10 |
| Mn–Fe–N | Fe | 0.015 | 0 | 1623–1823 | 10 |
| Mn–C–N | C | 0.09 | 0.013 | 1623–1823 | 10 |
| Mn–Si–N | Si | 0.033 (±0.004) |
|
1673–1773 | Present study |
| Mn–Si–Fe–N | Si, Fe | 0 (±0.00005) | 1673–1773 | Present study | |
| Mn–Si–C–N | Si, C | 0.009 (±0.0002) | 1673–1773 | Present study |
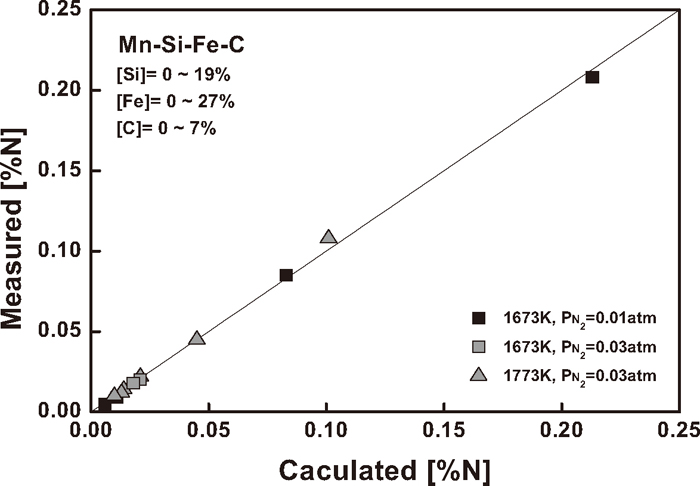
In order to check the validity of the interaction parameters determined in the present study, the nitrogen solubility measurement was carried out for Mn–Si–Fe–C melts over a wide range of composition under the nitrogen partial pressures of 0.01 and 0.03 atm at 1673 and 1773 K. Table 5 and Fig. 9 compares the experimental results of nitrogen solubility with the calculated values using Eq. (10). They are in excellent agreement, and it suggests that the interaction parameters determined in the present study can be used to predict the nitrogen content for ferromanganese as well as silicomanganese alloys over wide range of melt composition at given nitrogen partial pressures in the temperature range of 1673–1773 K.
| Temp. (K) | PN2 (atm) | [%Si] | [%Fe] | [%C] | Obs. | Cal. |
|---|---|---|---|---|---|---|
| [%N] | [%N] | |||||
| 1673 | 0.01 | 0.21 | 9.52 | 0.36 | 0.2080 | 0.2127 |
| 0.56 | 16.99 | 7.00* | 0.0107 | 0.0087 | ||
| 0.89 | 26.66 | 1.42 | 0.0855 | 0.0828 | ||
| 18.49 | 17.99 | 0.03 | 0.0046 | 0.0059 | ||
| 1673 | 0.03 | 6.94 | – | 4.95* | 0.0199 | 0.0214 |
| 9.36 | – | 4.19* | 0.0179 | 0.0184 | ||
| 1773 | 0.03 | 4.72 | 20.61 | 0.87 | 0.1080 | 0.1010 |
| 9.54 | 20.43 | 0.90 | 0.0465 | 0.0459 | ||
| 11.00 | – | 3.68* | 0.0136 | 0.0144 | ||
| 13.00 | – | 3.11* | 0.0118 | 0.0125 | ||
| 14.58 | 10.15 | 0.89 | 0.0226 | 0.0234 | ||
| 14.92 | – | 2.70* | 0.0099 | 0.0100 |
Correlation between calculated and measured nitrogen solubility in Mn–Si–Fe–C melts.
The interaction parameters of silicon, iron and carbon on nitrogen in liquid manganese have been determined from the nitrogen solubility in liquid Mn–Si, Mn–Si–Fe, Mn–Si–C and Mn–Si–Fe–C alloys over a wide range of composition at 1673 and 1773 K. These parameters could be used to accurately predict the nitrogen solubility in ferromanganese and silicomanganese alloy melts at given nitrogen partial pressures. The main finding of this study can be summarized as follows.
(1) The first- and the second-order interaction parameters of silicon on nitrogen in liquid Mn–Si–N melts can be expressed as
(Si ≤ 21 mass%, 1673–1773 K)
(2) The second-order interaction parameter of silicon and iron on nitrogen in Mn–Si–Fe–N melts can be expressed as
(Si ≤ 11 mass%, Fe ≤ 21 mass%, 1673–1773 K)
(3) The second-order interaction parameter of silicon and carbon on nitrogen in Mn–Si–C–N melts can be expressed as
(Si ≤ 15 mass%, C ≤ 6.5 mass%, 1673–1773 K)
This work was supported by the research fund of Hanyang University (HY-2011-G).