Regular Article
Physical and Mathematical Modelling of Liquid Steel Fluidynamics in a Billet Caster
2013 Volume 53 Issue 5 Pages 802-808
Details
2013 Volume 53 Issue 5 Pages 802-808
The aim of the present work is to achieve a better understanding of the liquid steel flow patterns in a billet mould when is fed by a misaligned nozzle using two important tools analysis, physical and mathematical modelling. The numerical model includes the government Navier-stokes equations, the k-ε model, and the VOF model for the multiphase air/steel/flux system. These equations are solves through the segregated model embedded in FLUENT®. The physical model was built at 1:1 scale, where red ink and video recording are employed to visualize the fluidynamics. One nozzle deviation is applied towards the mould radius. The results indicate that a centred nozzle position does not guarantee symmetrical flow patterns inside the mould due to its curvature design. Because of curvature, at the normal nozzle alignment the jet trajectory is closer to the inner mould radius. Even when the nozzle deviations are small like 1° or 2°, the results show that the fluid flow consequences are significant and negatives in most of the cases. The worst cases induce an impact of the jet to one of the mould walls and a very unstable meniscus with strong vortexes formation. Under the present configuration, 1° deviation of the nozzle towards the inner mould radius is good enough to achieve symmetrical flow patterns and to obtain a better meniscus control.
In the continuous casting machine the steel is transferred from the tundish into the mould; then, the steel is solidified forming a solid shell, which increases in thickness down the mould metallurgical length. At the mould end, the shell must be thick enough to hold the liquid steel pressure until the final solidification takes place. However, an inefficient control of casting operations may lead to the formation of undesirable quality problems such as longitudinal cracking, star cracking, oscillation marks, mould wear and breakouts. These steel problems and some others like non-metallic inclusions, powder entrapment, steel re-oxidation and non-uniform solidified shell have been studied mainly for conventional1,2,3,4,5,6,7,8) and thin slab casting,9,10,11) leaving a clear lag in the billet and bloom casting field. It is probably because the conventional straight nozzles employed in these moulds in a much more confined space, inducing what would be called standard flows with small variations of fluid flow patterns. Nevertheless, recently it was found that steel flow patterns for billet casting12,13) are equally complex than those reported on conventional slabs. Najera et al.14,15) reported that nozzle design and its immersion position have a direct influence on shell thinning by the manipulation of the flow pattern of steel inside the mould. Moreover, mould flux chemistry influences also considerably shell thickness since its thermo-physical properties influence heat transfer rates by its infiltrating characteristics through the mould strand gap.
Although the submerged entry nozzle (SEN) is an excellent device to get a better control on the fluid flow inside the billet mould; it is not the panacea for all casting problems, since a small deviation at the moment of its placement could come up many of the above mentioned steel quality defects. Also, given the inherent curvature of the continuous casting machines, it is possible to wear the solidified shell in the jet impact zone and a breakout of the line can occur. Because of the scarce information about fluid flow behaviour into the billet casting mould, the topic represents a great opportunity area to study the real process variables.
The main objective of this work is to improve the understanding of the fluid flow patterns in a billet mould when is fed by a misaligned nozzle, using physical and mathematical modelling where it was considered two SEN deviations, ±1° and ±2° towards the mould radius.
A full-scale analogue water model of a curved billet mould was constructed using 12 mm tick acrylic. This was positioned on an acrylic container that holds the mould and receives the working fluid. To avoid acrylic bulging effects by water pressure two steel belts surrounding the mould were tightened and the joint between the plastic pieces was sealed by silicon polymer. The water was pumped from a general storage vessel directly to the SEN controlling the flow rate with a valve. Once the water flows through the billet mould and to the lower container, this is discharged again in the storage vessel. A secondary pipe was added before the fluid gets the vessel in order to discharger the water when a dye pulse is employed. A small orifice was made at the SEN in order to inject the red dye. Before any recorded video or experimentation, the system was working for several minutes until a steady state was reached. All this description can be observed in Fig. 1(a).

a) Full scale analogue water model and b) Billet mould and nozzle dimensions (mm).
A fludynamic mathematical model was developed to study the effects of a misaligned nozzle on the steel flow pattern in a billet mould. The fundamental equations, the turbulence model, the multiphase model, and the modelling considerations are described below.
3.1. Fundamental EquationsThree dimensional continuity and the Navier-Stokes equations, shown in Eqs. (1) and (2) in Cartesian co-ordinates were solved, together with the k-ε standard turbulence model through the volume finite method.
| (1) |
| (2) |
The turbulence model is defined as follows,
| (3) |
| (4) |
The Volume of Fluid (VOF) model was employed to solve the multiphase system air-steel-slag. This scheme performs the calculation of the interface between the phases (p and q) present at each cell, based on their fraction as shown.16)
| (5) |
| (6) |
A unique continuity equation for the transient system is derived depending on the number of phases; therefore, the Eq. (7) is divided by the amount of phase q in the cell. Mass exchange between phases can be modelled by introducing an additional source term Sαq.
| (7) |
The VOF model solves a single set of momentum transfer equations when two or more phases coexist in the cell.
| (8) |
The tracking of the interface is accomplished by an implicit method, which solves the face fluxes (
| (9) |
As the previous equation requires the volume fraction values of the actual time step, an additional scalar transport equation for the steel and slag is solved iteratively at each time step for the transient state.
3.4. Modelling ConditionsThe fluid flowing into the billet mould was supposed to have Newtonian behaviour. Simulations were developed under unsteady state and isothermal conditions. Inlet and outlets were defined as a velocity-inlet condition; the inlet velocity is calculated to maintain the desired casting speed at the mould exit. A pressure inlet condition is applied at the mould top (P=101325 Pa, T=273 K) to model the effects of a system open to the atmosphere. The physical properties of fluid and the parameters of simulation are shown in Table 1.
| Property | Value | Parameter | Value |
|---|---|---|---|
| Steel density | 7010 kg/m3 | Nozzle immersion | 90 mm |
| Slag density | 2600 kg/m3 | Steel level in billet mould | 850 mm |
| Air density | 1.225 kg/m3 | Casting speed | 2 m/min |
| Steel viscosity | 0.006 Pa s | ||
| Slag viscosity | 0.4 Pa s | ||
| Interfacial tension Steel-Slag | 0.12 N/m | ||
| Interfacial tension Steel-Air | 1.6 N/m |
Momentum transfer equations were solved using appropriate boundary conditions such as no-slip condition for all surfaces, a velocity distribution inside the nozzle obeying the 1/7 law.17) In the viscous sub layer the high velocity gradients were connected with the main flow through the logarithmic law.17) The governing equations are discretized using an implicit, first-order upwinding scheme and the SIMPLEC algorithm for pressure-velocity coupling. Convergence criterion was obtained when the residuals of the output variables reached values equal or smaller than 1×10⁻⁴. The dimensions of the billet mould are shown in Fig. 1(b). The computational grid was conformed of 900000 structured cells as shown in Fig. 2, and were constructed in GAMBIT®.

Computational grid.
In order to understand the effect of the SEN misalignment, it is necessary to study firstly the flow patterns under the actual conditions, which are those where the nozzle axis is aligned to the centre of the upper face of the mould. The study began with the physical modelling for the mentioned conditions. The water model was functioning for several minutes until a steady state was reached; at this moment, a red dye pulse was injected at the upper entry side of the nozzle while a video was recorded. At the same time, a mathematical simulation of this case was carried out considering unsteady conditions. These results were analysed from video images at different times and by velocity vectors fields at the central-symmetrical plane of the mould from the numerical model; these are shown together in Fig. 3. It is clear that the jet axis delivered by the entry nozzle is not centred with the mould axis producing asymmetrical flow patterns. During the dye injection the jet shows a flow direction towards the outer wall allowing a bigger space between the jet and the inner mould wall; in such space a recirculation takes place permitting the flow to move upwards to the free surface. Nevertheless, when the flow reaches the level of the SEN tip, it changes its trajectory towards the SEN surrounding it and continuing its ascending movement; this latter fluid movement is due to the fluid exist from a confined zone (between the recirculation and the mould wall) towards a wider area which generates that the fluid try to open, but at the right side it finds the mould wall and then it moves easier towards the SEN side. This phenomenon induces that the liquid reaches the free surface first by the outer mould wall than for the inner mould side, which is the side where the fluid is firstly ascending. Even when the lines drawn allow following this flow trajectory, it is evident that similar patterns are observed in the numerical results, where it is easier to observe the flow directions by the velocity vectors. Consequently, it can be stabilised that even when the nozzle axis is centred with the upper face of the mould, the jet trajectory is not centred inside the mould and therefore the flow patterns are asymmetrical. This behaviour must have a direct consequence at the stability of the level, which will be discussed later.

Nozzle centred. a)–e) Mixing patterns of red dye and f) Computational velocity fields at the central-symmetrical plane.
Following the objective of this work, the next step was to study the effect of the axis nozzle deviation. The next analysed case was 2° deviation of the nozzle toward the inner mould radius. For this case, the same figures mentioned above were obtained and are shown in Fig. 4. As can be seen, similar flow pattern as described in the original configuration is observed, but with a mirror pattern. This means that now the jet moves towards the inner mould wall and then the recirculation take place closer to the outer mould wall. The most significant difference to point out is that the fluid impacts the nozzle tip at the opposite side respect to the first analysed case, and the fluid reaches the free surface first at the inner mould side. After this, the nozzle was located with a 2° deviation towards to the outer mould radius; the results are shown in Fig. 5, where it can be seen that the flow pattern is quite similar to the original case. However, there are many important differences: a) the jet moves more towards the outer mould radius wall promoting the impinging of this in such face, b) the space between the jet and the inner mould radius wall becomes bigger and as a result the recirculation beside the jet increases its size, and c) the ascending stream that reaches the nozzle tip level does not change its trajectory as strong as in the original case; in this case just a small volume of liquid moves towards the SEN tip and most of fluid continues moving upwards to the free surface. It is obvious that this case is really detrimental since the jet impact may produce a breakout. At this point, these two analysed cases are those considered with the most extreme nozzle deviations, which are unlikely to happen since these would be very evident to ignore. Nevertheless, a nozzle with 1° deviation is more probable to take place since this would be more difficult to perceive.

2° deviation towards the inner mould radius. a)–e) Mixing patterns of red dye and f) Computational velocity fields at the central-symmetrical plane.

2° deviation towards the outer mould radius. a)–e) Mixing patterns of red dye and f) Computational velocity fields at the central-symmetrical plane.
Under this consideration, the next studied cases were those with 1° nozzle deviation towards the inner and outer radius of the mould. Firstly, 1° towards the inner mould radius was considered and the corresponding physical and mathematical results are shown in Fig. 6. Considering this configuration the centring jet is achieved generating the changes of the general fluid behaviour. The space between the jet and the mould walls shows a better distribution and instead of one single recirculation, two smaller recirculations are observed at each side of the jet. Because of that, the fluid ascends uniformly along the lateral sides of the jet and when the flow reaches the nozzle tip level, it does not change its trajectory and continues moving upwards. In addition, the jet penetration is clearly deeper, which produce a decrement in the ascending flow velocity in comparison to the previous cases; therefore, a more stable free surface could be expected. The final studied case was 1° deviation of the nozzle towards the outer mould radius. The physical and mathematical results are shown in Fig. 7, where the jet trajectory shows again a deviation towards the outer mould radius like in the original SEN position, but is stronger. As a result, the general flow pattern is very similar than the described for the original position. The main difference is that the jet impacts the outer mould wall in a slightly upper position; due to this, a bigger space between the jet and the mould wall is generated. This increase promotes that the ascending flow leaves the recirculation zone with smaller velocity, which induces that its trajectory does not change so sever when it reaches the nozzle tip level allowing that most of the fluid continues ascending directly to the free surface, as can be seen by the tracer images and confirmed by the numerical velocity field.

1° deviation towards the inner mould radius. a)–e) Mixing patterns of red dye and f) Computational velocity fields at the central-symmetrical plane.

1° deviation towards the outer mould radius. a)–e) Mixing patterns of red dye and f) Computational velocity fields at the central-symmetrical plane.
Up to this point an analysis of the nozzle deviation effects on fluidynamic has been carried out and the main differences among the studied cases have been pointed out. Two more aspects need to be considered; first, a closer analysis of the fluid change at the SEN tip, and second, the jet penetration. To observe the magnitude of the velocity change at the nozzle tip as a function of its deviation, a line was drawn from the inner radius to the outer radius at the mould centre eliminating the data of the exit nozzle zone. In this line the fluid velocity was calculated for each studied case and the results are shown in Fig. 8. This figure illustrates the magnitude of the velocity variations discussed previously for each case confirming all observations made. It is clear that for all cases there is a clear variation on the velocity at each side of the nozzle, which will have a considerable effect on the meniscus stability. However, the only case that presents uniform values is the 1° towards the inner radius, which is the case that also shows the smaller velocity magnitudes. On the other hand, the jet penetration was measured and calculated for the physical and mathematical results, respectively, as shown in Fig. 9. It is observed that a deviation towards the outer mould radius generates a smaller jet penetration which is much more detrimental than when it takes place towards the inner mould radius where better penetration is achieved. In fact, when the nozzle has a 1° deviation towards the inner mould radius is when the deepest penetration is achieved (Fig. 6). It should be remarked the good agreement between the physical and the mathematical values.

Velocity magnitude calculated in a horizontal line at the SEN tip position.

Jet penetration as a function of the nozzle position.
From this discussion, it can be established that a small nozzle deviation, from the vertical axis, produce strong flow patterns changes inside the mould; this deviation moves the jet towards one of the mould walls and reduces its penetration. Consequently, it can be concluded that the fluidynamics inside the billet mould is not as simple as was thought.
As analysed previously, if the jet is not correctly centred a big recirculation will take place in one of its side, and this recirculation will promote an ascending stream, which change its trajectory toward the SEN at the nozzle tip. This flow, that surrounds the SEN, must produce a strong wear in that zone; however, this variable cannot be measured neither by physical nor by mathematical modelling, but it is possible to have an idea of the affected zones through the wall skin friction coefficients shown in Fig. 10. Wall Skin Friction Coefficient (Cf) is a dimensionless parameter defined as the ratio of the wall shear stress and the reference dynamic pressure: Cf = τw/(0.5*ρref*vref²) where τw is the wall shear stress and ρref and vref are the reference density and reference velocity. Fig. 10 shows that the bigger wear in the nozzle is not located at the zone where the liquid impacts; instead, it is situated at the lateral sides and at the bottom tip of the nozzle which are the areas where the liquid is flowing surrounding the nozzle. These predicted zones were confirmed through sample real pictures of a wear nozzle reported by Morales et al.13) in Fig. 11 for a casting speed of 1.5 m/min. It is clear that the greater wear zones on the nozzle are in the slag ring level, caused by the chemical erosion, and at the nozzle tip, but with more intensity in one of its sides. In Fig. 10 all the cases are exposed, where it is clear that the position with more wear are the centred and those with deviation towards the outer radius, and the cases that present the less wear are those with a deviation towards the inner radius being 1° the one with the smaller values of wall skin friction coefficient. These results indicate that an adequate position of the SEN will not only ensure a more stable fluid flow pattern but also will reduce the SEN wear.

Wall skin friction coefficient at the nozzle wall, a) Original position, b) 2° towards the inner wall, c) 2° towards the outer wall, d) 1° towards the inner wall and e) 1° towards the outer wall.

Physical aspect of two different nozzle reported by R. D. Morales et al.13)
On the other hand, it is well known that most of the surface defects on the final product are a consequence of an excessive turbulence in the fluidynamic patterns, which are reflected in unstable meniscus behaviour. Considering this, it is clear that the flow changes inside the billet mould caused by the different nozzle deviations will have an important effect at the free surface. Subsequently, this analysis continued studying the slag phase behaviour by the physical and mathematical models. To achieve this, an oil layer was added on the free surface of the physical model to simulate the slag effect, and then a video was recorded in a close up at the slag zone. First, the slag deformation position was identified for each studied case and the results are shown in Fig. 12, together with its corresponding mathematical equivalences. Then, the maximum slag phase deformations were determined and are shown in Fig. 13. These results indicate that the slag/liquid interface has its bigger deformation at the opposite side to the location of the recirculation, mentioned in almost all cases. This is due to the ascending fluid for the recirculation side changes at the level of the nozzle tips and reaches the meniscus at the opposite side, as explained before. In addition, the same figures shows that the worst case is when the nozzle deviation is 2° towards the outer mould radius wall (Fig. 12(c)) and that the best case is not the original one; instead, it is the case when the nozzle has 1° deviation towards the inner mould radius wall (Fig. 12(d)). It is important to report that during the video recording, instantaneous vortexes were detected in some cases at different positions; these vortexes had short lifetime and it was not possible to obtain a clear image. However, in order to be able to observe the vortexes formation, mathematical velocity vectors at the liquid level were predicted and these are shown in Fig. 14. Figure 14(a) shows a flow that reaches the meniscus very close to the SEN for the outer radius; this flow surrounds the SEN and generates the formation of several small recirculations. These are changing its position and intensity; then, it is quite probable that at some time these became in momentary vortexes. In contrast, when the nozzle is misaligned the flow patterns at the free surface present considerable changes. If the nozzle is deviated toward the outer mould radius (Figs. 14(c) and 14(e)) the velocity profiles show bigger values and the fluid reaches the free surface closer to the SEN wall for the inner mould radius, these variations are reflected in a more unstable free surface as can be observed. From these two cases, 2° deviation presents the greatest velocity variations and it developed more vortexes occurrence. Now, if the nozzle is deviated 2° towards the inner mould radius the velocity profiles shows a chaotic movement but with less velocity magnitude than in the previous cases and the observed vortexes show random position. On the other hand, with a 1° deviation the flow patterns becomes much more symmetric and the intensity of the recirculations and of all the fluid flow decrease considerable, which is the main cause to obtain the mentioned slag stability.

Physical and mathematical slag phase deformation. a) Original position, b) 2° towards the inner wall, c) 2° towards the outer wall, d) 1° towards the inner wall and e) 1° towards the outer wall.
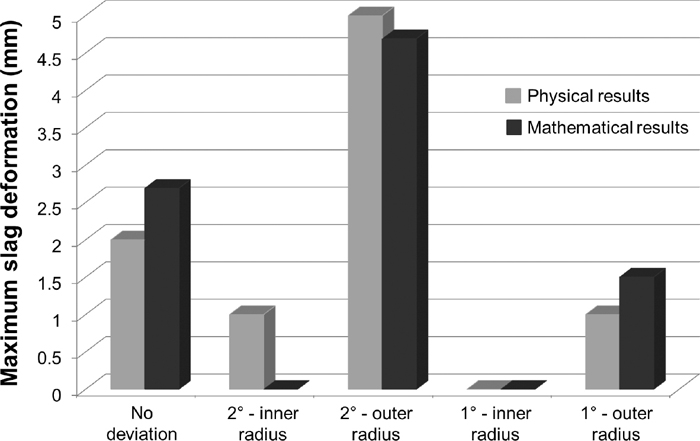
Physical and mathematical maximum slag phase deformation.

Computational velocity fields at the free surface. a) Original position, b) 2° towards the inner wall, c) 2° towards the outer wall, d) 1° towards the inner wall and e) 1° towards the outer wall.
Physical and mathematical models were employed to study the effect of a misaligned nozzle on the steel flow patterns in a billet mould. In order to achieve this, a nozzle deviation was applied towards the inner and outer mould radius, and the main conclusion can be drawn as follow:
(1) When the nozzle axis is centred to the normal of the upper mould face, which is the usual practice, the flow patterns inside the billet mould are non-symmetrical generating a strong recirculation in one the sides of the liquid jet and producing intermittent surface vortexes.
(2) The worst cases were those when the nozzle has a deviation towards the outer mould radius since the jet penetration was reduced, the jet impacts the outer mould radius wall at a highest position, the liquid interface shows the greatest deformation, and the observed vortexes shows more intensity.
(3) The best cases were those when the nozzle has a deviation towards the inner mould radius, been the best case1° deviation in such direction. In this case, a centred jet was achieved, a deeper jet penetration was get, the ascending streams were homogeneous, the free surface shows the smaller deformation, and the vortexes in the same surface had a considerable intensity reduction.
(4) A jet that is not centred inside the billet mould induces a flow that impacts the nozzle tip inducing a wear effect. This phenomenon is strongly affected by the SEN misalignment, which may increase the nozzle wear and/or change the position of such wear. When the jet is centred the nozzle wear is considerable reduced.
(5) Small nozzle deviation can produce serious flow pattern changes that can be detrimental for the steel quality, may produce breakouts or may help to control the flow turbulence. However, the best conditions only can be determinate by a complete study such as the present research work.
The authors give thanks to the institutions DGEST, ITM, PROMEP, SNI and CONACYT for supporting with the graduate and postdoctoral grants to stay at ITM.
∇: Gradient, velocity change on the coordinate axes (x,y,z)
u, v, w: Velocities on the coordinate axes (x, y, z), m/s
P: Pressure, Pa
μ, μt, μeff: Dynamic viscosity, turbulent and effective, Pa s
ρ: Fluid density, kg/m3
Cμ: Viscosity constant
k: Turbulence kinetic energy, m2/s2
ε: Dissipation of turbulent kinetic energy, m2/s3
Gk: K due to generation of the mean velocity gradients
σkσεCμC1C2: Constants model k-ε
ρmix: Mixed Phase density, kg/m3
μmix: Mixed Phase viscosity, Pa s
α: Volume fraction, %
αp αq: Volume fraction of the pth and qth phases, %
μp αq: Viscosity fraction of the pth and qth phases, %
Saq: Source term or constant of VOF model
ρq ρp: Density fraction of the qth and pth phases, kg/m3
mpqmqp: Mass exchange between p and q phases, kg/s
SsSσ: Exchange rate of the stress tensor