Regular Article
Viscosity and Solidification Temperature of SiO2–CaO–Na2O Melts for Fluorine Free Mould Flux
2013 Volume 53 Issue 5 Pages 818-822
Details
2013 Volume 53 Issue 5 Pages 818-822
Fluorine-free mould flux has been required to reduce corrosion of continuous casters. In this paper, Na2Ca2Si3O9 has been applied to an alternative crystalline phase of Ca4Si2O7F2 (cuspidine) that crystallized in commercial flux films. Effects of basicity described as T.CaO/SiO2 and additions of Li2O, Na2O, MgO and/or MnO into Na2Ca2Si3O9 composition mould flux on viscosity and solidification temperature were studied and the solidified specimens were examined by X-ray diffraction to identified crystalline phases.The viscosity of the mould flux is reduced with increaing of the basicity or the basic components contents. The solidification temperature decreased slightly as the basicity increased from 0.47 to 0.60, whereas it increased steeply with increasing of the basicity from 0.60 to 0.70. The solidification temperature also steeply increased when large amounts of these basic components were added. With increasing of the basic components amounts, the first peak intensity of the target phase, Na2Ca2Si3O9, decreased while that of Na2Ca2Si2O7, which had higher melting point than the target phase, increased. It is indicated that the solidification temperature is related to Na2Ca2Si2O7 crystallization.Carbon steel was cast with one of the developed fluorin-free mould fluxes and slab without any surface cracking was obtained.
Fluorine is an important component to adjust physical properties of mould flux appropriately as well as to crystallize Ca4Si2O7F2 (cuspidine) in flux films to control a heat transfer for mild cooling.1) Therefore, the crystallization of cuspidine has been studied about phase relation,2) primary field3) and precipitation.4) Gibbs energy of formation of cuspidine has been also determined.5)
On the other hand, a reaction between the mould flux and secondary cooling water causes fluorine dissolution into the water and generates hydrogen fluorine that corrodes plant equipment.6) Thus, fluorine-free mould flux has been required. Recently, Fox et al.7) and Nakada et al.8) have submitted B2O3 and TiO2 which are alternative substitutes for CaF2 in the mould fluxes, respectively. These reports indicate possibility of fluorine-free mould fluxes.
In this study, SiO2–CaO–Na2O system is focused as a base system of the fluorine-free mould flux. Na2Ca2Si3O9, which has a melting point of 1280–1290 degree Celsius,9,10,11) is thought to be an applicable crystalline phase which substitutes for cuspidine. Effects of additions of Li2O, Na2O, MgO and/or MnO to Na2Ca2Si3O9 composition of the mould flux mixed with law materials on solidification temperatures, viscosities and crystalline phase have been studied.
The equilibrium phase diagram of SiO2–CaO–Na2O system is shown in Fig. 1. The primary field of Na2Ca2Si3O9 consulted with the reference9) is also illustrated in Fig. 1. Specimen components of SiO2, CaO and Na2O correspond to the shaded region in Fig. 1, and Li2O, MgO and/or MnO were added into them. These specimens were prepared by mixing industrial raw materials. The compositions of these specimens are shown in Table 1. RS in Table 1 named “soda ratio” in this paper is defined as a ratio of Na2O mass divided by total mass of SiO2, CaO and Na2O.

Equilibrium phase diagram of Na2O–CaO–SiO2 system and primary field of Na2Ca2Si3O9.
| Basicity (T.CaO/SiO2) | 0.47–0.70 |
|---|---|
| Na2O | 14.9–25.8 mass% |
| RS | 0.18–0.28 |
| Li2O | 0–2.2 mass% |
| MgO | 0.4–7.8 mass% |
| MnO | 0–0.9 mass% |
| Al2O3 | 1.9–3.6 mass% |
The viscosities and the solidification temperature of the mould fluxes were evaluated with the oscillating-plate viscometer.12) 1 kg of the sample was melted at 1673 K in a carbon crucible under argon atmosphere. Then its temperature was decreased at a rate of 2 K/min, and the viscosity was measured continuously. When the sample began to solidify, the viscosity rose rapidly. A breakpoint found in relationship between the temperature and the viscosity was defined as the solidification temperature.
After the physical properties were measured, a solidified specimen in the crucible was crushed into powder and analysed by X-ray diffraction. From peak patterns of the X-ray diffraction, crystalline phase was identified. An intensity of the X-ray diffraction at the first peak of each crystalline phase was used as an index of the crystallization.
The relationship between the basicity and the solidification temperature is illustrated in Fig. 2. The solidification temperature decreased slightly as the basicity increased from 0.47 to 0.60, whereas it increased steeply with increasing of the basicity from 0.60 to 0.70. The effect of an amount of Li2O, Na2O or MgO into Na2Ca2Si3O9 composition fluxes on the solidification temperature is shown in Fig. 3. The solidification temperature decreased as the amount of Li2O or MgO increased. When the content of Na2O was less than 6 mass%, it had little influence on the solidification temperature. On the other hand, the solidification temperature increased a little at around 10 mass% Na2O.

Relationship between the basicity and the solidification temperature.

Effect of an amount of Li2O, Na2O or MgO on the solidification temperature.
The peak patterns of the X-ray diffraction showed that Na2Ca2Si3O9 crystallized in all specimens and Na2Ca2Si2O7 crystallized in several specimens. The relationship between the basicity and intensities of the first peaks of these two kinds of crystalline phases is illustrated in Fig. 4. The first peak intensity of Na2Ca2Si3O9 decreased as the basicity increased from 0.60 to 0.70, whereas the first peak intensity of Na2Ca2Si2O7 increased with increasing of the basicity from 0.60 to 0.70. Effects of Na2O content on the first peak intensities of Na2Ca2Si3O9 and Na2Ca2Si2O7 were shown in Fig. 5. With increasing of Na2O content, the first peak intensity of Na2Ca2Si3O9 decreased and the intensity of Na2Ca2Si2O7 increased. While the addition of Li2O or MgO caused the first peak intensity of Na2Ca2Si3O9 to decrease, Na2Ca2Si2O7 was little observed.

Relationship between the basicity and the first peak intensities of Na2Ca2Si3O9 and Na2Ca2Si2O7.

Effect of an amount of Na2O on the first peak intensities of Na2Ca2Si3O9 and Na2Ca2Si2O7.
From Figs. 2, 3, 4, 5, it is indicated that the solidification temperature increased with increasing the first peak intensity of Na2Ca2Si2O7. A “compositional length”, L, which is defined in Eq. (1), is applied to investigate the effect of the composition at the basicity of around 0.60 on the first peak intensities of these two kinds of crystalline phases and the solidification temperatures.
| (1) |
i: SiO2, CaO, Li2O, Na2O, MgO, MnO, Al2O3
Here, X and Y are the mole fractions of specimens and Na2Ca2Si3O9, respectively. This length represents a compositional distance between specimens and the target phase. Relationships between the compositional length and the first peak intensities of Na2Ca2Si3O9 and Na2Ca2Si2O7 and the solidification temperature are shown in Fig. 6. The first peak intensity of Na2Ca2Si3O9 steeply decreased and that of Na2Ca2Si2O7 gradually increased with the compositional length increase. The solidification temperature increased steeply as the compositional length increased from 0.10 to 0.17, where the first peak intensity of Na2Ca2Si2O7 was relatively high. This result indicates that the solidification temperature is increased with crystallization of Na2Ca2Si2O7, which has about 170 degree Celsius higher melting point than Na2Ca2Si3O9. At the constant basicity, increasing of amounts of Li2O, Na2O, MgO and/or MnO, which are obviously basic components, cause both activities of SiO2 to decrease and of CaO to increase. Accordingly, it is considered that Na2Ca2Si2O7, which has higher basicity than Na2Ca2Si3O9, crystallizes with increasing of the compositional length.
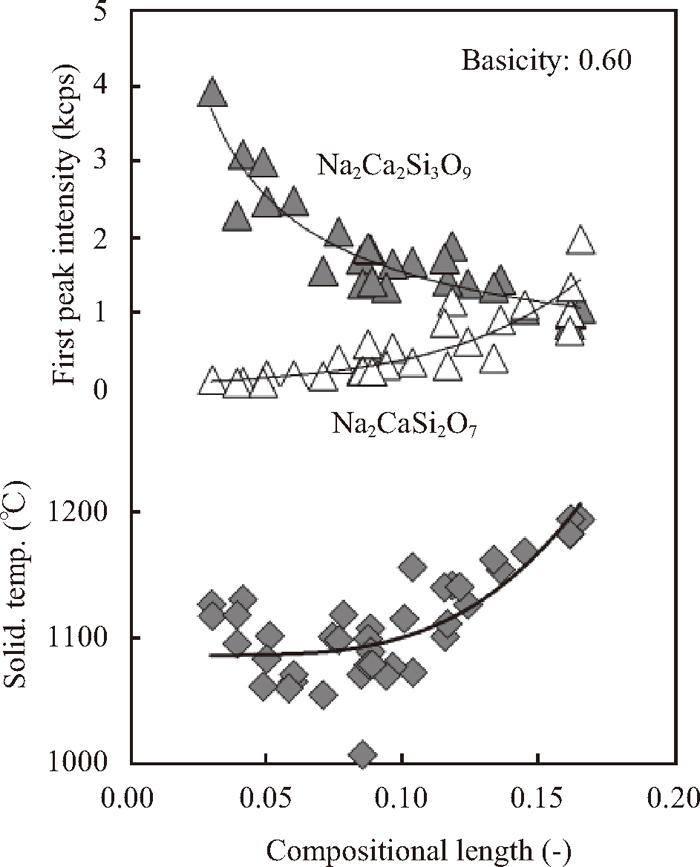
Relationships between the compositional length and the first peak intensities of Na2Ca2Si3O9 and Na2Ca2Si2O7 and the solidification temperature.
The relationship between the basicity and the viscosity at 1300 degree Celsius is illustrated in Fig. 7. The viscosity decreased with increasing of the basicity. The effect of the addictive amount of Li2O, Na2O or MgO on the viscosity at 1300 degree Celsius is shown in Fig. 8. Figure 8 expresses that these basic components, especially Li2O, affect on decreasing of the viscosity. The viscosity behaviors including Li2O or MgO with different soda ratio are shown in Figs. 9 and 10. From these two figures, it is demonstrated that the Li2O or MgO addition conducts the viscosity reducing and it is more effective with lower contents of Na2O. The relationship between the compositional length and the viscosity at 1300 degree Celsius at the basicity of aronud 0.60 is shown in Fig. 11. The viscosity was indicated to decrease as the compositional length increased because the basic components, except for Al2O3, were added.

Relationship between the basicity and the viscosity at 1300 degree Celsius.

Effect of the amount of Li2O, Na2O or MgO on the viscosity at 1300 degree Celsius.

Effect of the amount of Li2O at each constant soda ratio on the viscosity at 1300 degree Celsius.

Effect of an amount of MgO at each constant soda ratio on the viscosity at 1300 degree Celsius.
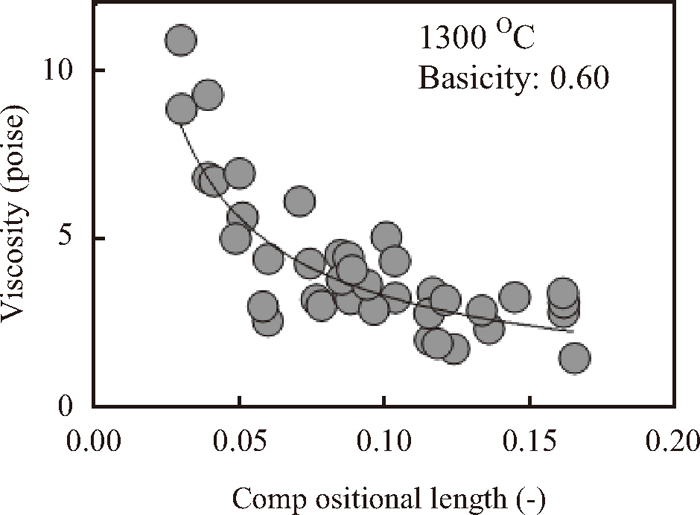
Relationship between the compositional length and the viscosity at 1300 degree Celsius.
Viscosity is considered to depend on the network of silicate, and activity of SiO2 is applied as an index of the viscosity. The activity of SiO2 in molten flux decreases with increasing of the basic components, as same as the viscosity decrease. The relationship between the viscosity at 1300 degree Celsius and the SiO2 activity at same temperature calculated by using FactSage thermodynamic software and FToxide Database13) is shown in Fig. 12. Because FToxide does not support a solution database including Li2O, the results seen in Fig. 12 are comprised without Li2O. Figure 12 demonstrates that the viscosity at 1300 degree Celsius decreases lineally as the SiO2 activity decreases in the range of composition applied in this study.

Relationship between the SiO2 activity and the viscosity at 1300 degree Celsius.
As described above, the addition of basic components into Na2Ca2Si3O9 composition flux mixed with industrial materials causes Na2Ca2Si3O9 crystallization to decrease while it is required to reduce the viscosity. From Figs. 6 and 11, however, there are available specimens as the mould fluxes in the range of compositional length from 0.05 to 0.10. In this range, the first peak intensity of Na2Ca2Si3O9 is much higher than that of Na2Ca2Si2O7, and it is indicated that Na2Ca2Si3O9 mainly crystallizes in flux films and the compositions in this range prevent steep increases of the solidification temperature caused by Na2Ca2Si2O7 crystallization. Tsutsumi et al.14) have observed that the critical cooling rate for glass formation of Li2O–SiO2, Na2O–SiO2 and Na2O–CaO–SiO2 systems by hot-thermocouple methods with DTA. From the report, it is estimated that the critical cooling rate of mould flux whose basicity is 0.62 achieves around 20 mass% Na2O and shows little change with more Na2O added, and that Li2O has more effect on the critical cooling rate than Na2O. These are important information on the crystallization of the present mould flux.
In the components range used in the present study, the lowest viscosities at 1300 degree Celsius are around 3 poise, which are thought to be an available viscosity for casting since the viscosities of commercial mold fluxes15,16) are approximately from 1 to 4 poise at that temperature.
One of the developed fluorine-free mould fluxes shown in Table 2 and 3, whose composition was given in the above discussion, was applied to steel casting with our test continuous caster for slab casting. The casting test with the conventional mould flux seen in Tables 2 and 3 was also carried out. 0.47%C steel, whose composition was shown in Table 4, was casted under the condition of velocity of 0.70 m/min, oscillation stroke of 7 mm, and negative strip ratio of 40%.
| mould flux | T.CaO/SiO2 | T.Na2O+Li2O | T.F | others |
|---|---|---|---|---|
| conventional | 0.80 | 5 | 5 | 8 |
| developed | 0.62 | 22 | – | 4 |
| mould flux | Viscosity at 1300°C (poise) | Solid. temp. (°C) | Main Crystalline Phase |
|---|---|---|---|
| conventional | 2.5 | 1150 | Ca4Si2O7F2 |
| developed | 3.2 | 1100 | Na2Ca2Si3O9 |
| C | Si | Mn | P | S | Cr |
|---|---|---|---|---|---|
| 0.47 | 0.23/0.24 | 0.72/0.77 | 0.010/0.011 | 0.020/0.024 | 0.15/0.16 |
There were no cracks found on the surface of each slab. Several thermocouples were installed longitudinally-arranged in the centre position in width of the casting mould. The temperatures measured by the thermocouples during casting are shown in Fig. 13. The temperatures decreased as the distances from meniscus increased. While the each temperature shown in Fig. 13(b) is a little higher than ones in Fig. 13(a), it is an acceptable difference. If a poor flow of mould flux between the mould and the initial solidified shell or unstable heat transfer in the flux film occurred, the temperatures measured by the thermocouples would show a large change though the casting. Figure 13, however, expresses that the temperature changes seen in the casting with the developed mould flux are as small as with the conventional one. It is demonstrated that stable casting is achieved by using the fluorine-free mould flux.

Temperatures measured by thermocouples installed the casting mould during casting with (a) conventional and (b) developed mould fluxes.
In the present study, the fluorine-free mould flux has been developed. Na2Ca2Si3O9 turned to be available for main crystalline phase in the flux film in the mould, instead of cuspidine for the conventional. The reasonable viscosity for lubrication is obtained by adjusting the contents of the basic components without fluorine. In the actual casting, the developed flux brings stable lubrication, heat transfer and surface quality of without any cracking.