Regular Article
DEM Simulation of Burden Distribution in the Upper Part of COREX Shaft Furnace
2013 Volume 53 Issue 6 Pages 1002-1009
Details
2013 Volume 53 Issue 6 Pages 1002-1009
The role of COREX shaft furnace plays is similar with that of lump zone in blast furnace, but there are still some differences existed between them, especially the burden distribution. However, the research on burden distribution in COREX shaft furnace is quite few. Therefore, a three dimensional model is established in present work based on Discrete Element Method (DEM), after validated by industrial experiments, the model is used to investigate the burden profiles and distribution along radius in the upper part of COREX shaft furnace, the studied parameters include the distributor angle, rotating speed and length, and the stock line. The results show that the distributor angle affects the burden profile most, stock line is next, while rotating speed and length of distributor are least. The small particles segregate more intensively than large and medium particles. Additionally, it is better to reduce the distributor length and stock line in order to obtain a stable burden distribution along radius.
COREX process is a kind of nonblast furnace smelting reducing ironmaking technology, designed for meeting resource and environmental demands.1,2,3,4) And it has realized industrial scale in South Africa, Korea and India, especially the largest plant C-3000 at Baosteel in China.5,6,7) According to the practical operation, it has been found that the quantity and quality indexes of COREX process are directly determined by the shaft furnace operation.8,9,10,11) Although the role of shaft furnace plays is similar with that of lump zone in blast furnace, there are some differences existed between them in terms of gas composition and distribution, as well as burden distribution, which is of significant importance for shaft furnace.1,12)
Many researchers including the authors pay much attention to burden distribution in blast furnace numerically and experimentally,13,14,15,16,17) while few researchers studied burden distribution in COREX shaft furnace for its short history and few instruments. Li Qiang et al.18) investigated the effect of distributor parameters on the radial bulk density basing on a cold model of COREX Shaft Furnace. He then studied the characteristics of binary size burdens movement based on the Discrete Element Method (DEM).19) However, the model he developed is not the same size as that in practice, besides, the distributor is fixed in his model, while it is rotating during discharging burdens. Therefore, it’s of great necessity to study the burden distribution in COREX shaft furnace by establishing an actual size model with a rotating distributor.
The method adopted in present work is DEM, originated from Cundall and Strack,20) which has become one of the most popular and reliable simulation methods for granular behaviors. In the ironmaking field, plenty of papers about the burden distribution found that the simulation results basing on DEM coincided well with the experiments and industrial operation.14,15,21,22,23,24,25,26)
In present work, a three dimensional model of charging system in COREX shaft furnace is established basing on DEM. After validated by industrial experiments, this model is used to investigate the effects of some factors on the burden profiles and size distribution along radius, such as distributor angle, rotating speed and length, and the stock line.
In DEM, it is described as inter-particle model, shown in Fig. 1, that a particle may collide with neighboring particles or wall.20,24) The model is simplified as spring and dashpot in normal direction, spring, dashpot and slider in tangential direction. Figure 2 illustrates the interactive forces between particles. At any time τ, the governing equations for particle i can be written as follows.25,26,27)
| (1) |
| (2) |

The contact model in DEM.

Interactive forces between particle i and j.
| Forces and torques | Symbols | Equations |
|---|---|---|
| Normal contact force | Fcn,ij |
|
| Normal damping force | Fdn,ij |
|
| Tangential contact force | Fct,ij |
|
| Tangential damping force | Fdt,ij |
|
| Torque by tangential forces | Mt,ij |
|
| Rolling friction torque | Mr,ij |
|
Where, Eij=[(1-υi2)/Ei+(1-υj2)/Ej]–1, Rij=(1/Ri+1/Rj)–1, mij=(1/mi+1/mj)–1, G=E/(2+2υ), Gij=[(1-υi)/Gi+(1-υj)/Gj]–1, ς=[lne/(π2+ln2e)1/2]1/2, n=δn,ij/|δn,ij|, t=δt,ij/|δt,ij|, Vij=Vj–Vi+ωj×Rj–ωi×Ri, Vn,ij=(Vij·n)·n, Vt,ij=(Vij×n)×n. Note that the tangential forces (Fct,ij+Fdt,ij) should be replaced by the maximum friction force μs|Fcn,ij + Fdn,ij|t when they are larger than later force.
Similar with the chute in blast furnace, COREX adopts GIMBAL distributor to discharge the burden from hopper to the shaft furnace circumferentially even. Since this paper mainly focuses on the burden distribution in the shaft furnace after falling from GIMBAL distributor, the model in the simulation is not the whole shaft furnace, but only the upper part with charging system. Thus the paper establishes a three-dimensional model, shown in Fig. 3, whose size is just the same as the COREX shaft furnace used in Baosteel.

Three dimensional model used in the simulation.
The height from the bottom of shaft furnace in Fig. 3 to the end of GIMBAL distributor at still condition is 5 m, which is right the stock line in practice, thus the results of simulation and industrial experiments can be easily compared under the same condition. The parameters in the simulation are the same as that of industrial operation, for example, the distributor angle between the centerlines of distributor and shaft furnace is 20°, and the rotating speed is 0.523 rad·s–1.
In Baosteel, COREX shaft furnace is charged with mixture burden of ore, pellet, coke and flux from the hopper and distributor. As the burden sizes range widely, it will take numerous time to carry out the simulation according to the actual sizes of burden. Thus the simulation select coke as the object, for two reasons: firstly, the volumes of coke and pellet are relatively larger than other burden materials, so it’s better to choose coke or pellet; secondly, over 90% pellets’ sizes concentrate between 10 mm and 12.5 mm, it will too difficult to distinguish the size segregation clearly and the simulation results will also be unpersuasive. The detailed coke particle conditions are tabulated in Table 2, in which the sizes are adjusted relatively 2.5 times bigger than actual ones in order to reduce the calculated particles’ number.
| Parameters | Large | Medium | Small | Unit |
|---|---|---|---|---|
| Diameter | 101.88 | 64.38 | 35.00 | mm |
| Mass ratio | 27.66 | 53.05 | 19.29 | wt% |
| Number of particles | 4552 | 34494 | 78132 | – |
The geometries in simulated model, including hopper, GIMBAL distributor, shaft furnace and so on, are made of steel, and they are called wall generally. Table 3 presents the detailed parameters in the simulation.
| Parameters | Symbols | Particle | Wall | Unit |
|---|---|---|---|---|
| Density | ρ | 1100 | 7850 | kg·m–3 |
| Shear modulus | G | 2.2×10⁶ | 7.9×10¹⁰ | Pa |
| Poisson’s ratio | υ | 0.22 | 0.30 | – |
| Static friction coefficient | μs | 0.60 | 0.40 | – |
| Rolling friction coefficient | μr | 0.15 | 0.05 | – |
| Restitution coefficient | e | 0.50 | 0.50 | – |
| Time step | τ | 1×10⁻⁵ | s | |
Where, the static friction coefficients of particle and wall stand for the coefficient of particle-particle and particle-wall, respectively, so do the rolling friction coefficient and restitution coefficient.
Firstly, ternary well-mixed cokes, about 15000 kg, are generated in the hopper. Then open the gate at the bottom of hopper to discharge cokes from the hopper. And the GIMBAL distributor works at the same time. Stop the simulation at any time during discharging, like 63s, to obtain the snapshots of cross section in the GIMBAL distributor shown in Fig. 4, where L is the length of GIMBAL distributor. It can be seen that the small and medium size coke particles generally slide on the bottom of distributor, while the large ones tends to move away from the bottom. And it can be also found that the small and medium particles are likely to have greater angular velocity than the large ones for their smaller mass. These phenomena have been found by previous research,21) therefore it can be a proof that the simulation in this paper is suitable.

Snapshots of cross section in the GIMBAL distributor at different parts (a) 0.25L, (b) 0.50L, (c) 0.75L and (d) 1.00L. (Online version in color)
In order to acquire the burden profile after discharging, a slide with certain width, through the shaft center and vertically to the horizontal plane, has been extracted. The burden profile has been measured by experiments performed in industrial furnace as well. The method is as follows, firstly, select a horizontal plane above the burden surface as the reference plane; secondly, measure the depths from the plane to the burden surface by using a plumb along radial direction in fixed interval; thirdly, convert these depths into the burden heights; at last, connect the discontinuous heights with line segments, thus the burden profile is obtained. Figure 5 gives the comparison of burden profiles between simulation and experiments, where the black line with squares and the colored particle are the results of experiment and simulation respectively. And the black, white and grey particles represent the large, medium and small cokes respectively. It can be seen from Fig. 5 that the burden profile of simulation coincides well with that of experiments. So it can be another proof of the suitable simulation.
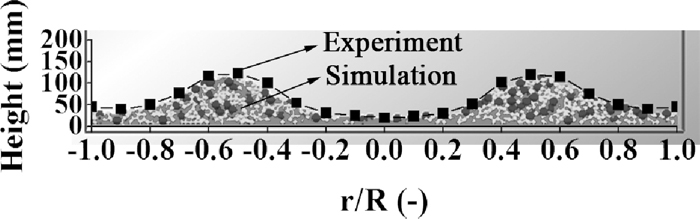
Burden profiles of experiment and simulation.
A series of same cuboids with square bottom are extracted from the burden along plus-minus X and Y directions after discharging, and then measure the qualities of each size cokes in every cuboids. The qualities of all the cokes along the above four directions almost have no difference, thus the average qualities are selected to represent the burden qualities along radius. The comparison of coke qualities has been made between simulation and experiments, shown in Fig. 6, where the radius has been normalized.

Comparison of coke qualities between experiments and simulation.
In Fig. 6, coke qualities along radius of experiments are larger than those of simulation since the cuboids used in the experiments are bigger for containing cokes. Though the measured points of coke qualities in experiments are fewer, the tendency of experiments coincides well with that of simulation in spite of the values. As a result, the model basing on DEM has been validated and can be used to carry out further simulation.
The qualities of each size are presented in Fig. 7. The qualities of three size cokes show almost same tendencies along radius, which increase at first, and then decrease after a maximum.

Coke qualities of each size along radius.
However, the particle segregations can’t be obtained easily just according to Fig. 7. Thus the Segregation Index (SI) is induced so as to evaluate the particle size segregations clearly, and it can be expressed by Eq. (3).
| (3) |
It can be found that the SI of three kinds of coke shows different tendencies along radius from Fig. 8. Specifically, SIL increases gradually in general along radius; SIM rises at first, then fluctuates little in the middle, decreases at last; while SIS is almost opposite to SIM. This is because that large and medium particles locate further from the from the centerline than small ones during slide from the distributor, which results in the same phenomenon in the burden stream, thus these particles are relatively easy to roll toward the wall. It can be also seen that SIS fluctuates heavier than SIL and SIM, so the standard deviation is adopted to calculate the segregation degree. The standard deviations from large to small particles are 0.162, 0.142 and 0.520, which implies that small particles segregate heaviest, and large and medium particles segregate relatively lighter. The reason is that small particles strike to the burden close to the center, and also they penetrate easily between large and medium particles.
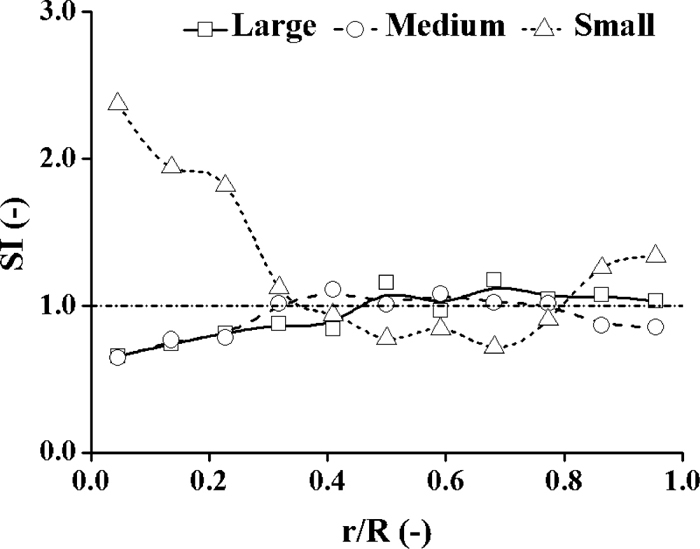
SI of each size coke along radius.
In consideration of practical operation and some adjustable parameters in actual COREX shaft furnace, the model is used to study the influence of some factors, like distributor angle, rotating speed and length, and stock line, on burden profiles and particle size segregations. Table 4 lists the factors and values investigated in the simulation.
| Factors | Values | Unit |
|---|---|---|
| Distributor angle | 10°, 20° and 30° | ° |
| Rotating speed | 0.523, 1.047 and 1.570 | rad·s–1 |
| Distributor length | L, 2L and 3L | m |
| Stoke line | 4, 5 and 6 | m |
Where, the length of GIMBAL distributor is short for L due to the confidentiality agreements with Baosteel.
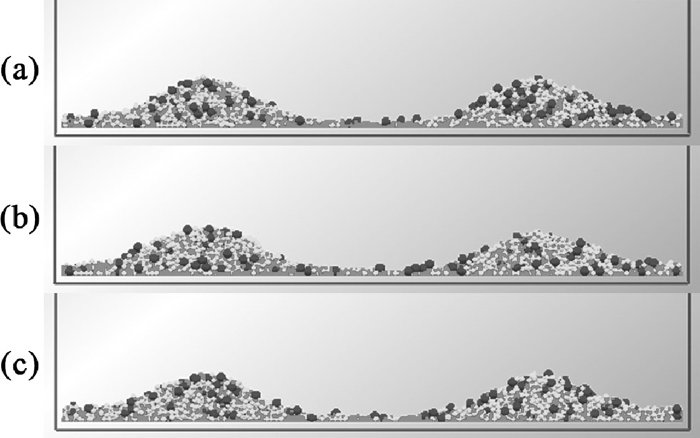
Figure 9 shows the burden profiles at different distributor angles. When the distributor angle changes from 10° to 30°, the position of burden apex moves towards the furnace wall, and the height of burden apex decreases. This is because that the main burden streams strike further, specifically, the striking points are about 0.32 R, 0.50 R and 0.68 R, respectively, thus the burden apex heights reduce for the fixed burden volume.
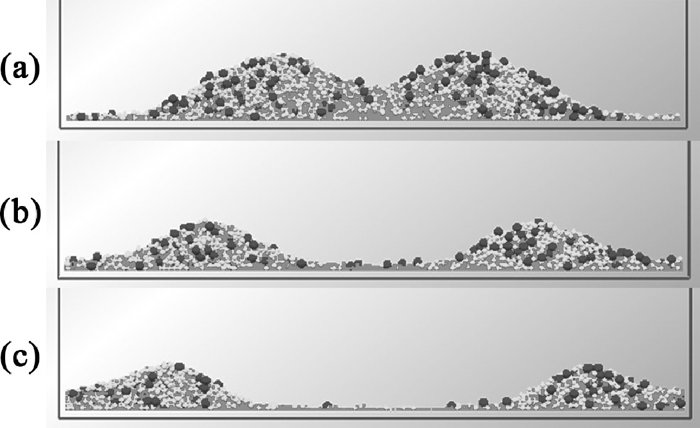
Burden profiles at the distributor angles of (a) 10°, (b) 20° and (c) 30°.
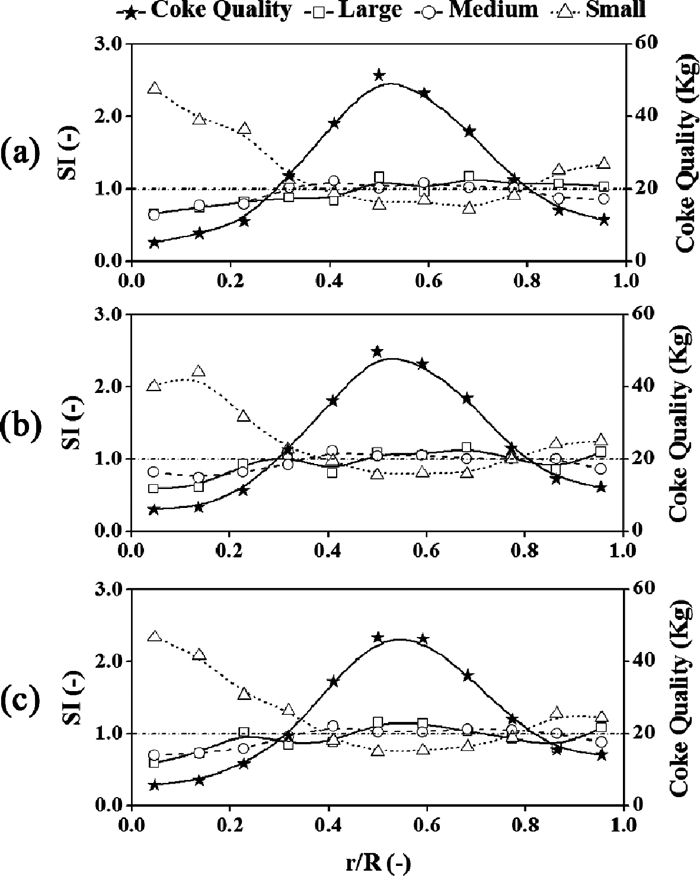
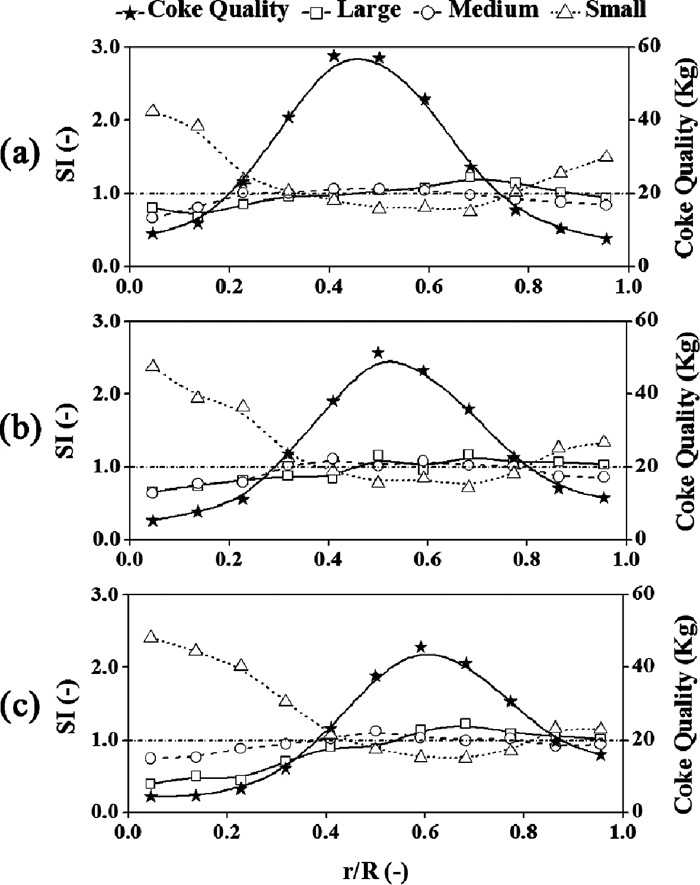
Figure 10 illustrates the burden qualities and SI along radius. Since burden profile and coke qualities along radius coincide well with each other, the coke quality line along radius in Fig. 10 is to provide a reference for the explanation of SI.
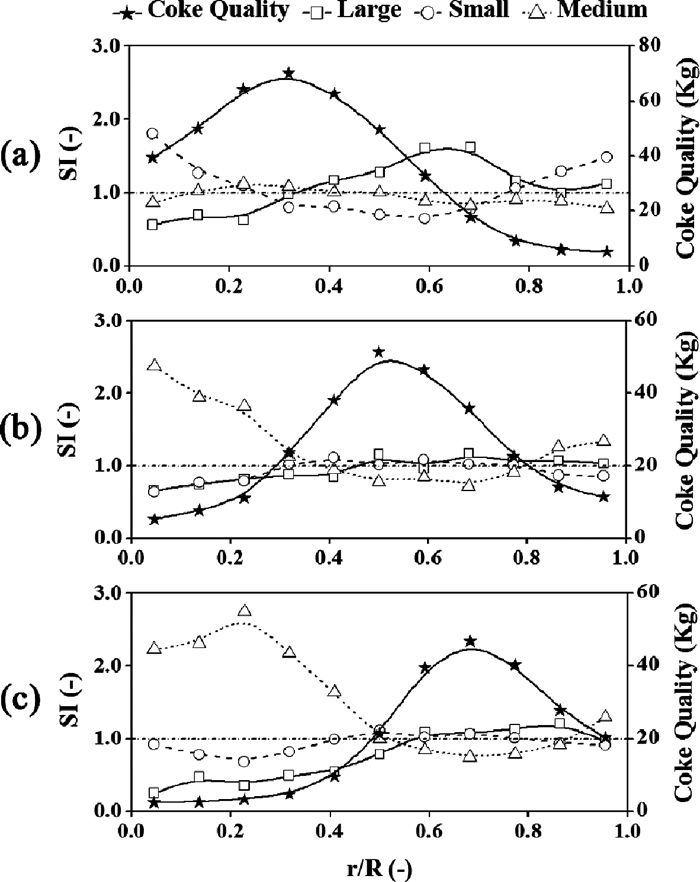
Coke qualities and SI along radius at the distributor angles of (a) 10°, (b) 20° and (c) 30°.
In Fig. 10(a), the SIM tendency along the radius stays changeless but a little decrease, however, the SIL and SIS tendencies change greater, in detail, the SIS along radius is almost “U”-shape like, while the SIL tendency shows an opposite tendency to SIS. The SIL bigger than 1.0 is left to the apex of coke quality, which means that the large cokes tend to roll towards furnace wall. On one hand, SIS is large near the furnace center because the small cokes are at the inner side of burden stream and they can percolate between other particles. On the other hand, it is large near the furnace wall for the hit of large and medium cokes, the percolation of small particles as well. The standard deviations of SIL, SIM and SIS are 0.339, 0.104 and 0.351, respectively, which also proves that the segregations of large and small cokes are heavier than medium ones.
In Fig. 10(c), the SIL and SIM show similar tendency along radius, which go up initially and then stay unchanged, and decrease a little finally. This means that the large and medium cokes concentrate around the apex of burden quality line. The phenomenon is caused by that the room is not enough for them to roll between burden stream and wall. While SIS generally reduces at first and then stays invariant, and rises a little in the end. This is because the small cokes are compelled to percolate and roll towards the inner part for this reason. As for the first part of SIS tendency, it rise a little to the largest, this can be explained that the total coke qualities there are so small that few particles affect great for SI. In the terms of standard deviation, they are 0.331, 0.123 and 0.699 from large to small cokes. It can be concluded that the segregations of small cokes are the heaviest. The SI standard deviations at different distributor angles are tabulated in Table 5.
| Distributor angle | SIL | SIM | SIS |
|---|---|---|---|
| 10° | 0.339 | 0.104 | 0.351 |
| 20° | 0.162 | 0.142 | 0.520 |
| 30° | 0.331 | 0.123 | 0.699 |
It can be found that the standard deviation of SIS is the largest while SIM is the smallest no matter how many the angles are. When the distributor angle increases, the standard deviations of SIL go down and then rise, the SIM changes little, while the SIS rises greatly. So it can be confirmed that the segregations of small cokes grow severe with the angle rising, and the segregations of large cokes are relatively slight when the angle is not too large or small.
4.2. Distributor Rotating SpeedThe burden profiles, shown in Fig. 11, are nearly the same at different rotating speeds. So the coke qualities along radius are induced in order to investigate whether there exits some differences or not, and the comparison result is given in Fig. 12.
Burden profiles at the rotating speeds of (a) 0.523 rad·s–1, (b) 1.047 rad·s–1 and (c) 1.570 rad·s–1.

Coke qualities along radius at different rotating speeds.
It can be found that the apexes of coke quality line transfer to right a little along the radius, and the coke qualities values of the apex decline from 51.4 kg to about 47.2 kg with the distributor rotating speed increasing. Meanwhile, the coke qualities near the wall side are from 11.4 kg to 14.1 kg, showing an increase tendency. All the above phenomena imply that the burdens are likely to strike a little further while the distributor rotating speed rises.
Figure 13 provides the burden qualities and SI along the radius. The SI tendencies are almost the same except for few points comparing with the base model whose rotating speed is 0.523 rad·s–1. So it suggests that the distributor rotating speed has little effect on coke particle size segregations.
Coke qualities and SI along radius at the rotating speeds of (a) 0.523 rad·s–1, (b) 1.047 rad·s–1 and (c) 1.570 rad·s–1.
Table 6 lists the standard deviations of SI at different rotating speed. The standard deviations of SI don’t change much with the rotating speed varying. It shouldn’t be ignored that the standard deviation of SIS is the largest, which implies that small cokes segregate much in spite of rotating speed.
| Rotating speed | SIL | SIM | SIS |
|---|---|---|---|
| 0.523 rad·s–1 | 0.188 | 0.113 | 0.465 |
| 1.047 rad·s–1 | 0.162 | 0.142 | 0.520 |
| 1.570 rad·s–1 | 0.170 | 0.136 | 0.510 |
The burden profiles at different distributor lengths are presented in Fig. 14. There seems to be no difference among the three burden profiles. Thus the burden quality lines along radius are used to check it quantitatively in Fig. 15.
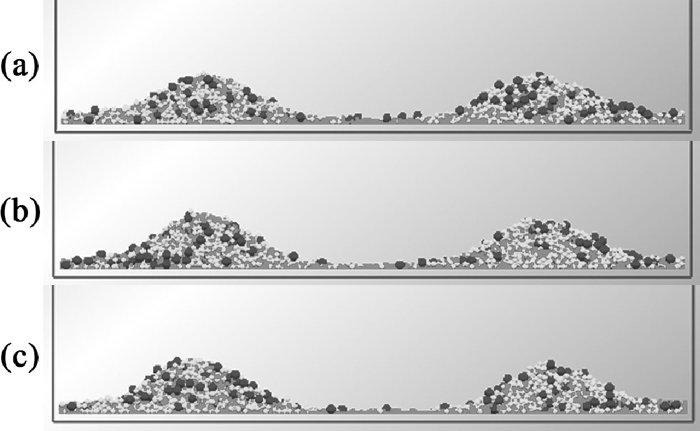
Burden profiles at the distributor lengths of (a) L, (b) 2L and (c) 3L.

Coke qualities along radius at different distributor lengths.
Generally, the burden quality profiles shift towards wall direction slightly, and the left half moves greater than the right half. This is because that the height between distributor and burden surface becomes shorter when the distributor length rises, which leads the burden to strike further from the center. While the velocities become smaller, which means that the energies are not great enough to roll further for the right half burden.
Figure 16 shows the burden qualities and SI along radius. The tendencies of SI at different distributor lengths are nearly the same, specifically, SIL and SIM increase at first 0.3 R and then fluctuate about 1 along radius, SIS tendency seems like a “U” shape. The calculated standard deviations of SI are list in Table 7.
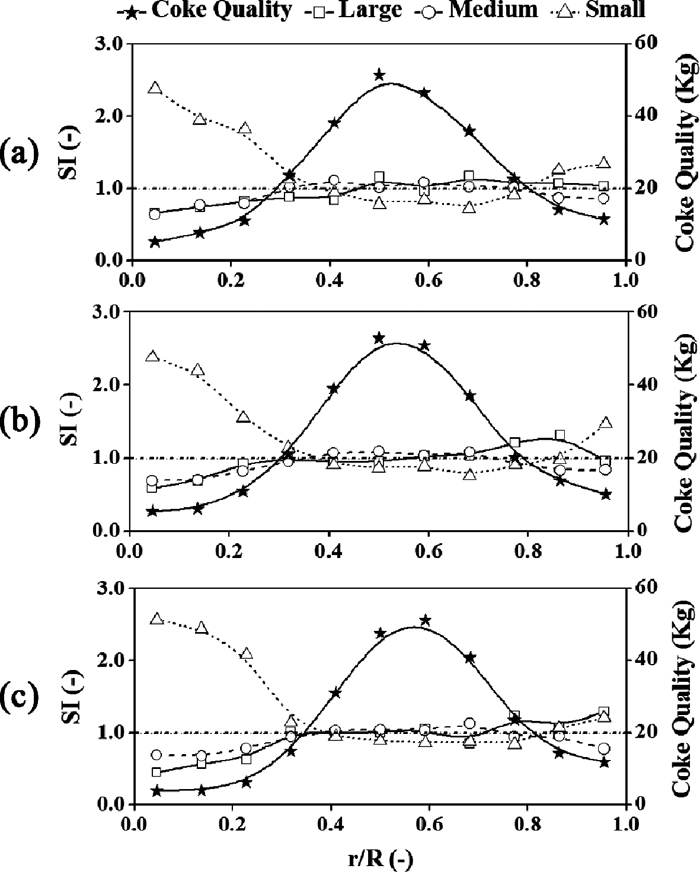
Coke qualities and SI along radius at the distributor lengths of (a) L, (b) 2L and (c) 3L.
| Distributor lengths | SIL | SIM | SIS |
|---|---|---|---|
| L | 0.162 | 0.142 | 0.520 |
| 2L | 0.194 | 0.141 | 0.534 |
| 3L | 0.258 | 0.146 | 0.636 |
It can be found that the standard deviations of SIL and SIS are getting larger while the SIM almost keeps unchanged with the increase of distributor length. This is the result of narrower burden stream width, which forms severe size segregations along the whole radius. Hence it implies that shorter distributor length can help to reduce the segregations.
4.4. Stock LineIn terms of stock line, it can be simply regarded as the height between the end of distributor and the burden surface. Figure 17 displays the burden profiles at different stock lines.

Burden profiles at the stock lines of (a) 4 m, (b) 5 m and (c) 6 m.
When the stock line goes up, the burden profile apex is likely to move towards the wall direction, and the height declines at the same time. In detail, the positions of burden apex are about 0.45 R, 0.50 R and 0.59 R, respectively. The main reason is that the burden streams strike further from the furnace center since the burden discharged from the distributor travels longer with the stock line rising.
Figure 18 shows the burden qualities and SI along radius at different stock lines. For all the cases of stock line, the SIL displays the similar tendency along radius, so do the SIM and SIS. So it infers that the stock line has little influence on the SI tendency. However, the segregation degree is not the same quantitatively, the results of standard deviations are given in Table 8.
Coke qualities and SI along radius at the stock lines of (a) 4 m, (b) 5 m and (c) 6 m.
| Stock lines | SIL | SIM | SIS |
|---|---|---|---|
| 4 m | 0.147 | 0.118 | 0.440 |
| 5 m | 0.162 | 0.142 | 0.520 |
| 6 m | 0.280 | 0.109 | 0.582 |
It can be found that SIL and SIS increase with the rise of stock line, which means that the segregations of large and small cokes become more intensive. So it’s better to decline the stock line in order to obtain the relatively uniform distribution along radius.
The paper establishes a three dimensional model validated by experiments in order to study the burden profiles and coke size segregations along radius in the upper part of COREX® shaft furnace basing on DEM. The factors simulated in the paper include GIMBLE distributor angle, rotating speed and length, and stock line. Generally, the smaller the particle is, the larger angular velocity it has. And the small particles are likely to press to the GIMBLE distributor bottom. These phenomena mean that the segregations of angular velocity and particle size happen on the GIMBLE distributor, which directly results in the burden segregations in shaft furnace. Additionally, the small particles segregate more intensively than large and medium particles in shaft furnace.
In terms of the ranges of factors investigated in the paper, the distributor angle affects the burden profiles most greatly, the next is stock line, while the rotating speed and length of distributor affect least. When the factors increase, the standard deviations of SIS increase for distributor angle, length and stock line, almost stay unchanged for distributor rotating speed; while the standard deviations of SIL firstly decrease and then increase for distributor angle, fluctuate a little for distributor rotating speed, increase for distributor length and stock line; the standard deviations of SIM fluctuate a little for all the factors. Therefore, in order to achieve a uniform burden distribution along radius and smooth operation in COREX shaft furnace, it is recommended to decline the length and stock line, keep the distributor angle at 20° position.
This work is an initial explore on burden distribution in COREX shaft furnace by using DEM, further simulation will be carried out for the consideration of the irregular particle shape. And the simulation will also take the effect of gas flow, particle softening and shrinkage, multiphase flow including thermo-chemical behavior into account inside the entire shaft furnace or even the COREX process. Work in this direction is undertaken and will be reported hopefully in the future.
e: restitution coefficient (–)
E: Young’s modulus (Pa)
F: force between particles (N)
g: gravitational acceleration (m·s–2)
G: shear modulus (Pa)
I: moment of inertia (kg·m–2)
K: particle number in contact with particle i
m: mass of particle (kg)
M: torque on particle (N·m)
n: unit vector in normal direction
R: particle radius (m)
t: unit vector in tangential direction
V: velocity (m·s–1)
Greek letters
δ: displacement (m)
ζ: damping ratio (–)
μ: friction coefficient (–)
ρ: density (kg·m–3)
τ: time (s)
υ: Poisson’s ratio (–)
ω: angular velocity (rad·s–1)
Subscripts
c: contact
d: damping
i: ith particle
ij: between particle i and j
j: jth particle
n: normal component
r: rolling
s: static
t: tangential component
k: kind of coke size
The authors would like to appreciate much for the anonymous reviewers and editors for the improvement of this work, and Mr. Jian Xu from Chongqing University for suggestions on this work and Miss Daichun Wei for language review.