Regular Article
In-situ X-ray Transmission Observation of Carbothermic Reduction of Magnetite Powder and Macroscopic Agglomeration of Reduced Iron
2013 Volume 53 Issue 6 Pages 1010-1019
Details
2013 Volume 53 Issue 6 Pages 1010-1019
The agglomeration behaviour of reduced iron, made from magnetite powder by carbothermic reduction, was observed by using the in-situ X-ray transmission observation technique. The iron particles, above 1 mm, were clearly observed as black points. Further, the reduction speed was examined by using the thermogravimetric analysis. The bulk density of the packed powder layer and the grain size distribution of magnetite powder and carbon black powder were changed and the effects of them on the reduction speed and the agglomeration degree were examined. The agglomeration degree was evaluated with diameter of iron particles on the X-ray photographs, taken during heating, and the weight of collected iron particles after the observation experiments. Neither the bulk density of powder layer nor the grain size distribution of powder mixture affected to the reduction speed. The agglomeration degree decreased when the bulk density of the powder layer was increased by compacting. On the other hand, the agglomeration degree was increased when the grain size distribution of powder mixture was widened. Further, the height change of powder layer was also measured on the X-ray photographs and compared with the iron particles appearing behaviour to estimate the microscopic agglomeration behaviour. The mechanisms that grain size distribution affected the agglomeration degree were discussed.
In recent years the iron making process with the blast furnace faces two significant problems. One is increasing of amount of poor quality iron ore.1) The term “poor quality” refers to low Fe content and low sinterability. Low Fe content ore require concentration process that grinds ore and separate Fe-rich ore from gangue by various separation techniques such as magnetic concentration, gravity concentration, flotation, etc. Thus concentration made of low Fe ore is fine powder. Such fine powdery ore needs sinter process to feed it to blast furnace. However, yield ratio of sinter decreases when the fine powder raw material rate increases. Further, low sinterability is also adverse to make sinter. Skinner2) reported that a relation between the quality and the prospect of the iron ore is a normal distribution. Thus far, highest grade iron ore has used. Thus the ratio of poor quality iron ore production should keep increase in future and it is essential to establish a technique to utilize such poor quality ore for sustainable growth of iron making process.
Another problem is CO2 emission. Leaders of the G8 countries made the agreement to reduce CO2 emissions, a cause of global warming, at least in half by the year 2050 at the 34th G8 summit in 2008. The amount of emission from steel making accounts for 14% of total emission from Japan. Hence, steel companies bear grave responsibility. Several researchers have attempted to utilize powdery material to reduce CO2 emission in iron making process. Nagata et al.3) reported that the powdery material have larger specific surface and the reaction temperature can be decreased. The carbon composite pellet is expected as a material to utilize the powder in blast furnace.
Further, two of authors4) have been developing new iron making system using microwave heating. In this system, the powder mixture of magnetite-ore and graphite was heated by microwave and molten pig iron was obtained. The features of this process are high-speed heating by using microwaves and high-speed reaction by using the powder mixture of ore and graphite. The reduction of CO2 emission is also expected by using electrical energy.
In the earlier studies, the carburization, the strength of composite pellets and separation behaviour of iron and slags have been investigated.5,6) In addition to these phenomena, agglomeration of iron particles is an important phenomenon for processing time. Reduced iron is fine particles and they are mixed with solid particles such as carbon when the powder mixture of iron ore and carbonaceous materials is used. How these fine iron particles grows is focused on in this research.
The agglomeration is the phenomenon including the coalition and the coalescence of melted iron particles. Hence, increasing the chance to meet melted iron particles each other should be effectual approach to enhance the agglomeration. The chance to meet particles each other is increased by increasing contact number of particles. The contact number increases when the bulk density of powder layer is high or the grain size distribution is wide.7) Thus this study aims to investigate the influence of the bulk density of the powder layer and the grain size distribution of the powder on the agglomeration. The X-ray transmission observation technique was employed for the in-situ observation of powder layer. The X-ray permeability of reduced iron is lower than that of iron oxide and carbonaceous materials. Hence, the difference of these materials can be recognized as contrast in X-ray photo due to the difference of X-ray permeability. Further, the weight change degree, iron collecting ratio and maximum size of collected iron were also measured as indexes of the agglomeration degree. The height change of powder layer was also measured from the X-ray photographs and compared with iron particles appearing behaviour to estimate the microscopic changing of powder layer.
The influences of bulk density of powder layer and grain size distribution of powder on reduction speed were investigated by the thermogravimetric analysis (TGA). The iron oxide and the carbon black was same grade with which is used for the X-ray observation experiments. The chemical composition of iron oxide is shown in Table 1. Fixed carbon contained in carbon black powder was 99.9+ mass%. Three different samples which have different bulk density and grain size distribution were subjected to experiments (Table 2). Mixing ratio of iron oxide and carbon black was same with that of samples for the X-ray observation, viz., 82:18. The bulk density was calculated by dividing the weight of the sample by the product of the crucible bottom area and the height of the packed sample. A schematic illustration of the TGA apparatus is shown Fig. 1. Three hundred milligrams was put into the alumina crucible (I.D.: 8 mm, O.D. 10 mm. Depth: 14 mm, Height: 15 mm) and was hanged with a Pt–Rh wire in the furnace. B-type thermocouple which was placed near the bottom of the crucible was used for the temperature measurement. The chamber was flushed by Ar gas (> 99.999 vol.%) before the measurements. Flow rate of Ar gas was 50 ml/min during heating. Heating rate was 5°C/min. The result was corrected by using baselines that were obtained from the TGA experiments with an empty crucible.
| Composition | Fe3O4 | SO3 | SiO2 | SnO2 | MnO | Al2O3 | Cr2O3 |
|---|---|---|---|---|---|---|---|
| Coxide mass% | 97.40 | 1.12 | 0.72 | 0.29 | 0.24 | 0.16 | 0.07 |
| Sample No. | i | ii | iii |
|---|---|---|---|
| Iron oxide | 82 mass% Magnetite | ||
| Grain size | 45–71 μm | < 325 μm | |
| Carbon | 18 mass% Carbon black | ||
| Grain size | 45–50 μm | < 74 μm | |
| Bulk density | 0.62 g/cm3 | 2.31 g/cm3 | 0.76 g/cm3 |
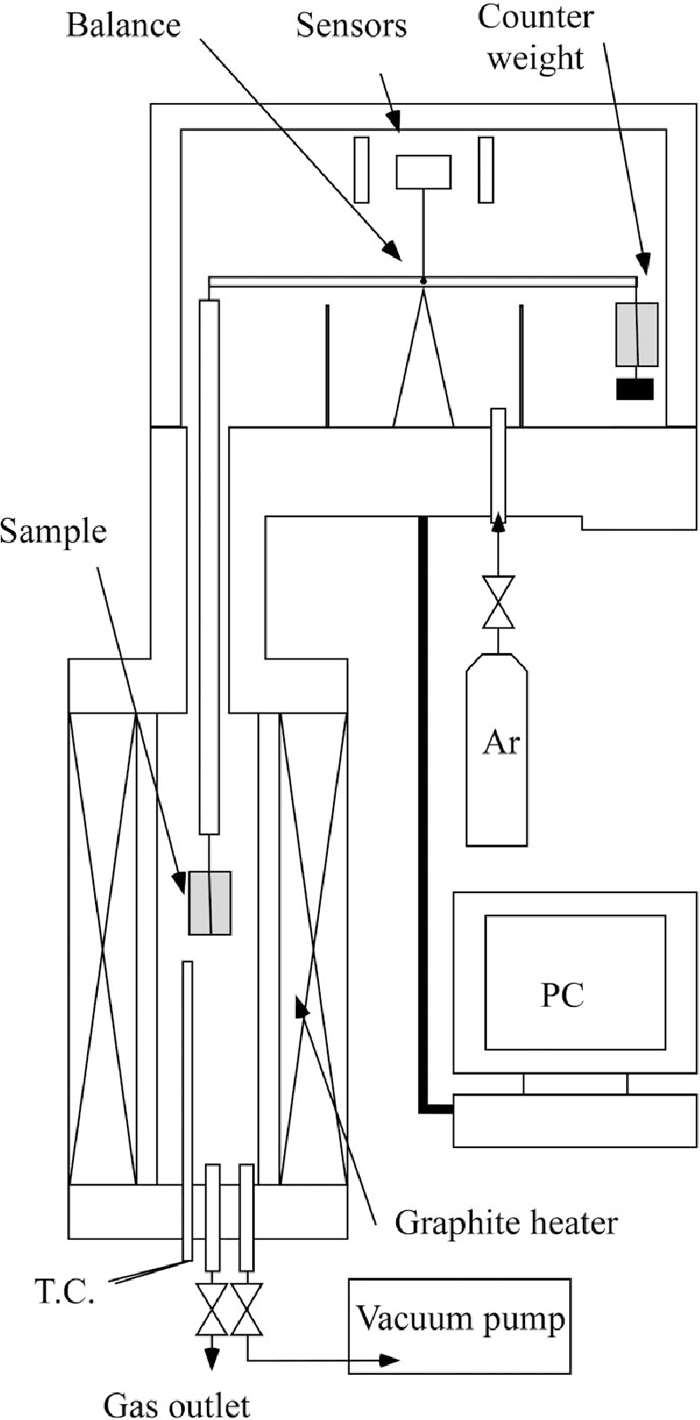
The schematic illustration of the thermogravimetry.
Three samples were prepared as shown in Table 3. The differences between them were similar to TGA, the grain size distribution and the bulk density. Since iron ore used at industrial plants contains sulphur, the iron oxide which contains sulphur was used for the experiment as well. Sulphur reduces surface tension of iron and should affect the behaviour of reduced iron in the powder layer. The mixing ratio of iron oxide and carbon black, 82:18 in mass ratio, was determined by taking into account the amount of carbon required for reducing magnetite completely and forming CO gas as well as carburizing so as to obtain iron containing 2 mass% of carbon. The samples were put into alumina crucibles (I.D.: 30 mm, O.D.: 35 mm, Depth: 47 mm, Height: 52 mm) and the powder layer’s bulk density of samples was calculated in the same manner as that of samples for the TGA. Since bulk density of the sample I, packed with natural drop, was lower than that of the others, the powder layer of the sample I was compressed by using a disk. Bulk density of the sample II was locally changed by embedding two green pellets in the powder layer as shown in Fig. 2 while sample II was prepared so that overall bulk density becomes same with the others. These two pellets were made by compressing the powder by means of the oil hydraulic cylinder. The powder mixture used for these pellets was same with which for the powder layer of sample II, i.e., the difference between the powder layer and the pellets of sample II was only the bulk density. Grain size distribution was changed by using different size of grain which is separated by sieves.
| Sample No. | I | II* | III |
|---|---|---|---|
| Iron oxide | 82 mass% Magnetite | ||
| Grain size | 45–71 μm | < 325 μm | |
| Carbon | 18 mass% Carbon black | ||
| Grain size | 45–50 μm | < 74 μm | |
| Bulk density | 0.52 g/cm3 | 0.51* g/cm3 | 0.52 g/cm3 |
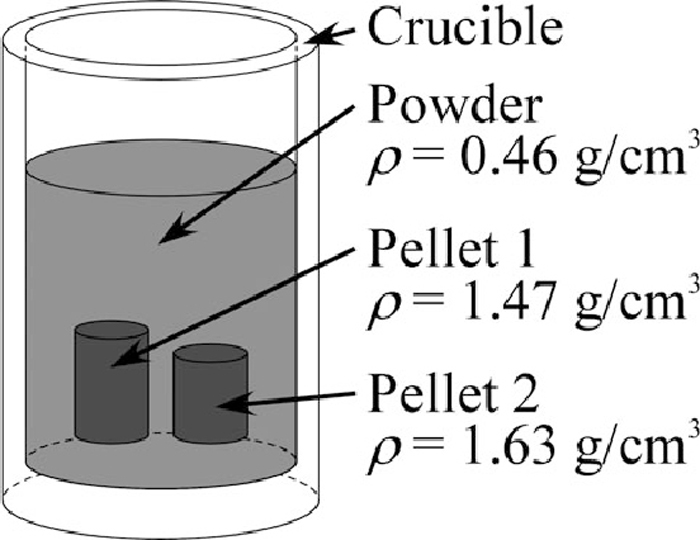
The schematic illustration of the sample II for the X-ray observation, two green pellets were embedded in the powder layer.
A schematic illustration of the X-ray observation system with vertical type graphite heater furnace is shown in Fig. 3. The sample was put in a smaller crucible (the size was mentioned above) and the smaller crucible was put in a larger protective alumina crucible (I.D.: 46 mm, O.D.: 52 mm, Depth: 72 mm, Height: 75 mm) for safety. The temperature difference in the heating zone was within 5°C. A B-type thermocouple was placed immediately above the top surface of the powder layer. Temperature difference between internal and above of the powder layer was within 25°C. The heating room was flushed by Ar gas (> 99.999 vol.%) before the measurement. Flow rate of Ar gas was 50 ml/min during heating. The sample was maintained at constant temperature at around 1315°C and 1500°C for 20–25 min. The heating rate before and after the isothermal holding was 5°C/min.
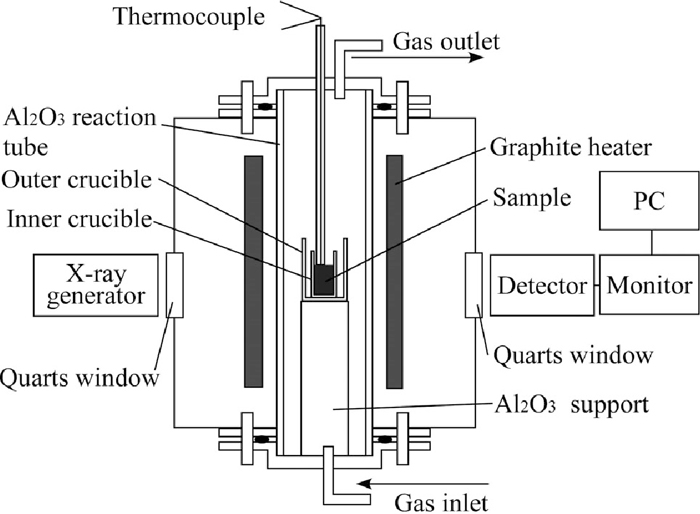
The schematic illustration of the X-ray observation system with vertical type graphite heater furnace.
The dynamic X-ray photography was used for in-situ observation of the powder layer of the samples. The furnace was placed between the X-ray source and the detector. The wall of the furnace was equipped with two quarts windows (Dia.: 40 mm) for improve radiolucency. X-ray propagates through the components of furnace and the sample set in the furnace. These materials decrease X-ray intensity. In particular, there are not only the magnetite and the carbon black (initial materials) but also reduced wustite and iron. Hence, X-ray intensity at the detector, decreased by these materials, is different by location and the differences appear as the contrasts of X-ray photographs. In other words, if an X-ray which propagated through more reduced iron particles than another X-rays reached at a part of the detector, this part should be darker than another part in an X-ray photograph. The X-ray photographs were recorded on a PC. X-ray intensity of the source was adjusted to increase the contrasts of X-ray photographs.
Furthermore, the height changes of the powder layer and the pellets in the X-ray photographs were measured. The heights of them in the photographs were calibrated with measurements of an iron sphere with a known diameter. In order to evaluate the height of the powder layer and the pellets on the same basis, the height change rate, hr, was introduced as follows:
| (1) |
After the isothermal holding at around 1500°C, the temperature decreased to room temperature and the crucible was removed from the furnace. Optical photographs of the top surface of the powder layers and bottom of the crucibles were taken from above. The weight change ratio was calculated by dividing the final weight by initial weight of sample. Further, iron particles above 0.3 mm in the crucibles were collected to calculate metallic iron collecting ratio, Rm, as follows:
| (2) |
Carbon and sulphur contents of the collected iron particles were analysed with combustion-infrared analyser.
The weight change curves of samples i, ii and iii, the results of the TGA, are shown in Fig. 4. The difference of the weight change rate between the samples was within 3 mass% at each temperature.

The weight change of the samples i, ii, and iii with temperature increasing.
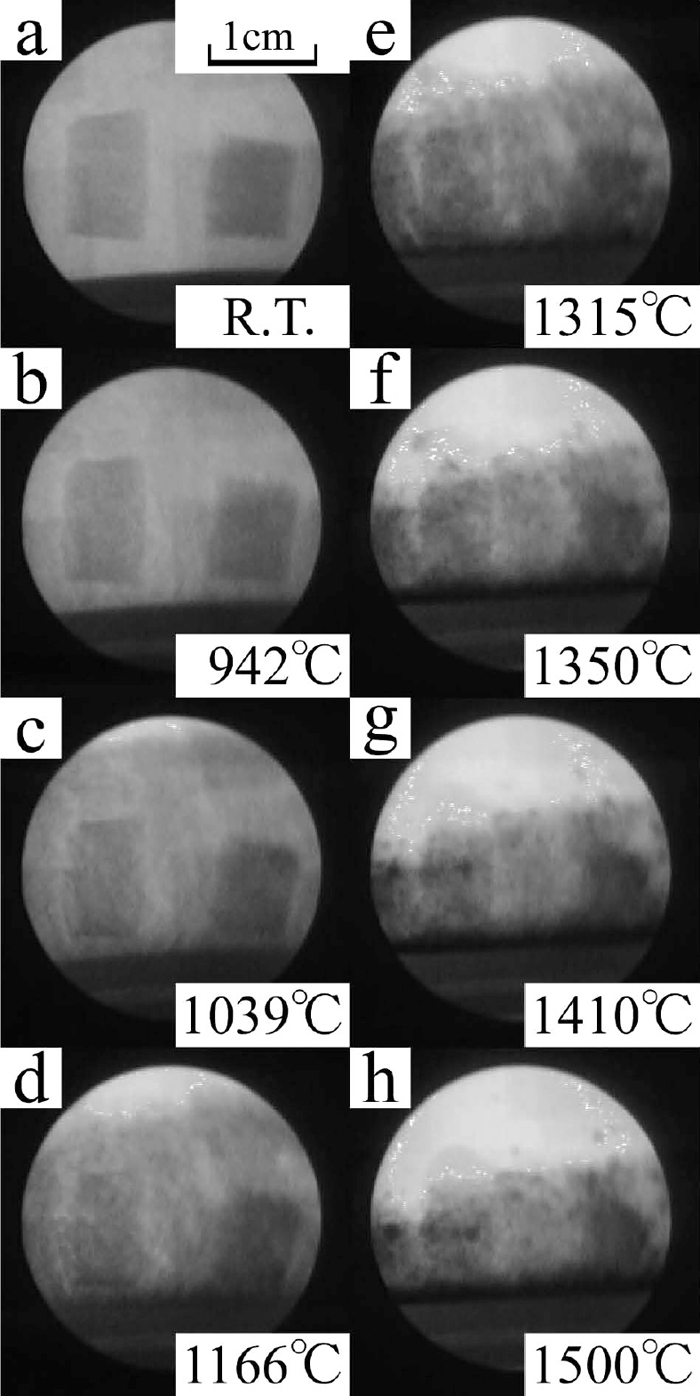
The changes in state of powder layer were clearly observed by the in-situ X-ray observation technique. Figure 5 shows the X-ray photographs of Sample I. Here, the way to see X-ray photographs is explained using these photographs. The crucible is within the circles in the photographs. The grey area is the powder layer and the black area beneath the grey area is the crucible. The boundary of these two coloured area is the inside bottom of the crucible. This boundary moved up with increase of temperature by the thermal expansion of the stage and the crucible.
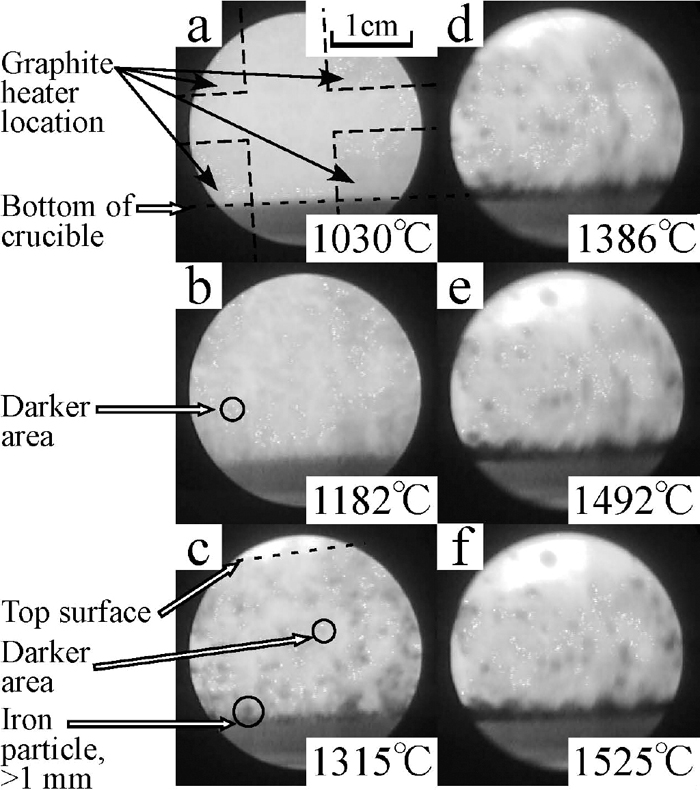
The X-ray photographs of the sample I, taken at different temperatures.
These photographs were taken at different temperatures. Top surface of powder layer was not observed in the beginning because it was out of observation area. Dark spots began to appear with temperature increasing as shown in Fig. 5(b). These spots could be caused by two different conditions of powder layer, viz., a) There were many fine iron particles (smaller than 0.5 mm), and b) Bulk density of these area became higher than the other area. The spots in Fig. 5(c) are clearly black and they are iron particles. These spots were clearly observed when the iron particles were above 0.5 mm.
The fine white dots in the photographs are caused by noises. Four corners in the photographs were darker (easily observed in Fig. 5(a) because the furnace’s heater element made of graphite was located there.
3.3. X-ray Photographs and Height Change of Powder LayerThe X-ray photographs of the sample I during heating are shown in Fig. 5. The powder layer was uniformly grey below 1098°C. Above this temperature, dark spots began to appear and became darker with temperature increasing. Most of these spots appeared at the bottom of the crucible. The other spots moved to the bottom of the crucible with shrinkage of the powder layer. Thus the black spots at the middle of the crucible at 1492°C were less than that of at 1315°C and 1386°C while the number of spots at the bottom was increased. The optical photographs of the sample I after heating is shown in Fig. 6. A part of the powder formed lumps with metallic lustre as shown in Fig. 6(a). Since the lumps were weak, they were broken down when they were picked. Most of iron particles were on the wall and the bottom of the crucible as shown in Fig. 6(b). The iron collecting rate and the maximum size of collected iron particles are shown in Table 4. The height change of the powder layer during heating, indicated as the ratio to its initial height, against the heating time is shown in Fig. 7. The results of the other samples are also shown in the same figure. The measured height from the photographs was erratic because the boundary of powder layers and pellets were unclear. The error bars in Fig. 7 present this error. The top surface of the powder layer moved down to the observation area at around 1300°C and was static from 1300°C to 1315°C. Above 1315°C, the powder layer started to shrink again and the black spots at the middle area of the crucible began to move to the bottom during the same period.
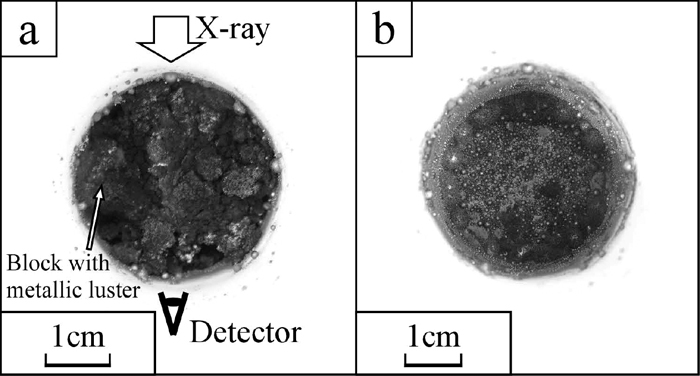
The optical photographs taken from above after the X-ray observation of the sample I, a) the surface of powder layer and b) inside bottom of the crucible.
| Sample No. | I | II | III |
|---|---|---|---|
| Collected iron rate (> 0.3 mm) to the Fe in initial material, Rm | 37% | Ave.: 28% Pwd.: 34% Plt.: 0% |
84% |
| Maximum size of iron particle | 3.5 mm | 3.0 mm | 20 mm |
| Weight change rate | 40% | 40% | 42% |
| Carbon content | 2.6% | 3.0% | 2.8% |
| Sulphur content | 0.35% | 0.25% | 0.30% |
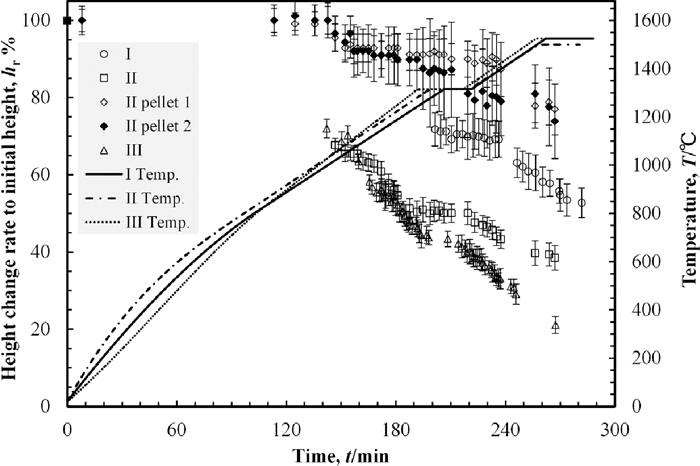
The height change of the powder layer during heating, indicated as the ratio to its initial height, against the heating time.
The X-ray photographs of the sample II are shown in Fig. 8. The embedded pellets were darker than the other area. The boundary between the powder layer and the pellets were clear at room temperature but gradually it became blurred with temperature increasing. The black spots began to appear across the observation area above 1100°C. There was no significant difference in the appearing tendency of black spots between the powder layer and pellets. Appeared black spots accumulated on the bottom similarly to the powder layer of the sample I. The optical photographs of the sample II after heating are shown in Fig. 9. A part of the pellet was able to be observed on the surface as shown in Fig. 9(a). Most of iron particles were on the wall and the bottom of the crucible as shown in Fig. 9(b). Further, there was no iron particle above 0.3 mm in the pellets. The weight loss rate, the iron collecting rate and the maximum size of collected iron particles are shown in Table 4. The iron collecting rate was calculated by three methods. One was on the basis of the Fe amount contained in the overall sample, indicated as “Ave.” in Table 4. The weight of collected iron particles from the overall sample was divided by the weight of Fe contained in overall sample. In the same manner, the others were on the basis of that of only in the powder layer and only in two pellets. These were indicated as “Pwd.” and “Plt.” respectively in Table 4. The difference of the iron collecting rates between that of the sample I and that of the powder layer of sample II was slight while the difference between that of the sample I and that of the pellets of sample II was large. The height change rates of the powder layer and the pellets of the sample II are shown in Fig. 7. The top surface of the powder layer moved down to the observation area at around 1100°C. At this temperature, the black spots began to appear in the X-ray photographs of the sample II. The height change rate of the powder layer increased from 1160°C to 1250°C while there was no corresponding behaviour of black spots in this term. Above 1315°C, the height changing rate of the powder layer increased and accumulation of the black spots on the bottom was progressed. The difference of the height change rates between that of the powder layer of the sample II was larger than that of the sample I. On the other hand, the height change rate of the pellets of the sample II was smaller than that of the sample I. The iron collecting rate of the pellets of the sample II as well as the height change of the pellets of sample II was smallest.
The X-ray photographs of the sample II, taken at different temperatures. The two black darker rectangles are green pellets in the powder layer.
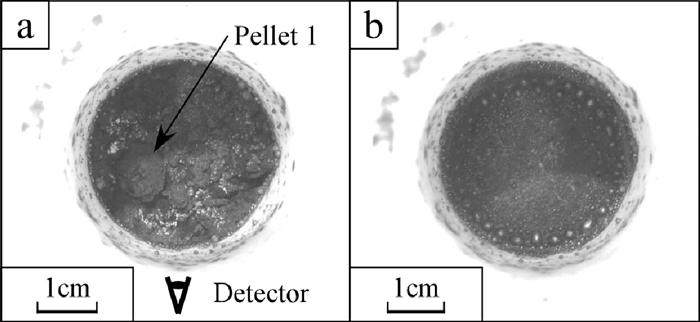
The optical photographs taken from above after the X-ray observation of the sample II, a) the surface of powder layer and b) inside bottom of the crucible.
The X-ray photographs of the sample III are shown in Fig. 10. The small black areas began to appear across the observation area at around 1000°C, lower than that of the samples I and II. These spots also tend to appear at the bottom of the crucible. At around the same time, the centre of the surface of the powder layer began to be concave. Areas where black spots concentrated also appeared at right and left sides of the crucible until the temperature increased to 1400°C. These two areas formed two large particles until the temperature rose to 1482°C as shown in Fig. 10(e). The particle of B+C, shown in Fig. 10(e), fell down to the bottom in one second and separated into two particles, B and C, as shown in Figs. 10(f) and 10(g). The particle A also fell down to the bottom and coalesce with the particle C into the large particle, A+C, as shown in Fig. 10(h). The optical photographs of the sample III after heating is shown in Fig. 11. The banana shaped iron particle shown in Fig. 11 was the particle A+C shown in Fig. 10(h). The particle B was on the powder layer. There were few particles on the wall of the crucible. This was a different from the samples I and II. The iron collecting ratio and the maximum size of collected iron are shown in Table 4. These values were clearly larger than that of the samples I and II. The height change rate is shown in Fig. 7. The top surface of the powder layer moved down to the observation area at around 1030°C, lower temperature than that of the samples I and II. The height change rate increased from 1100°C to 1160°C and decreased during isothermal zone of 1315°C. After this isothermal holding, the height change rate was increased again. Comparing the height change rate tendency with the variation of the X-ray photographs, the height change rate increasing after isothermal holding of 1315°C was occurred during same term of appearing of the area where black particles concentrated. On the other hand, the height change rate increasing during 1100–1160°C was not related to the black spots appearing tendency.
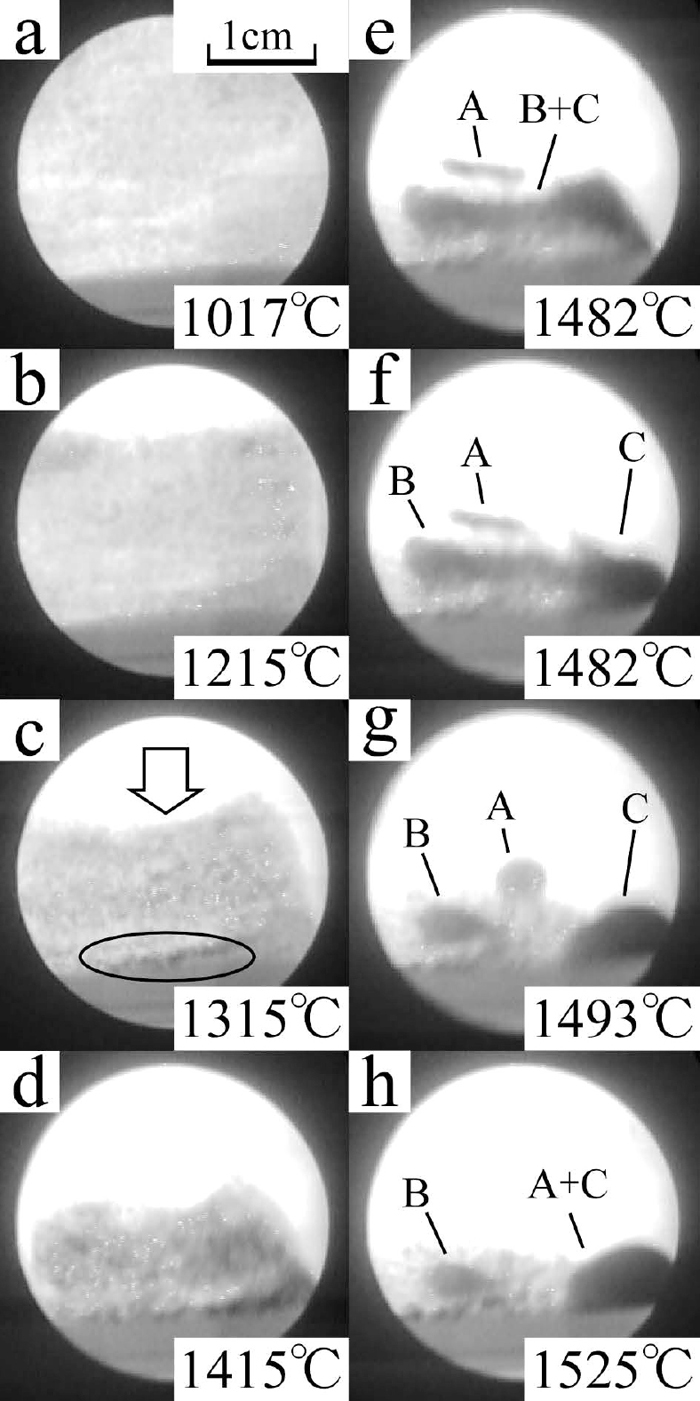
The X-ray photographs of the sample III, taken at different temperatures. The concave of powder layer is shown in c). The movement of iron particles above 5 mm are clearly shown in e)–h).
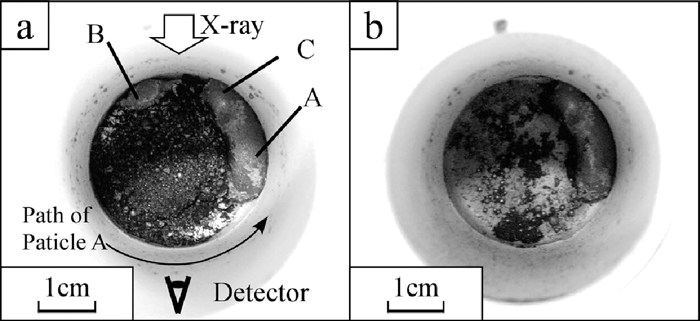
The optical photographs taken from above after the X-ray observation of the sample III, a) the surface of powder layer and b) inside bottom of the crucible.
In the early stage, the reduced iron in the powder layer is solid in the X-ray observation experiment. The liquid phase gradually increases with progression of carburization and temperature increasing. All of iron particles finally become liquid as shown in Fig. 12 by using the phase diagram of Fe–C system.8) Defining the finish temperature of reduction reaction as TR, the solidus-line temperature as TS and the liquidus -line temperature as TL, the powder layer should change as following steps with the temperature increasing:
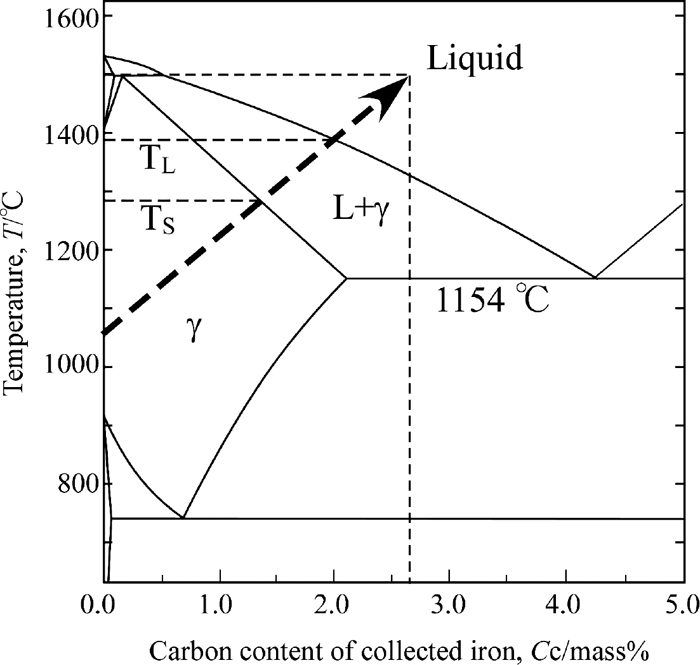
Qualitatively explanation of carbon content change and phase change of reduced iron during heating on the phase diagram of Fe–C system.
i) T < TR: Volume decreasing of iron oxide particles and carbon particles by reduction reaction.
ii) TR < T: Formation of voids by carbon dissolution to the iron and other particles fall down to such voids.
iii) TS ≤ T ≤ TL: Melting and shape change of iron particles caused by temperature increasing and carburization.
iv) T > TL: Coalescence of melted iron particles. This coalescence makes voids and other particles fall down to these voids.
Further, volume and shape change of particles (occurs in the step i–iii), and coalescence of melted iron particles (occurs in the step iv) induce the following step:
v) Over the whole temperature range: Collapsing of the packing structure of the powder layer.
The agglomeration occurs only in step iv). However, the steps ii) and v) dynamically change the powder layer condition and make chances of coalescence of iron particles. In addition, the steps i–iv) induce the step v). Thus not only the step iv) but also the other steps are also important to accelerate agglomeration of melted iron.
However, these steps themselves are microscopic phenomena. They could not be observed directly in this study because of the resolution limit of the X-ray detector. Thus, in addition to the X-ray images, the height change of powder layers was also used to discuss the change in state of powder layers or pellets. Height change of the powder layer should be caused by these five steps. Therefore height change can be used to estimate microscopic changes of the powder layers or the pellets.
Identifying the temperature, TR, TS and TL clarifies which step is the controlling step of the height change and agglomeration. The influences of the bulk density and the grain size distribution of samples to each step also can be evaluated by these parameters.
Firstly, the reduction reaction finish temperature, TR, was determined by using the results of TGA as TR = 1060°C. This was because the weight change rate to the temperature change rate became lower than 0.025 (|dW/dT| < 0.025) at 1060°C. It was enough small value compared with its maximum value, |dW/dT|max = 0.51. In other words, the weight change rate became lower than 5% of the maximum value. Since this temperature is lower than the eutectic temperature of Fe–C system, iron should not melt in this term.
Secondly, the possible value of the solidus-line temperature, TS, was estimated. Iron melts above the eutectic temperature, 1154°C. Further, the melting of iron particles should have started at 1315°C because rounded black particles were observed at the temperature. Hence, the solidus-line temperature should be 1154°C < Ts < 1315°C.
Thirdly, the possible value of the liquidus-line temperature, TL, was estimated. The carbon content of gathered iron particles from each sample were 2.6–3.0%. The liquidus-line temperature of these irons is 1300–1330°C. Since the carburization should progress after the melting, the liquidus-line temperature should be 1300–1330°C < TL < 1500°C.
4.2. Influences of Step i) and Step v) to Height Change at the Temperature Range of T < TRAs described in previous section, 3.1, the microscopic powder layer change caused by each step was macroscopically observed as the height change of the powder layer or the pellets. At temperature range of T < TR, the step i) and the step v) can be progressed. The influences of these two steps on the height change were discussed by following two steps in this section. Firstly, the height change caused by the step i) was estimated by calculations using the result of TGA. Secondly, the calculated values were compared with measured values from X-ray photographs. The difference between them should be because of step v). Further, the influences of bulk density of the powder layers or pellets and grain size distribution to the progression of the step i) and the step v) were also discussed.
The total volume of grains in the powder layer was calculated by dividing the weight of the powder layer by the grain density. The weight of the powder layer at each temperature was calculated by multiplying the initial weight of the powder layer and the weight changing rate of the TGA curve (shown in Fig. 4). Grain density, including the volume of closed pores in the grain, is calculated and open pores are ignored in the calculation since it is small enough compared with its grain size. However, grain density was not measured in this research and the values of true density of materials were employed for the calculation. Further, the weighted average density of the grains was employed as average true density of the grains to deal with the mixture as a uniform material. It was because that there were several materials such as iron oxides, reduced metallic iron and carbon in the powder layer and it was difficult to deal these materials individually. The true density change of iron oxide, caused by the progress of reduction reaction as Fe3O4→FeO→Fe, was also considered. The mixing ratio was also changed with the progress of reduction reaction and it was also considered.
To deal with the changes of density, mixing ratio continuously during heating, the oxygen deposition degree per one Fe atom, Δx was employed. Using Δx, the reduction reaction of magnetite is described as follows:
| (3) |
It should be noted that the Eq. (3) was introduced just to examine the relationship between the weight change and the volume change of the sample continuously and do not describe the progress of reduction reaction itself. The carbothermic reduction of magnetite is essentially described as follows:
| (4) |
| (5) |
| (6) |
The relationship between the oxygen deposition degree, Δx, and weight change, ΔW, is described as follows:
| (7) |
| (8) |
| (9) |
| (10) |
| (11) |
| (12) |
| (13) |
| (14) |
| (15) |
| (16) |
| (17) |
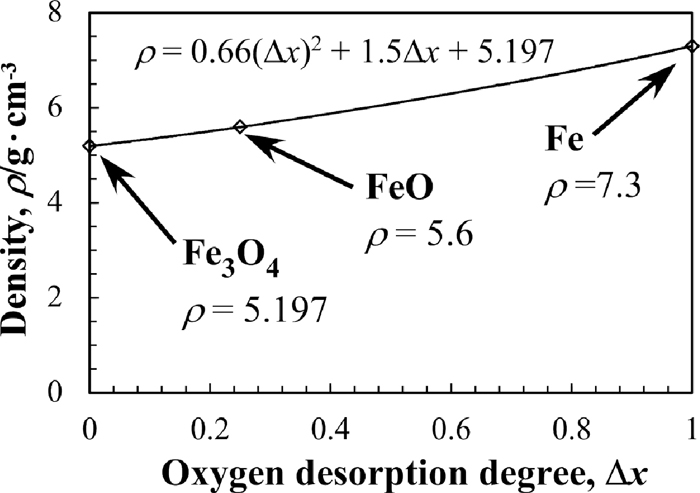
Relationship between the oxygen desorption degree and density of iron oxide.
On the basis of this model, the height change rates of each sample, h/hi, was calculated as shown in Fig. 14 by using the results of the TGA. The result of “Sample i- 0.62 g/cm3” in Fig. 4 was employed for the calculations of the samples I and II. In the same manner, the result of “Sample iii- 0.76 g/cm3” was employed for the calculation of the sample III. As shown in Fig. 14, the bulk density and the grain size distribution have little influence on the step i) because the difference of the reduction rate and final reduced degree between samples shown in Fig. 4 is small. Thus the difference of the height change of the powder layers below 1060°C should be caused by the step v).
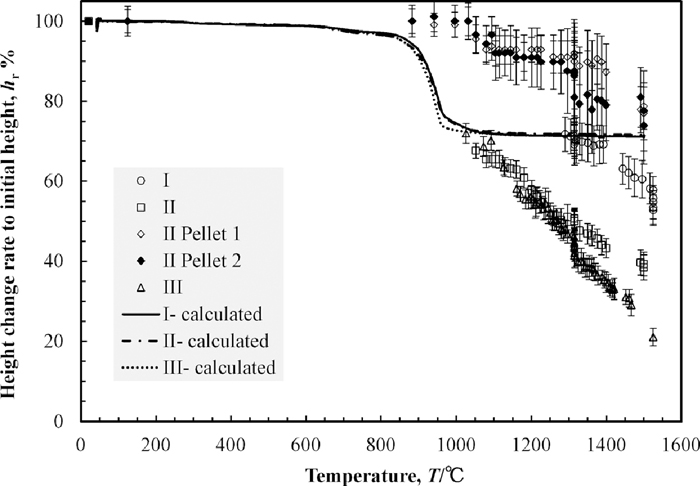
The height change of the powder layer during heating indicated as the ratio to its initial height, against temperature. The plots were measured values from X-ray photographs and the lines were calculated value by using Eq. (17).
Comparing the height change of the powder layers at 1060°C between the sample I and the sample II (the powder layer and the pellets), the step v) tended to proceed in the powder layer with lower bulk density. It should be due to weakness of the structure strength. On the other hand, the height changes of the high bulk density pellets were lower than 10%. It should be because of that the carbon black particles in the pellets stuck together by powder compacting and formed the strong net-like structure.
The step v) also tended to proceed in the powder layer with wider grain size distribution (the sample III). It should be because of that the bulk density of the sample III was not uniform microscopically and local collapsing tended to occur at the low bulk density site. This local collapsing should affect the surroundings and the step v) proceeded more than the powder layers of the other samples. The dark clouds of 1–2 mm in Fig. 10(a) should be caused by these local density variations. These clouds did not appear in the sample I and sample II as shown in Figs. 5(a) and 8(a), respectively.
The tendency of ease of collapsing should keep after the reduction finished (the temperature range of T > TR). In other words, the step v) tends to proceed in the powder layer with low bulk density and the wide grain size distribution over the whole temperature range.
4.3. Powder Layer Change at the Temperature Range of T > TRThe rate controlling steps of the height change of powder layers should be the step ii) and v) at the temperature range of 1050°C < T < 1154°C (≤ TS) because melting of reduced iron does not occur below 1154°C, the lowest temperature of TS. Further, the rate controlling steps of the height change of powder layers should be the steps ii), iii) and v) at the temperature range of 1154°C ≤ TS < T < TL < 1500°C. The height change at the temperature range of 1160–1250°C in the sample II and 1100–1160°C in the sample III correspond to this temperature range and the changes should be because of the steps ii), iii) and v). The rate controlling steps of the height change of powder layers should be steps ii), iv) and v) at the temperature range of 1300–1330°C < T.
As described in previous section, 3.2, the step v) (collapsing) tends to proceed in the powder layer with low bulk density. However, occurrence of collapsing caused by the step v) increases the bulk density of powder layers and frequency of occurrence of collapsing decreases. Thus the height change rate of the sample II decreases and became same with that of the powder layer of the sample I above 1300°C.
Focusing on the contact number of grains, it should be high to proceed the step iv). The contact number increases when the density of powder layer becomes higher or the grain size distribution become wider.7) However, the iron collecting rate and the maximum size of iron particles were lowest in the pellets with highest bulk density. It should be because of that carbon particles stuck together by powder compacting and formed the strong net-like structure. The coalescence of iron particles should be prevented by this net-like structure and iron particles cannot become above 0.3 mm.
In the case of powder layer with wider grain size distribution, the bulk density of the powder layer should be nonuniform. This difference was observed in the powder layer of sample III as shown in Fig. 10(a). On the other hand, the powder layer of the sample I and the sample II was uniform as shown in Figs. 5(a) and 8(a) respectively. The steps ii), iii) and iv) should preferentially proceed at where the bulk density was locally high.
Further, the contact number of grains varies by changing the grain size distribution. The maximum contact number of mono-sized grains is 12. On the other hand, there could be grains having larger contact number than 12 in the powder layer with wide grain size distribution. Such grains having larger contact number should grow preferentially and height change rate of powder layer including these grains became larger.
The in-situ observation of the carbothermic reduction of magnetite powder and agglomeration of reduced iron was succeeded by using the X-ray transmission observation technique. Appearing and moving behaviour of the iron particles in the powder layers and the height change of the powder layer were observed clearly. The following conclusions were derived from the results and discussion.
(1) Decreasing of grains’ volume in the powder layer is not influenced by the bulk density of powder layer or the grain size distribution.
(2) The collapsing tends to occur in the powder layer with low bulk density or wide grain size distribution.
(3) Decreasing the bulk density of the powder layer do not increase the iron collecting rate while the height changing of the powder layer becomes larger.
(4) Increasing the bulk density by powder compacting decreases the height change degree of powder layer, the iron collecting ratio above 0.3 mm and the maximum size of iron particles.
(5) To widen the range of the grain size distribution makes the height change degree of powder layer, the iron collecting rate above 0.3 mm and the maximum size of iron particle larger.
In the case of the powder layers with low bulk density, the contact number of grains decreases and agglomeration do not proceed while the height change degree becomes large. On the other hand, increasing the bulk density by powder compacting, the height change of the powder layers and agglomeration of melted iron particles were prevented by the strong net-like structure. This structure should be formed by sticking together of carbon particles. In the case of the powder layer with wider grain size distribution, large iron particles should preferentially be formed at where local bulk density is high or larger size particle locates. The grain size distribution influenced more to increase the agglomeration degree than the bulk density of powder layers.
The authors acknowledge Prof. S. Seetharaman of Royal Institute of Technology, Sweden, for suggesting the technical points of experiments and discussing the results. This research was carried out in the Department of Material Science and Engineering of Royal Institute of Technology, Sweden.
One of authors was supported by the master-doctor unified education program of Tokyo Institute of Technology.