Abstract
Electrochemical hydrogen permeation tests of pure Fe sheets rusted by cyclic corrosion test (CCT) and atmospheric exposure were carried out under controlled temperature and humidity to investigate the influence of atmospheric corrosion on the hydrogen entry behavior. The hydrogen entry into the Fe specimens rusted by CCT increased under wet condition, and the hydrogen entry was increased with the CCT cycle number. During drying process after the wetting, hydrogen entry was further enhanced and a peak of hydrogen current was observed. The peak hydrogen permeation current tended to increase with the growth of rust layer, and the peak value of the hydrogen permeation current became remarkably higher than that at the highest humidity when the rust layer was relatively thick. Similar enhancement of hydrogen entry into an outdoor-exposed specimen was also observed during drying. Drying process after CCT resulted in an increase in hydrogen content of 5 mm-thick steel specimens measured by means of thermal desorption analysis, indicating the enhancement of hydrogen entry during drying process and showing a good agreement with the electrochemical hydrogen permeation test results. It is required to take into consideration the enhanced hydrogen entry to estimate concentration of hydrogen from the environment.
1. Introduction
The study on the delayed fracture property of high strength steels is becoming more important issue for the safe and reliable usage of them and for development of steels with further high strength level. The critical diffusible hydrogen content for delayed fracture, HC, is regarded as one of the important factors for the evaluation of susceptibility of high strength steels to delayed fracture.1,2,3) HC and the relationship between fracture stress and diffusible hydrogen content have been examined by using constant load test,1,2,3,4) slow strain rate test (SSRT),5,6,7,8,9) conventional strain rate test (CSRT)10,11,12,13,14) of tensile specimens charged with hydrogen in conjunction with hydrogen content measurement by means of thermal desorption analysis (TDA).
On the other hand, it is also necessary to obtain the concentration of hydrogen from the environment, HE, to compare with HC for the evaluation of the susceptibility of high strength steels to delayed fracture. In the case of high strength steels used for construction, for instance, understanding the hydrogen adsorption in the atmospheric corrosion condition is necessary. In our previous studies, the delayed fracture properties of high strength steel have been evaluated using SSRT of circumferentially notched round bar specimens rusted in the atmospheric corrosion condition15,16,17,18) in order to know the direct influence of HE on the delayed fracture of the rusted specimen. SSRT was carried out using rusted specimens under wet condition to reproduce active corrosion and associated active hydrogen entry14,15,16) affected by the rust layer formed on the specimen surface.19) Since the hydrogen concentration in the steel specimens is unstable in the actual environment where the factors such as temperature and humidity are changing with time,20) the specimens corroded at outdoor exposure sites were kept at wet condition prior to SSRT15,16) in order to reproduce active hydrogen entry and to homogenize hydrogen distribution in the specimen.19) In these cases, it was assumed that the hydrogen entry is enhanced mostly under wet condition. However, hydrogen entry phenomenon is influenced by the characteristics of rusts, incorporated pollutants and the changing environmental factors such as temperature and humidity, and therefore it is rather complex.21,22) Accordingly, further investing of hydrogen entry behavior is required for more quantitative evaluation of HE.
Electrochemical hydrogen permeation test23,24) is an useful method to monitor the change in hydrogen entry with time, and it has been utilized to study hydrogen entry behavior under atmospheric corrosion.15,21,22,25,26,27,28) In our previous studies using the method, it was found that the rust later formed during atmospheric corrosion has an important role to enhance hydrogen entry.15,28) In the present study, electrochemical hydrogen permeation tests of pure Fe sheet specimens rusted by cyclic corrosion test and outdoor exposure were performed under controlled temperature and relative humidity to understand the effect of the rust layer and humidity on hydrogen entry behavior. Furthermore, to investigate the influence of corrosion rate on hydrogen entry, atmospheric corrosion monitoring (ACM) sensor rusted under the same CCT condition was carried out. On top of that, to check the quantitativity of the hydrogen concentration estimated from the electrochemical hydrogen permeation test, hydrogen concentration in a steel estimated by using electrochemical hydrogen permeation test was compared with that obtained by means of TDA.
2. Experimental Procedures
2.1. Specimens
The as-received commercially pure Fe sheet (The Nilaco Corporation, 99.5%) was used for the hydrogen permeation test in a constant temperature and humidity chamber after cyclic corrosion test (CCT). The specimen was initially 0.5 mm thick and with 20 cm2 of effective area for hydrogen permeation test. After both sides were polished by #800 grit SiC paper, one side of the specimen used as the hydrogen output side was electroplated with Ni in Watt’s bath (NiSO4·6H2O 250 g/l, NiCl2·6H2O 45 g/l, H3BO3 40 g/l) at 60°C with a current density of 3 mA/cm2 for 180 s.22) The calculated thickness of Ni plating was about 180 nm.28) The hydrogen input side opposite to the Ni-plated side (hydrogen output side) of the sheet specimens was corroded by using CCT as will be described later and subjected to electrochemical hydrogen permeation test under controlled temperature and humidity. A Fe sheet specimen exposed outdoor in Okinawa and a similar sheet specimen of SCM435H steel with almost the same dimensions14) exposed outdoor in Tsukuba were also used. This SCM435H steel sheet was as-received and its chemical composition is given in Table 1.
Table 1.Chemical compositions (mass%) of SCM435H and boron-bearing steels used in this study.
| Steel | C | Si | Mn | P | S | Cu | Ni | Cr | Mo | B |
|---|
| SCM435H | 0.37 | 0.14 | 0.77 | 0.02 | 0.015 | – | – | 1.06 | 0.14 | – |
| Boron-bearing steel | 0.20 | 0.08 | 0.97 | 0.011 | 0.015 | 0.01 | 0.02 | 0.15 | Tr* | 0.0011 |
Disk-shaped boron-bearing steel specimens were used for measurements of hydrogen content in corroded specimens by using TDA. The disk specimen was with 20 mm of diameter and with 5 mm of thickness. The chemical composition of the specimens is shown in Table 1. The heat treatment condition of the boron-bearing steel was 880°C, 60 min, water for quenching, and 290°C, 90 min, water for tempering. The tensile strength of the boron-bearing steel was 1340 MPa.
2.2. Cyclic Corrosion Test (CCT) and Atmospheric Exposure Test
The pure Fe sheet specimens were corroded using CCT prior to the electrochemical hydrogen permeation test. The Ni-plated side for hydrogen output side was masked during CCT to avoid corrosion on that side. One cycle of the CCT consisted of dry (50% RH, 5.75 h), wet (98% RH, 1.75 h) and salt spray (0.5% NaCl aqueous solution, 0.5 h) stages. The temperature was kept at 30°C throughout the CCT. After the CCT, the corroded Fe sheet specimen was subjected to electrochemical hydrogen permeation tests under controlled temperature and humidity. After the test, the surface of the specimens was observed by means of a scanning electron microscope (SEM).
In order to investigate the influence of rust layer formed in the actual environment, a pure Fe sheet specimen was also exposed outdoor for two months at the campus of University of the Ryukyus in Okinawa, Japan, with coastal and subtropical environment (N26.248, E127.765), where the corrosivity is relatively severe. A SCM435H sheet specimen exposed for 2 years at National Institute for Materials Science, Tsukuba, Japan, where the corrosivity is relatively mild29) (N36.075, E140.122)14) was also used.
2.3. Electrochemical Hydrogen Permeation Test
Electrochemical hydrogen permeation tests were carried out using the sheet specimens corroded by CCT or outdoor exposure. The schematic drawing of the test is given in Fig. 1. The rusted specimen was fixed on a modified Devanathan cell. The Ni-plated hydrogen output side was faced to a 1 M NaOH aqueous solution filled in the cell. A Hg/HgO reference electrode and a Pt counter electrode were set in the cell. The cell was set in a constant temperature and humidity chamber, and the specimen and electrodes were connected to a potentiostat placed outside of the chamber.

The hydrogen output side was polarized at 0.1 V vs Hg/HgO and the hydrogen permeation current measured by the potentiostat was recorded by using a data logger every 5 seconds. Prior to the hydrogen permeation test, the Ni plated side was polarized for more than 24 h until the passive current density became lower than 0.1 μA/cm2.22) Subsequently, the relative humidity was increased step by step (50, 70, 80, 98%RH) at a constant temperature of 30°C. Each humidity from 50 to 80%RH was kept for about 2 h. The humidity of 98%RH was kept for more than 10 h, and then the relative humidity was decreased in a stepwise manner.
2.4. Atmospheric Corrosion Monitoring (ACM) Sensor
An ACM sensor consisted of Fe substrate and Ag conductive paste as shown in Fig. 2 was used to monitor the corrosion behavior.30) The ACM sensor was firstly rusted by 30 cycles of CCT with the above-mentioned condition. Then, the rusted ACM sensor was set in the constant temperature and humidity chamber, and the change in the current flowing between the Fe and Ag domains (ACM current) with the change in relative humidity was monitored every 10 minutes by using an amperometer and a data logger. The humidity was controlled in the similar manner as the electrochemical hydrogen permeation test, and the temperature was kept at 30°C.
2.5. Thermal Desorption Analysis (TDA)
The hydrogen content in specimens corroded by CCT was measured using TDA. In order to avoid hydrogen release during handling, the boron-bearing steel specimens with 5 mm thickness and 20 mm diameter were used for this experiment. After the specimens were corroded by 150 cycles of CCT, the specimens were taken out from the CCT chamber at the end of dry (50%RH), wet (98%RH) or salt spray (0.5% NaCl aqueous solution) stages, and the hydrogen contents in the specimens were measured by means of TDA. Other specimens were kept in dry (50%RH), wet (98%RH) and salt spray (0.5% NaCl aqueous solution) conditions at 30°C for 24 h after the end of each stage of 150th cycle of CCT, and the hydrogen content was measured in order to know the influence of each stage condition on hydrogen entry.
TDA of hydrogen in specimens was carried out by using a TDS system for hydrogen analysis (R-Dec Co., Ltd.) equipped with a programmable furnace and a quadru-pole mass spectrometer. The heating rate was 100°C/h. The hydrogen desorption curves were obtained from ambient temperature to 800°C. The hydrogen evolved up to about 300°C was regarded as diffusible hydrogen which diffuse out from the specimen at room temperature.31) Prior to TDA, the rust layer was removed by using sand blaster to avoid the contamination arising from the rust layer.
3. Results and Discussions
3.1. Hydrogen Permeation Test of Pure Iron Rusted by CCT
The specimen surface rusted by CCT was covered by rust layer. Representative SEM photographs of a specimen rusted by 30 cycles of CCT are shown in Fig. 3. Under the relatively severe CCT condition, almost the whole surface was covered with rust layer by 30 cycles of CCT.

The change in hydrogen permeation current density with the relative humidity of a pure Fe specimen rusted by 60 cycles of CCT is shown in Fig. 4 for an example. The monitored change in actual humidity measured in the constant temperature and humidity chamber is also plotted in the figure. There was no obvious increase in hydrogen permeation current up to 80%RH except for the initial increase observed when the relative humidity was increased to 50%RH. The hydrogen permeation current drastically increased when the relative humidity was increased to 98%RH. The increase in the hydrogen permeation current was obviously slower than that of the relative humidity in the chamber and it took about 8 h until the hydrogen permeation current reached to the maximum and stable value. The increase in the hydrogen permeation current at the 98%RH was also slower than that of the buildup of hydrogen permeation current measured when hydrogen was introduced by using cathodic polarization.28) The slower response of hydrogen permeation current indicates that the increase of the surface hydrogen concentration took time. It is most probably because the penetration of water through the rust layer and the correspondent enhancement of hydrogen entry took time.

When the relative humidity was decreased to 80%RH after keeping the specimen at 98%RH, the hydrogen permeation current showed a decrease and then it increased slightly. Subsequent decrease of humidity from 80 to 70%RH resulted in similar change of hydrogen permeation current. When the relative humidity was decreased further and kept at 50%RH for longer duration, an increase in hydrogen permeation current was observed after initial decrease of the current. After showing a peak current about 3 h after the decline of the relative humidity, the hydrogen permeation current gradually decreased. The height of the peak of hydrogen permeation current was roughly the same as that at 98%RH.
The changes in the hydrogen permeation current with the change in relative humidity for the pure Fe specimens corroded by various cycles of CCT are shown in Figs. 5(a) and 5(b). For comparison, hydrogen permeation current of as-prepared pure Fe specimen that experienced no corrosion prior to the hydrogen permeation test is also given in Fig. 5(a). No obvious hydrogen permeation current was observed for the as-prepared specimen. Therefore, it can be said that the surface rust layer is necessary for the enhanced hydrogen entry.

The hydrogen permeation current at 98%RH increased with the CCT cycle number, and the increase was correspondent to our previous result that the hydrogen permeation current measured continuously during CCT increased with the cycle number of CCT whose condition was the same as that of the present study.28) Furthermore, it is noteworthy that the hydrogen permeation current peak appearing during drying at 50%RH increased significantly with the CCT cycle number. Especially, the peak current was obviously higher than that of the maximum hydrogen permeation current at 98%RH for the samples corroded by CCT for 90 cycles or more.
The maximum hydrogen permeation current densities obtained at 98%RH and that at 50%RH applied after wetting at 98%RH are shown as a function of CCT cycle number of the pre-corrosion in Fig. 6. The highest hydrogen permeation current densities at 98%RH and 50%RH increased with CCT cycle number. The highest current at 98%RH became almost constant after 120 cycles of CCT, whereas that at 50%RH increased continuously at least up to the highest cycle number, 180 cycles.

The weight losses of pure Fe specimens measured in our previous study increased almost linearly, in other words, the corrosion rate was almost constant in the relatively severe CCT condition.28) Though the thinning of the specimen results in the reduction of diffusion path of diffusible hydrogen and in an increase of hydrogen permeation current, the effect of thinning is not enough to explain the increase of hydrogen permeation current.28) Therefore, the increase of hydrogen permeation current at 98 and 50%RH is considered not to be attributable to the change in corrosion rate nor thinning of the specimen but to the growth of the rust layer formed on the specimen surface.
The increase in the peak hydrogen permeation current is probably due to the acidification of inner rust layer resulting in the enhancement of the efficiency for hydrogen entry. In our previous work, it was found that the pH of inner rust layer measured by using W/WO3 electrode probe was decreased with CCT cycle number15) probably according to the reactions shown below.21)
|
Fe
2+
+ 2H
2
O →
Fe(OH)
2
+ 2H
+
| (1) |
|
2Fe
2+
+
1/2O
2
+
3H
2
O →
2FeOOH + 4H
+
| (2) |
Though short-term change of pH in the inner rust layer has not been monitored in the study, similar decrease of pH in the inner rust layer is considered to occur during drying process so that the hydrogen entry was enhanced. Concentration of chloride ions in the rust layer during the drying process is also thought to be a factor to enhance hydrogen entry by increasing corrosion rate. Another possible reason of the enhanced hydrogen entry is the shift of the surface potential to the negative direction,
21) though the investigation is ongoing and detailed investigation is left for future study.
The change in the time to the hydrogen permeation current peak appearing at 50%RH is shown in Fig. 7 as a function of CCT cycle number. The time 0 in the figure means the end of set humidity of 98%RH. The peak appeared after longer time as the CCT cycle number was increased. Most probably, it is because the drying of the rust layer during the drying process is slower for the specimen covered by thicker rust layer.
3.2. Hydrogen Permeation Test of Specimens Rusted by Atmospheric Exposure
The similar electrochemical hydrogen permeation test has been carried out using specimens corroded by atmospheric exposure at Okinawa and Tsukuba. Figure 8(a) shows the change in hydrogen permeation current density with the change in relative humidity for a pure Fe sheet specimen exposed at Okinawa for 2 month. The hydrogen permeation current increased with increase in relative humidity and became almost constant at 98%RH. When the relative humidity was decreased the hydrogen permeation current showed an obvious increase and then it decreased gradually. This tendency is similar to that of specimens corroded by CCT for 90 cycles or more as shown before, though the hydrogen permeation current density of the atmospherically exposed specimen was significantly lower than that corroded by CCT.
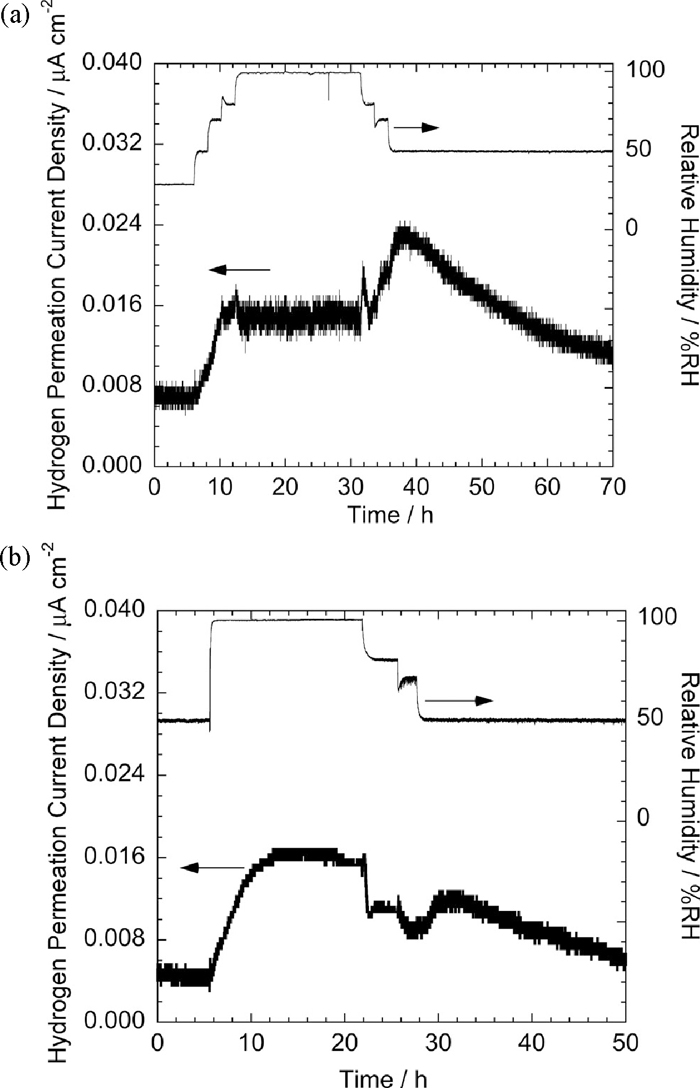
The SCM435H specimen corroded for 2 years at Tsukuba, where the corrosivity is relatively mild, showed the maximum hydrogen permeation current density at 98%RH similar to that of the specimen exposed at Okinawa (Fig. 8(b)). In the case of this measurement, the relative humidity was not increased in a stepwise manner but was directly increased to 98%RH from the initial 50%RH, because the hydrogen entry behavior during drying process was mainly focused for the outdoor-exposed specimen. The peak appeared during drying process was small in comparison with the specimen exposed at Okinawa despite the fact that the specimen was exposure for longer duration.
Increase in hydrogen permeation current measured with decrease in humidity under outdoor exposure has been reported.14,32) In this case, it is considered that the increase in temperature corresponding to the decrease in humidity had also an effect on increasing hydrogen permeation current by accelerating hydrogen diffusion. However, the present experimental results obtained at a constant temperature indicate that the drying process itself has a role to enhance hydrogen entry.
The result of the electrochemical hydrogen permeation tests of corroded specimens showing a rising current during drying indicates that the maximum hydrogen entry is not easily reproduced with simple way, such as exposing rusted sample to wet condition for a while. Thus, the maximum hydrogen concentration from the environment, HE, expected to be compared with the critical diffusible hydrogen concentration for delayed fracture, HC, should be carefully examined.
3.3. Corrosion Behavior Monitored by using ACM Sensor
In order to understand the effect of corrosion rate on the hydrogen entry behavior, ACM current of a sensor corroded by CCT was measured under the varied relative humidity. Figure 9 shows the change in the ACM current output from the ACM sensor pre-corroded by 30 cycles of CCT. Because of the limitation of the lifetime of the ACM sensor under the harsh CCT condition, pre-corrosion of longer CCT could not be performed.

The ACM current increased with increasing relative humidity, and the ACM current became high and almost stable for more than 10 h at 98%RH. The increase in the ACM current with humidity was correspondent to that of the hydrogen permeation current. When the relative humidity was decreased from 98%RH to 80%RH, a spike of ACM current appeared and its height was roughly twice as high as the ACM current at 98%RH. The obvious increase in ACM current is probably because of the decrease of thickness of water layer associated with promotion of diffusion controlled oxygen reduction reaction.33,34,35) Though the increase in corrosion rate according to the enhancement of oxygen reduction reaction does not directly increase hydrogen entry, the increase in dissolved Fe2+ ions and decrease of pH caused by the hydrolysis of Fe2+ ions maybe gives rise to promote the hydrogen entry efficiency during drying process. The effect of rust layer and corrosion rate will be discussed later.
3.4. Correspondence between Hydrogen Permeation Current Density and Hydrogen Content Measured by Means of Thermal Desorption Analysis (TDA)
In this section hydrogen content measured by means of TDA after CCT is shown. Figure 10 shows representative hydrogen desorption curves of boron-bearing steel after 150 cycles of CCT. The corroded specimen was kept at 50%RH and 30°C for 24 h or 0 h before TDA. The hydrogen desorption peak of the specimen kept at 50%RH after CCT was obviously higher than that of the specimen measured directly after CCT. This indicates that hydrogen entry was enhanced during keeping the specimen at 50%RH. This result is in agreement with increase in hydrogen permeation current density of a pure Fe specimen corroded by 150 cycles of CCT during keeping at 50%RH after wetting (Fig. 5(b)).

In order to know the influence of corrosion condition consisting the CCT cycle, diffusible hydrogen content was measured after the end of each constituent stages of CCT. The cycle number of the CCT was 150. Furthermore, specimens corroded by 150 cycles of CCT were kept at dry (50%RH), wet (98%RH) or salt spray condition for 24 h and the hydrogen contents in the specimens were measured. The measured hydrogen contents are shown in Fig. 11. The diffusible hydrogen content measured after the end of salt spray stage was slightly higher than that measured after the ends of dry and wet stages suggesting the influence of severe corrosive condition. The range of hydrogen content measured after CCT was from about 0.01 to 0.02 wppm (ppm by weight). In contrast, the hydrogen content measured after keeping the specimens after each CCT-constituent condition for 24 h was obviously higher than that measured after CCT, and the order of the hydrogen content was Salt spray > Dry > Wet. It is noteworthy that the keeping corroded specimen at any condition resulted in the increase of hydrogen content. The most remarkable increase in the hydrogen content after salt spray is most probably due to the highest corrosion rate under salt splay. According to the continuous monitoring of hydrogen permeation current of Fe sheet specimen during the CCT, the hydrogen permeation current was high at wet and salt spray stages at around 100th cycle of CCT.27) The hydrogen permeation current showed a slight peak at the beginning of dry stage and then decreased. The change in hydrogen entry of the boron-bearing steel specimen corroded by 150 cycles of CCT and used for the TDA measurement seems to be similar to that of the 100-cycles-CCTed Fe specimen in the previous paper. Then, the prolonged wet stage is considered to increase the hydrogen content because the surface concentration of hydrogen is kept high and the hydrogen distribution becomes more homogeneous during the process. Though hydrogen permeation current decreased in the dry stage of the CCT cycle which continues 5.75 h, the prolonged dry stage resulted in the obvious increase in hydrogen entry as shown in Fig. 5(b) and this increase is most probably responsible for the high hydrogen content measured after keeping the CCTed specimen at dry condition for 24 h.

Thus, the hydrogen entry behavior of corroded specimen was significantly influenced by the environmental condition. Therefore, careful consideration is required to know the hydrogen entry behavior and to estimate the maximum hydrogen content from the environment, HE, for the evaluation of the susceptibility of steels to delayed fracture.
3.5. Estimation of Hydrogen Content using Hydrogen Permeation Current
The maximum hydrogen permeation current densities of Fe specimens rusted by 150 cycles of CCT were 0.18 μA/cm2 and 0.25 μA/cm2 at 98%RH and 50%RH, respectively (Fig. 6). Assuming that the Eq. (3) for the steady state hydrogen permeation36) is applicable, the hydrogen concentration just beneath the metal surface of hydrogen entry side, C0, can be estimated.
Here, L thickness, i hydrogen permeation current density, D diffusion coefficient of hydrogen, and F Faraday constant. The value of D for the rolled pure Fe sheet used in this study is 6.0×10⁻¹¹ m2/s.28)
The calculated C0 of the pure Fe specimens corroded by 150 cycles of CCT and kept at 98%RH and 50%RH for 24 h are 0.016 and 0.022 wppm, respectively. Here, the density of Fe is 7.86 g/cm3. L is assumed to be 0.4 mm because of the corrosion loss from the initial thickness of 0.5 mm during 150 cycles of CCT. It has been reported by Kushida et al. that the factor of hydrogen permeation current density divided by the thickness was almost the same for any steels under the same hydrogen introduction condition.37) Therefore, assuming that the hydrogen permeation current density of the boron-bearing steel is the same as that of the pure Fe specimen and that the diffusion coefficient of hydrogen in the boron-bearing steel is 4.5×10⁻¹¹ m2/s,8,38)C0 of the boron-bearing steel can be estimated. Thus, the estimated values of C0 of the boron-bearing steel corroded by 150 cycles of CCT and kept at 98%RH and 50%RH are 0.021 wppm and 0.029 wppm, respectively. These values are in good agreement with the experimentally obtained hydrogen concentration in the boron-bearing steel shown in Fig. 11, though some assumptions were used for this calculation. This agreement suggests that hydrogen concentration can be estimated quantitatively using electrochemical hydrogen permeation method.
3.6. Effect of Rust Layer on Hydrogen Entry
The presumable reactions taking place on the rusted metal surface is shown in Fig. 12. In order to simplify the model, only some representative possible reactions are listed in the figure. Hydrogen entry is caused by corrosion. In a neutral condition of atmospheric corrosion, most of the cathodic reaction as the counter reaction to the anodic dissolution of Fe (Eq. (4)) is oxygen reduction reaction (Eq. (5)). However, hydrogen reduction reaction also takes place partially (Eqs. (7), (8)), and a part of the adsorbed hydrogen, Hads, formed as the intermediate intrude into the metal (Eq. (9)). The ratio of hydrogen reduction reaction to the total cathodic reaction is considered to increase if the pH is decreased or the potential is decreased.

According to the hydrolysis of dissolved Fe2+ ions, pH is decreased (Eqs. (1) and (2)). On the other hand, because of the oxygen reduction (Eq. (5)) pH is increased. Hydrogen reduction reaction (Eq. (7)) also increases pH though the ratio of the reaction seems not that high as far as the ratio of hydrogen reduction to the total cathodic reaction is not high. After the formation of FeOOH (Eq. (11)) by oxidation of Fe(OH)2, reduction reaction of FeOOH takes place (Eq. (10)),39,40) and this magnetite formation reaction does not contribute to increase pH. Therefor, when the ratio of magnetite formation to the total cathodic reaction is increased, loss of neutrality is caused and the pH is decreased. The decrease in pH in the inner rust layer presumably leads to the enhancement of hydrogen reduction reaction (Eq. (7)) and hydrogen entry (Eq. (9)).
The enhancement of hydrogen entry with CCT cycle number shown in Figs. 5 and 6 is probably attributable to the decrease of pH in the inner rust layer with the growth of rust layer.19) The decrease of pH with CCT cycle number have been observed by using W/WO3 electrode probe in our previous study,28) and the observation result support the hypothesis. As well as the long-term change of the rust layer, the distribution of pH and oxidized Fe species presumably changes in short-term according to the change in environmental factors such as humidity. During drying process, concentrations of H+ and incorporated chloride ion may increase and the concentration probably enhance hydrogen entry before the rust layer is totally dried up. As shown in Figs. 5 and 6, the hydrogen permeation current increased in the drying process after wetting the specimen, and the peak hydrogen permeation current density increased and the time to peak increased as the CCT cycle number was increased. The increase in time to the hydrogen permeation current peak is probably interpreted in terms of the thickening of rust layer with CCT cycle number and the increase in the time to dry the rust layer.
The other factors such as potential21) and the role of structure of rust, e.g. magnetite having hydrogen evolution mechanism different from Fe,41,42,43) are considered to have effects on hydrogen entry as well. Further investigation of hydrogen entry phenomenon under atmospheric corrosion is required for better understanding of delayed fracture and for establishment of evaluation method for delayed fracture susceptibility of high strength steels.
4. Conclusions
Hydrogen entry behavior of rusted Fe and steel specimens was investigated using electrochemical hydrogen permeation test under controlled temperature and humidity. Hydrogen entry was enhanced when the relative humidity was increased, and the growth of rust layer formed by cyclic corrosion test (CCT) prior to the hydrogen permeation test resulted in an enhancement of hydrogen entry at the wet condition.
During the drying process after the wetting, hydrogen permeation current showed a peak, and the peak hydrogen permeation current became higher than that at the wet process when the rust layer became thick. The peak hydrogen permeation current increased with the growth of rust layer. Furthermore, the time to the peak hydrogen permeation current increased. The change in the hydrogen permeation current is presumably interpreted in terms of the change in the nature of rust layer during drying process, and the shift of the peak is probably attributed to the thickening of rust layer. Similar enhancement of hydrogen entry during drying was observed for a specimen exposed to the actual outdoor environment. The enhancement of hydrogen uptake during drying after wetting should be taken into account for the evaluation of concentration of hydrogen from environment and delayed fracture susceptibility of high strength steels.
The diffusible hydrogen concentration estimated from electrochemical hydrogen permeation test is in good agreement with the diffusible hydrogen content measured by means of thermal desorption analysis (TDA), suggesting that hydrogen permeation test allows us to estimate the maximum hydrogen concentration under atmospheric corrosion condition.
Acknowledgments
Thanks are due to Mrs. R. Araki and Mrs. Y. Hirota of National Institute for Materials Science for the assistance of TDS measurements and CCT, respectively. Thanks are also due to Japanese Society of Steel Construction for provision of the SCM435H steel sheet specimens for hydrogen permeation test exposed at the National Institute for Materials Science for 2 years which was used for a project of evaluation of delayed fracture property of high strength bolts.14)
References
- 1) N. Suzuki, N. Ishii, T. Miyagawa and H. Harada: Tetsu-to-Hagané, 79 (1993), 227.
- 2) S. Yamasaki and T. Takahashi: Tetsu-to-Hagané, 83 (1997), 454.
- 3) K. Hirai, K. Wakiyama and N. Uno: J. Struct. Constr. Eng., 490 (1996), 215.
- 4) M. Q. Wang, E. Akiyama and K. Tsuzaki: Corros. Sci., 48 (2006), 2189.
- 5) M. Wang, E. Akiyama and K. Tsuzaki: Scr. Mater., 53 (2005), 713.
- 6) M. Wang, E. Akiyama and K. Tsuzaki: Corros. Sci., 49 (2007), 4081.
- 7) M. Q. Wang, E. Akiyama and K. Tsuzaki: Mater. Sci. Eng., A398 (2005), 37.
- 8) M. Q. Wang, E. Akiyama and K. Tsuzaki: Scr. Mater., 52 (2005), 403.
- 9) M. Q. Wang, E. Akiyama and K. Tsuzaki: Mater. Sci. Technol., 22 (2006), 167.
- 10) Y. Hagihara, C. Ito, N. Hisamori, H. Suzuki, K. Takai and E. Akiyama: Tetsu-to-Hagané, 94 (2008), 215.
- 11) Y. Hagihara, C. Itoh, D. Kirikae, N. Hisamori, H. Suzuki and K. Takai: Tetsu-to-Hagané, 95 (2009), 489.
- 12) Y. Hagihara, T. Shobu, N. Hisamori, H. Suzuki, K.-i. Takai and K. Hirai: Tetsu-to-Hagané, 97 (2011), 143.
- 13) Y. Hagihara, T. Shobu, N. Hisamori, H. Suzuki, K.-i. Takai and K. Hirai: ISIJ Int., 52 (2012), 298.
- 14) E. Akiyama, N. Uno, T. Takahashi, Y, Hagihara, K. Hirai, K. Matsuoka, S. Matsuyama and A. Mukai: JSSC Tech. Rep., 91 (2010).
- 15) E. Akiyama, K. Matsukado, S. Li and K. Tsuzaki: Appl. Surf. Sci., 257 (2011), 8725.
- 16) S. Li, Z. Zhang, E. Akiyama, K. Tsuzaki and B. Zhang: Corros. Sci., 52 (2010), 1660.
- 17) S. Li, E. Akiyama, N. Uno, K. Hirai, K. Tsuzaki and B. Zhang: Corros. Sci., 52 (2010), 3198.
- 18) S. Li, E. Akiyama, Y. Kimura, K. Tsuzaki, N. Uno and B. Zhang: Sci. Technol. Adv. Mater., 11 (2010), 025005.
- 19) E. Akiyama, K. Matsukado, M. Wang and K. Tsuzaki: Corros. Sci., 52 (2010), 2758.
- 20) T. Omura, T. Kushida, H. Nakazato, S. Watanabe and I. Oyamada: Tetsu-to-Hagané, 91 (2005), 478.
- 21) T. Tsuru, Y. Huang, M. R. Ali and A. Nishikata: Corros. Sci., 47 (2005), 2431.
- 22) R. Nishimura, D. Shiraishi and Y. Maeda: Corros. Sci., 46 (2004), 225.
- 23) M. A. V. Devanathan and Z. Stachurski: J. Electrochem. Soc., 111 (1964), 619.
- 24) M. A. V. Devanathan, Z. Stachurski and W. Beck: J. Electrochem. Soc., 110 (1963), 886.
- 25) T. Omura, T. Kudo and S. Fujimoto: Mater. Trans. JIM, 47 (2006), 2956.
- 26) T. Kushida: ISIJ Int., 43 (2003), 470.
- 27) T. Omura: ISIJ Int., 52 (2012), 267.
- 28) E. Akiyama, S. Li, T. Shinohara, Z. Zhang and K. Tsuzaki: Electrochimica Acta, 56 (2011), 1799.
- 29) NIMS Corrosion Data Sheet, No. 3A, National Institute for Materials Science, Tsukuba, (2007).
- 30) S. Motoda, Y. Suzuki, T. Shinohara, Y. Kojima, S. Tsujikawa, W. Oshikawa, S. Itomura, T. Fukushima and S. Izumo: Zairyo-to-Kankyo, 43 (1994), 550.
- 31) K. Takai and R. Watanuki: ISIJ Int., 43 (2003), 520.
- 32) T. Omura, T. Kushida, T. Kudo, H. Nakazato and S. Watanabe: Zairyo-to-Kankyo, 54 (2005), 61.
- 33) T. Tsuru, A. Nishikata and J. Wang: Mater. Sci. Eng., A198 (1995), 161.
- 34) A. Nishikata, Y. Yamashita, H. Katayama, T. Tsuru, A. Usami, K. Tanabe and H. Mabuchi: Corros. Sci., 37 (1995), 2059.
- 35) N. D. Tomashov: Corrosion, 20 (1964), 7t.
- 36) J. McBreen, L. Nanis and W. Beck: J. Electrochem. Soc., 113 (1966), 1218.
- 37) T. Kushida, H. Matsumoto, N. Kuratomi, T. Tsumura, F. Nakasato and T. Kudo: Tetsu-to-Hagané, 82 (1996), 297.
- 38) S. Sakashita, E. Akiyama, K. Tsuzaki and T. Takahashi: CAMP-ISIJ, 15 (2002), 576.
- 39) U. R. Evans and C. A. J. Taylor: Corros. Sci., 12 (1972), 227.
- 40) U. R. Evans: Nature, 206 (1965), 980.
- 41) T. Shibata, M. Seo, K. Sugimoto, T. Tsuku, S. Fujimoto and H. Inoue: Zairyo-to-Kankyo, 54 (2005), 2.
- 42) T. Tsuru, M. R. Ali, A. Araoka and A. Nishikata: JNC TJ8400 2001-008, J. S. o. C. Engineering, Tokyo, (2001), 63.
- 43) T. Tsuru and A. Nishikata: JNC TJ8400 2001-008, J. S. o. C. Engineering, Tokyo, (2002), 63.

