Abstract
Carbon and manganese combined effect on the mechanical behavior of martensite was characterized and analyzed using literature and new experimental data of various carbon-manganese steels. A synergy effect of carbon and manganese on the martenstite strength and strain hardening was detected and was then taken into account in a specific way in the simplified model, based on a Continuous Composite Approach. Model was adjusted with only one fitting parameter and the obtained results are in good agreement with experimental stress-strain curves.
1. Introduction
Martensite is one of the hardest phases in the steel and also one of the most complex due to its “natural” nanostructure. Development of almost all very high strength steels for automotive or industry market is hardly possible without use of this constituent. Dual-Phase steel is a common example of martensite use, when its strength is combined with the ductility of ferrite to offer a large range of strength-ductility balances for different applications. A lot of studies concerning martensite structure and strength are already done and the obtained scientific knowledge is synthesized in form of reviews.1,2)
Mechanical behavior of martensitic steel seems to be mainly controlled by one major factor – its initial carbon content. The evolution of martensite hardness related to its carbon content2) is probably the most generally acknowledged correlation between a mechanical and a metallurgical parameter. Influence of other microstructural characteristics like sizes of laths, packets or prior austenite grains is still widely discussed in the literature.3,4,5)
Surprisingly, the amount of considerations in the literature about strain-hardening mechanisms of martensitic steels is quite low, probably related to their poor uniform elongation (i.e. necking strain). Principally, the mechanical behavior of martensite is described either with phenomenological polynomial law6) or it is reduced to an elastic or an elastic-perfectly plastic law.7) However, recently a Continuum Composite Approach (CCA) was proposed to predict the complete tensile curves of as-quenched martensitic steels.8) The general idea of this approach is to consider martensite as a composite of elastic-perfectly plastic phases in interaction. All the phases have the same Young modulus, and the density of probability to find a phase with a given yield strength defines the so-called “stress spectrum”. This permits to describe the tensile behavior of martensite in a univocal way.
Although, there is an important quantity of data about different alloying elements influence on the martensite hardness,9,10) a few data are found about the substitutional elements influence on the strain hardening of martensitic steels.11) In the present work, Mn effect on the strain hardening of martensitic steels is characterized. Based on CCA a simplified model to describe the mechanical behavior of martensite is proposed and a special manner to introduce the influence of Mn addition is suggested.
2. Experimental Procedure
Four steels with different combinations of carbon (C) and manganese (Mn) contents were prepared using vacuum induction melting. The chemical compositions of these steels, as well as of some selected C–Mn steels from previously published studies are shown in Table 1. The slabs were hot rolled, and then cold rolled to 1.2 mm thickness. Cold rolled specimens were austenitized 10°C above Ac3 temperature (the temperature is indicated in Table 1) for 30 minutes, and then water quenched (~1000°C/s). For each steel two tensile tests at a constant strain rate of 0.008 s–1 were performed on the samples with gauge length 50 mm and width 12.5 mm, according to the ISO procedure. Table 2 shows the measured tensile properties of studied steels.
Table 1.Chemical composition of studied and previously published steels (wt.%), holding temperature for the studied steels and corresponding references. For each steel first column gives the reference (Steel) that will be used further in the article.
| Steel | Composition (wt.%) | Thold (°C) (Ac3+10°C) | Source |
|---|
| C | Mn | Si | Cr | Ti |
|---|
| 0.3C | 0.29 | 1.20 | 0.25 | 0.17 | 0.04 | 850 | This study |
| 0.36C | 0.36 | 1.22 | 0.23 | 0.10 | 0.04 | 830 | This study |
| 0.1C–5Mn | 0.10 | 4.74 | – | – | – | 760 | This study |
| 0.15C–5Mn | 0.15 | 4.73 | – | – | – | 750 | This study |
| 0.01C–3Mn | 0.01 | 2.92 | 0.01 | 0.11 | 0.04 | | Zhu et al.12) |
| 0.09C | 0.09 | 1.90 | 0.15 | 0.10 | – | | Allain et al.8) |
| 0.15C | 0.15 | 1.90 | 0.22 | 0.20 | – | | Pushkareva I.13) |
| 0.22C | 0.22 | 1.18 | 0.27 | 0.21 | – | | Allain et al.8) |
“–” means less than 0.01 wt.% for Si and Cr and less than 0.001 wt.% for Ti.
Table 2.Measured mechanical properties of studied steels: yield strength (YS
0.2), ultimate tensile strength (UTS), uniform (Uel) and total (TE) elongation, respectively.
| Ref. | YS0.2 [MPa] | UTS [MPa] | Uel [%] | TE [%] |
|---|
| 0.3C | 1333 | 1875 | 3.3 | 4.6 |
| 0.36C | 1439 | 2150 | 4.0 | 6.3 |
| 0.1C–5Mn | 1049 | 1387 | 3.0 | 5.2 |
| 0.15C–5Mn | 1258 | 1663 | 3.7 | 3.7 |
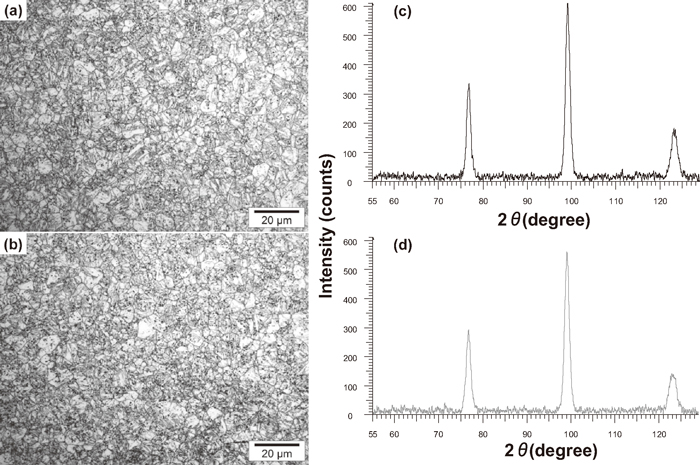
To confirm the martensitic state of two medium Mn (4.7 wt.%) steels, the microstructure of quenched samples was investigated using optical microscope and X-ray diffraction. So-called Dino etching was used to reveal the microstructure. Dino etchant was prepared from the following chemical compounds: 140 ml of distilled water, 100 ml of hydrogen peroxide (H2O2 30%), 4 g of ethane diacid (C2H2O4–2H2O), 2 ml of sulphuric acid (H2SO4) and 1.5 ml fluohydric acid (HF). The applications of Dino reagent are miscellaneous. Generally, it can be used to reveal different microstructure constituents and in some cases their boundaries. In our case it was utilized in order to reveal martensitic microstructure and to verify if any ferrite was formed during cooling. Figure 1 shows the outcomes of this analysis. Figures 1(a) and 1(b) present a typical lath martensite structure with the revealed prior austenite grain boundaries, also the absence of ferrite was confirmed. X-ray diffraction (XRD) with Co Kα radiation was applied in order to reveal the presence of retained austenite. The X-ray spectra (Figs. 1(c) and 1(d)) demonstrate only ferritic peaks: (220)α, (211)α and (200)α. Hence it is concluded that the structure is fully martensitic.
3. Results and Discussion
Figure 2 presents the results of experimental tensile tests performed in the present study along with the results collected from the previous works.8,12,13) The true stress evolution as a function of true strain is shown in Fig. 2(a), meanwhile Fig. 2(b) shows the related strain hardening rate evolution as a function of true stress (so-called Kocks-Mecking plot14,15)). For all studied martensitic steels some general highlights can be stated:
• Conventional yield stress seems to be a function of martensite carbon and manganese contents.
• High work-hardening rate is observed and it increases up to necking strain in accordance with the carbon and manganese contents.
From Fig. 2(a) it can be seen that the true stress-true strain curve of 0.1C–5Mn is almost the same as for 0.15C, and that the true stress-true strain curve of 0.15C–5Mn is in between the curves of 0.22C and 0.3C. The same conclusion can be deduced from Fig. 2(b) which demonstrates the strain hardening evolution. The solid solution hardening of Mn cannot explain this difference in the behavior of martensitic steels with high Mn content. Modification of solid solution hardening only shifts the curves to higher stress levels, but in the case of medium Mn steels a clear change in strain hardening of martensite can be found. According to F.B. Pickering and T. Gladman16) the solid solution hardening of Mn can be evaluated using following relation: SMn*Mn wt.%, where SMn = 32. This means that each percent of Mn increases strength on 32 MPa and for 4.7 wt.% of Mn the strength should increase on about 150 MPa. Figure 2(c) shows the experimental curves of 0.15C and 0.15C–5Mn, but also 0.15C curve shifted up at 150 MPa. This figure proves that such shift is not sufficient to match with 0.15C–5Mn; there are still about 125 MPa missing. But also the strain hardening rate, which is depicted in Fig. 2(b) is not the same. Thus it is considered that simple solid solution hardening cannot explain the behavior of martensite with medium content of Mn. It can be also observed from the Figs. 2(a) and 2(b) that the influence of Mn on stress and on strain hardening in the case of small carbon content (0.01C–3Mn) is rather limited. All these facts suggest that Mn content influences the martensite strength and strain hardening in obvious synergy with the carbon content of martensite.
Based on the CCA approach,8) a simplified behavior law for martensitic steels is proposed. In order to describe the stress-strain curve of martensite as a large elasto-plastic transition the strain hardening can be expressed as the product of Young modulus (E) by the fraction of elastic zones (1 – F):
where
σ and
ε are respectively the macroscopic stress and strain of the material.
The plasticized zones fraction F is chosen as a logistic law:
|
F=1-exp(
-
(
σ-
σ
min
σ
0
)
p
)
| (2) |
where
σmin is the minimum stress necessary to start to plasticize and,
p and
σ0 are the parameters that control the shape of F(
σ) curve (
Fig. 3(a)). In the first stage of tensile test, the macroscopic stress is lower than the elastic threshold (
σ<
σmin), hence F = 0 and the material exhibits completely elastic behavior. When the applied stress (
σ) became more important than
σmin, then F starts to increase, meaning that the plasticized zones fraction increases.
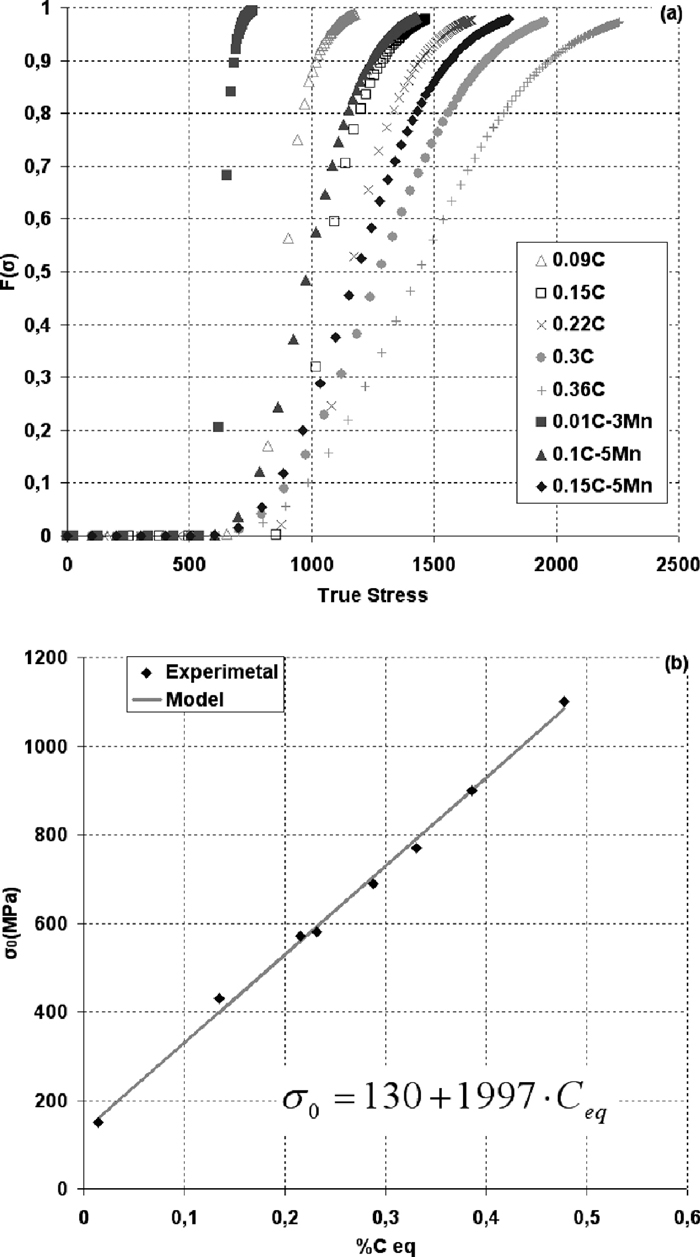
Model adjustment with the experimental and literature data shows that σmin and p can be taken as constants for all considered steels, and the following values are found to be optimal: σmin = 450 MPa and p = 2.5. Thus, only one variable parameter, σ0, is used to obtain the best fitting results between model and experiments. It is found that both C and Mn have an important influence on σ0. A linear dependence between σ0 and Ceq is established in the form of subsequent equation:
where
Ceq is the parameter that considers the concomitant influence of
C and
Mn. It is proposed to take into account this synergy of
C and
Mn in the following way:
|
C
eq
=C⋅(
1+
Mn
K
Mn
)
| (4) |
where
C and
Mn represent initial
C and
Mn (wt.%) contents, and
KMn is the coefficient of the
Mn influence. Finally, from the collected experimental data (
Tables 1,
2 and
Fig. 2) it is possible to find the optimum value for
KMn = 3.5.
The σ0 evolution with Ceq is shown in Fig. 3(b): experimentally adjusted points are compared to the ones predicted with Eq. (3).
The final results of the model are presented and compared to the experimental data in Fig. 4. The results of stress-strain curves prediction are separated into two graphs (Figs. 4(a) and 4(b)) to have a better vision of medium Mn steels curves. As it can be seen, this simple model accurately predicts the whole stress-strain curves of different martensitic steels with varied C and Mn contents. On the other hand, it can be noticed that the simulated curves are not perfect and there are some mismatches. However, the maximum difference between model and experimental curves in terms of stress is less than 60 MPa and this represent less than 5% of the maximum flow stress.
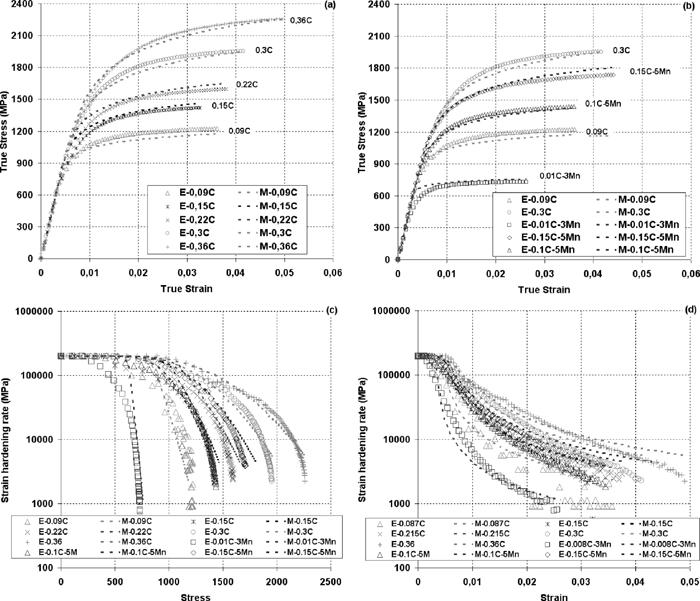
Figures 4(c) and 4(d) present the evolution of strain hardening rate as a function of stress and as a function of strain, respectively. Taking into account that modeling of derivative is more complex than modeling of a function itself; the proposed model gives very satisfactory results of strain hardening rate evolution. These figures also shows that the model accounts well the synergy influence of C and Mn on the strain hardening rate evolution.
Even though the results are satisfactory, it is evident that the proposed model is a simplified version of CCA published previously,8) hence the global description of stress-strain curves is less precise, especially elasto-plastic transition. This can be clearly seen on the stress-strain curves of 0.22C, 0.15C and in particular 0.01C–3Mn steels. The discrepancy of the model is also related to the fact that only one fitting parameter is considered. This is done deliberately in order to simplify the understanding of the observed phenomenon of C–Mn synergy. Model response can be easily improved by relaxing the constraints on σmin making it variable and not constant. Nevertheless, to obtain good correlation between σmin and some metallurgical or microstructural parameters more data and studies are needed.
Future works are also necessary to understand physical mechanism of this C–Mn synergy and its relation with the microstructure. The outputs of these further investigations will be probably very helpful for further model improvement.
4. Conclusions
Mechanical behavior of martensite was studied using literature and new experimental data obtained on two medium carbon and two medium manganese steels. It was found that manganese increases strength and strain hardening of martensite in synergy with its carbon content. This synergy between carbon and manganese was taken into account in a specific way and the coefficient of the manganese influence was adjusted. More pragmatic model to describe mechanical response of martensitic steels was proposed based on Continuous Composite Approach developed previously. The results of adjusted model with only one fitting parameter showed very satisfactory agreement with the experimental data.
As the understanding of physical mechanism explaining the reported synergy between manganese and carbon on the behavior of martensite is not available, future investigations are planned in order to link the macroscopic martensite behavior and the related microstructure in presence of carbon and manganese.
Acknowledgements
The authors wish to express their gratitude to J. D. Puerta Velasquez from ARCELORMITTAL for sharing his knowledge and experimental results.
The authors are also grateful to D. Bouleau and J. Drillet from ARCELORMITTAL for their important contribution in the development of the metallographic etchings.
References
- 1) G. B. Olson and W. S. Owen: Martensite, A tribute to Morris Cohen, ASM International, OH, (1992).
- 2) G. Krauss: Mater. Sci. Eng., A273–275 (1999), 40.
- 3) M. J. Roberts: Metall. Trans., 1 (1970), 3287.
- 4) M. Kehoe and P. M. Kelly: Scr. Metall., 4 (1970), 473.
- 5) S. Morito, H. Yoshida, T. Maki and X. Huang: Mater. Sci. Eng., A438–440 (2006), 237.
- 6) K. S. Choi, W. N. Liu, X. Sun and M. A. Khaleel: Metall. Mater. Trans. A, 40A (2009), 796.
- 7) M. Delincé, Y. Bréchet, J. D. Embury, M. G. D. Geers, P. J. Jacques and T. Pardoen: Acta Mater., 55 (2007), 2337.
- 8) S. Allain, O. Bouaziz and M. Takahashi: ISIJ Int., 52 (2012), No. 4, 717.
- 9) R. A. Grange, C. R. Hribal and L. F. Porter: Metall. Trans., 8A (1977), 1775.
- 10) N. Yurioka, M. Okumura, T. Kasuya and H. J. U. Cotton: Met. Constr., 19 (1987), No. 4, 217R.
- 11) A. G. Vasil’eva, D. A. Prokoshkin and V. V. Goryushin: Met. Sci. Heat Treat., 16 (1974), No. 6, 507.
- 12) K. Zhu, O. Bouaziz, C. Oberbillig and M. Huang: Mater. Sci. Eng., A527 (2010), 6614.
- 13) I. Pushkareva: PhD report, INPL, (2009), http://pegase.scd.inpl-nancy.fr/theses/2009_PUSHKAREVA_I.pdf.
- 14) U. F. Kocks and H. Mecking: Prog. Mater. Sci., 48 (2003), 171.
- 15) H. Mecking and U. F. Kocks: Acta Metall., 29 (1981), 1865.
- 16) F. B. Pickering and T. Gladman: Metallurgical Developments in Carbon Steels, Iron and Steel Institute, Special Report, No. 81, London, (1963), 10.