Regular Article
Cementite Formation from Magnetite under High Pressure Conditions
2013 Volume 53 Issue 6 Pages 950-957
Details
2013 Volume 53 Issue 6 Pages 950-957
Measurements have been made of the rate of Fe3C formation from Fe3O4 powder and Fe3O4 single crystals at 773 K and 1023 K under the high pressure of 0.5 and 1.0 MPa by using thermo-gravimetric method. Along with the kinetic study of Fe3C formation, high resolution TEM observation around the interface between Fe3O4 matrix and the formed Fe3C have been carried out to confirm the thermodynamically possible direct Fe3C formation from Fe3O4 without the formation of intermediate metallic Fe. Analysis of the rate results suggests that the reaction mechanism of Fe3C formation was possibly described by the sequential reactions of the conversion of Fe3O4 to Fe3C via intermediate metallic Fe although the metallic Fe existence was not confirmed by TEM observation. This inconsistency was explained by considering the relative reaction rates of Fe3C formation from Fe and Fe formation from Fe3O4. It was also found that not only the carbon activity of more than unity but also the low oxygen potential enough for metallic Fe existence might be required for the Fe3C formation.
The steel industry is known to produce the huge amount of CO2. In the conventional ironmaking process based on BF (blast furnace), approximately 500 kg of carbon (coke and pulverized coal) is required to produce 1 ton of hot iron, and about 2 ton of CO2 was emitted consequently. Thus, steel industries have been strongly asked to decrease CO2 emission. To meet the demand to reduce CO2 emission from steel works, many efforts and attempts have been carried out such as replacing carbonaceous materials with hydrogen and/or coke oven gas.1) However, these approaches are still away from the industrial practice due to several technical problems.
Instead of developing new low CO2 emission iron/steelmaking processes, one of plausible approaches to reduce CO2 emission from steel industries is EAF (Electric Arc Furnace) steelmaking process to use scrap instead of iron ore, and is already in practice. However, scrap is generally contaminated by tramp elements such as Cu and Sn, the steels produced by using these scraps cannot be fully replaced by the high quality steels produced by BF-BOF (basic oxygen furnace) system, or virgin iron must be charged with scarp to dilute the harmful elements for the production of high quality steel for the sheet production. Besides with this quality problem, the price of scarp is often fluctuated severely in the market. Thus, the stable supply of iron resources for EAF is very desirable to develop the low CO2 emission steelmaking process.
Concerning these problems, DRI (Direct Reduced Iron) charges with scarp into EAF have attracted a lot of attention.2) The transportation and storage of the powder form of DRI, however, is not so safe due to its pyrophoric character so as to shape into briquettes with extra cost and time.
Another possible charging material to EAF will be Fe3C.2,3) Fe3C has valuable feasibility for using in steelmaking processes where it acts as an alternative pure iron resource without many environmental and economical drawbacks. It is nonpyrophoric so that easily transported and stored due to the oxidation resistivity up to 550 K. Consequently, no briquetting required which means using fine ores in its preparation with economical benefits. Beside that it can save electrical energy since it contains carbon as a chemical energy source. Fe3C has very low levels of metallic contaminants and, in general, low sulphur and phosphorus contents. All these properties make Fe3C very suitable as scrap substitute or supplement in EAF steelmaking. Thus, Fe3C can be a promising raw material not only for decreasing CO2 emission in iron/steel production processes but also for the high-quality steel production.
In addition, Fe3C has a potential as a hydrogen source or hydrogen storage material.4,5) It was found that the H2 was predominantly produced by the reaction of Fe3C with steam at less than 773 K;
| (1) |
| (2) |
Due to these industrial and academic interests, many studies have been carried out for the Fe3C formation.6,7,8,9,10,11,12,13,14,15,16,17,18,19,20,21) Despite of these many studies, the details of the reaction mechanism of Fe3C formation and its physical properties have not yet been established well. The reason for the lack in knowledge mainly comes from the metastability of the carbide causing experimental difficulties. For the formation of Fe3C, the activity of carbon in the carburizing gas must be maintained at more than unity (relative to graphite), otherwise the formed Fe3C easily decomposes to form the most stable state; metallic iron and graphite. In other words, the formation of Fe3C is always potentially associated with the carbon precipitation from the gas phase. Once carbon deposition occurs at the reacting surface, Fe3C formation is terminated. Thus, the formation of free carbon or carbon deposition must be avoided for the effective Fe3C mass production system.
The experiments for Fe3C formation by Fe carburization have been extensively carried out and its reaction mechanism is reasonably well established. Namely, after a supersaturation of the iron with dissolved carbon at aC >1, carbide layer is formed on the iron surface.6) However, Conejo et al.10) suggested that iron oxides could be converted directly into iron carbides in a carburizing and reducing gas atmosphere on the basis of the metastable Fe–C–O phase diagram. F. Bonnet et al.15) studied the iron oxides conversion into Fe3C by thermogravimetry in an iso–C4H10–H2–Ar mixture with aC = 6710 at 873 K. Fe3O4 is rapidly converted into Fe3C and they confirmed that metallic Fe is not an intermediary species from XPS spectra analysis. Shroff et al.18) said that magnetite transforms into carbide based on high resolution TEM observation. Sato et al.11) reported that at the particular experimental condition, Fe3C seemed to be formed directly from Fe2O3 without formation of Fe. Differed from the case of the Fe3C formation from the carburization of Fe, the reaction mechanism of direct Fe3C formation from the iron oxides carburization has not been well studied.
The Fe–C–O phase stability diagram at 1023 K is shown in Fig. 1. In the figure, the relations between the oxygen potential (pO2) and the carbon activity (aC) are shown as a function of total pressures. The points a, b, and c are the experimental conditions in the present study and will be discussed later. The phase rule applied to univariant equilibria for the Fe–C–O system yield the following analysis;
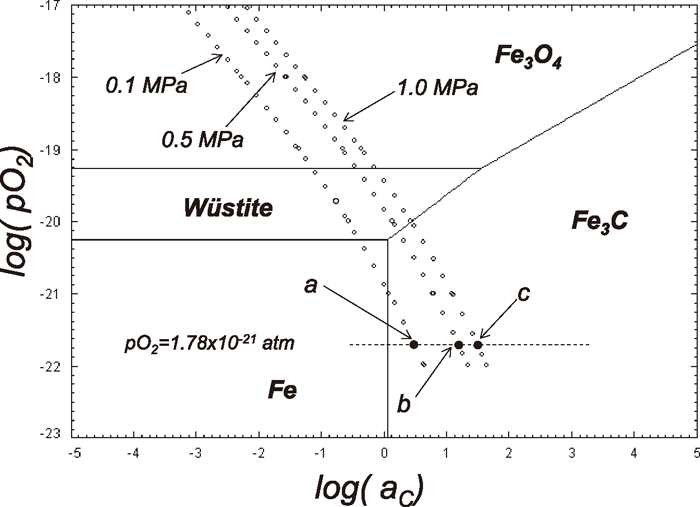
Fe–C–O phase stability diagram at 1023 K with the relation between pO2 and aC under the total pressures of 0.1, 0.5 and 1.0 MPa. The points a, b and c show the experimental conditions in the present study. The unit of pO2 in the figure is with atm.
Thus, the degrees of freedom available indicate that only two variables can be arbitrarily fixed. Since the degree of freedom is 2, the carbon activity, aC and pO2 cannot be changed independently once temperature and total pressure of the system are fixed. Thus, pO2 and aC varies along the line with the constant total pressure. As shown in Fig. 1, the direct Fe3C formation from wüsite at 1023 K under 0.1 MPa is thermodynamically impossible. However, the direct Fe3C formation from wüstite is thermodynamically possible with the total pressure of 0.5 and 1.0 MPa. The thermodynamical possibility, however, does not mean that it is also kinetically possible since thermodynamics do not contain time factor.
The purpose of the present study is to investigate the kinetics of the Fe3C formation from iron oxides and to confirm whether the direct Fe3C formation is kinetically achievable or not.
High pressure magnetic suspension thermogravimetric analysis (TGA) system was used for the kinetic study of Fe3C formation by measuring the weight change with an accuracy of 1 μg. In the magnetic suspension balance system, a measuring microbalance is separated from a reacting cell and the suspension force is transmitted without direct contact from the pressurized reacting cell (up to 5 MPa) to the microbalance in ambient atmosphere. In the system, a vertical split tube resistance furnace was used. The experimental arrangement is schematically shown in Fig. 2. The furnace temperature was controlled by a temperature controller in conjunction with a Pt/Pt-13%Rh thermocouple located close to the wall of the working tube. Continuous sample temperature measurements were made by a second thermocouple placed very near to the base of the crucible. The furnace had an alumina working tube (20 mm ID). The samples (Fe3O4 powder or a single crystal plate) were held in an alumina crucible (12.5 mm ID and 10 mm depth). The alumina crucible was suspended by using Pt wire in the isothermal zone of the furnace. The pressure control in the reacting cell was carried out by the automatic pressure controlling system. The pressure range for this system is from 0.05 MPa up to 5.0 MPa. The gas flows into the reactor were controlled by mass flow controllers. Ar and CO–CO2 mixtures were delivered at a flow rate of 500 cm3/min into the reacting cell. Ar gas (high purity gas) was purified by passing, sequentially through columns of silica gel and Ti tips held at 773 K. The CO–CO2 mixtures were dried only before being used.
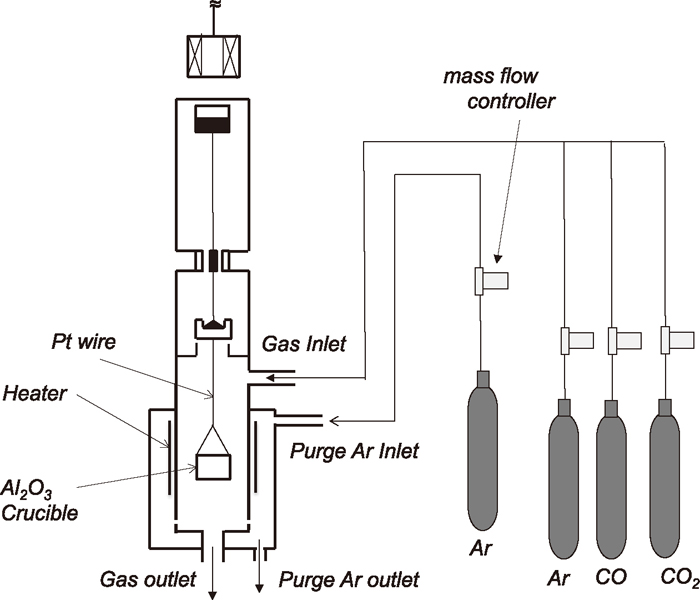
Schematic illustration of experimental arrangement.
Mass% fractions of elements in magnetite powder are shown Table 1. The magnetite single crystal compositions were analyzed by using X-ray Fluorescence method and was found to be Fe3O4 98.15 mass% and SiO2 0.57 mass% and other elements were traces. The average particle size of the magnetite powder is about 8.0 ± 4.0 μm measured by the particle size analyzer with use of laser diffraction method. The specific surface area of the powder is 4.162 m2/g, measured by using a single point BET technique. To investigate the developed phase distribution near the interface during carburization, a small piece of Fe3O4 single crystal was used. The single crystal sample after the reduction was cut into a plate (5 × 4 × 0.1 μm) for TEM observation using a focused ion beam machine (FEI QUANTA 3D).
| Fe | Al | Ca | Cr | Mg | Mn | Na | Si | Zn | |
|---|---|---|---|---|---|---|---|---|---|
| Content | 99.28 | 0.01 | 0.02 | 0.01 | 0.1 | 0.5 | 0.02 | 0.01 | 0.05 |
A typical experiment started with charging Fe3O4 powder (about 0.3 g) into a crucible and placing the crucible in the reacting cell. The reaction cell tube was heated to 1023 K and pressure was increased to the experimental pressure with Ar gas flowing (500 cm3/min). Then, Ar gas was switched to CO–CO2 gas mixture with the flow rate of 500 cm3/min after the temperature stabilized. By switching to the reacting gas, the weight was fluctuated for a while, but it stabilized after 0.5 to 1 minute. This point is defined as the starting time of the reaction. The weight change of the sample due to reduction and carburization was recorded on line with a computer. For the subsequent phase development measurements, the reaction was stopped after variable periods of 5 to 60 min by switching from the reactant gas to Ar and shut off the power and opened the split tube furnace. The samples remained in the furnace during cooling. The phase identification of the collected sample was done by using X-ray diffraction method. The measured X-ray spectra must be refined since the first peaks of Fe and Fe3C are so close that their intensities might be influenced each other. Therefore, the quantitative evaluation of the amounts of phases in the samples was carried out by applying the multiphase Rietveld phase quantification method. It is a powerful method and now widely used for determining the quantities of crystalline components in multiphase mixtures. The method relies on the simple relationship,
| (3) |
The carburization of Fe3O4 single crystal (about 1 g) was performed by using the same method as those with Fe3O4 powder. The Fe3O4 single crystal contained a small amount of Fe2O3 due the slight oxidization. To eliminate the Fe2O3 content, the crystal was equilibrated with CO–CO2 gas mixture for 5 hrs to fully convert to Fe3O4. The reaction temperature and pressure was fixed to 773 K and 0.5 MPa. Cross sectioned specimens were prepared for TEM using the following procedure. At first, the specimen was buried in a conductive resin block. Then it was cut across the interface, followed by grinding and final focused ion beam thinning down to electron transparency. The interface area between the formed Fe3C phase and the Fe3O4 matrix was observed and analyzed by TEM.
The typical weight changes of Fe3O4 powder with time at 1023 K during carburization reaction by the gas mixture of 90%CO–10%CO2 with the total pressures of 0.1, 0.5 and 1.0 MPa are shown in Fig. 3 and these experimental conditions are shown as the points of a, b and c, respectively in Fig. 1. The pO2 with this gas mixture was calculated to be 1.78×10⁻²¹ atm. The corresponding carbon activities with each pressure are 3.1, 17.5 and 35.0. These values are calculated based on the following equations;23)
| (4) |
| (5) |
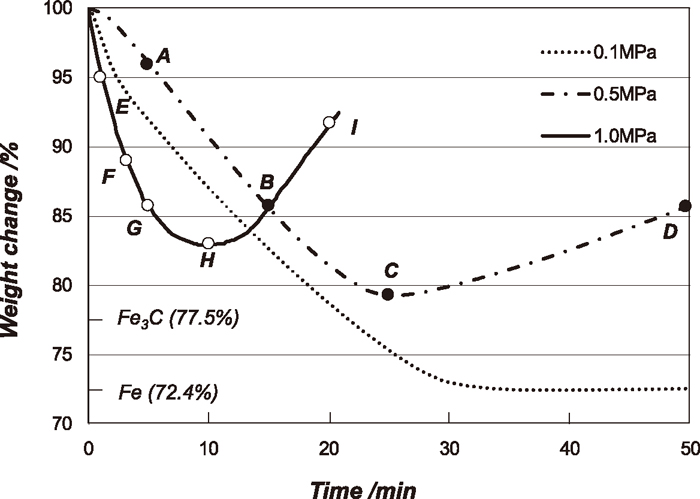
Carburizing curves of Fe3O4 powder at 1023 K by using carburizing gas (90%CO–10%CO2) with different pressures of 0.1, 0.5 and 1.0 MPa. The points A to I indicate the sampling position for X-ray analysis.
In these reacting gas compositions, the expected final stable phase is Fe3C for all experiments. The experiments were carried out several times with the same experimental condition, and almost the same kinetic behaviours were confirmed. For the carburization experiments with the pressure of 0.1 MPa, Fe3O4 powder is fully reduced to metallic iron and Fe3C was unlikely to be formed. After 2.4 ks, the very small weight gain with time was observed. It could be due to the carbon deposition. For the experiments with the pressure of 0.5 and 1.0 MPa, the weights also decreased with time, and then it started to increase before it reached to the full conversion to metallic Fe. The onset of the weight increase was corresponded to the starting of the carbon deposition reaction, and confirmed by X-ray analysis.
To identify the developed phases during the carburization reaction with the total pressure of 0.5 and 1.0 MPa, X-ray diffraction analysis for the reacted samples at the points A to I evaluated by applying Rietveld method shown in Fig. 3 was carried out. The amounts of the identified phases at the points A to I are shown in Table 2 and also shown as a function of time in Figs. 4(a) and 4(b).
| 0.5 MPa | Fe3C | Fe | C | FeO | Fe3O4 |
|---|---|---|---|---|---|
| A (5 min) | 0.0 | 5.9 | 0.0 | 94.1 | 0.0 |
| B (15 min) | 0.0 | 74.1 | 0.0 | 25.9 | 0.0 |
| C (25 min) | 76.4 | 16.4 | 0.0 | 7.2 | 0.0 |
| D (50 min) | 20.2 | 30.1 | 49.7 | 0 | 0.0 |
| 1.0 MPa | Fe3C | Fe | C | FeO | Fe3O4 |
|---|---|---|---|---|---|
| E (1 min) | 13.7 | 9.3 | 0.0 | 74.3 | 2.7 |
| F (3 min) | 45.2 | 9.2 | 0.0 | 44.1 | 1.5 |
| G (5 min) | 73.4 | 11.5 | 0.0 | 15.1 | 0.0 |
| H (10 min) | 24.4 | 26.4 | 49.2 | 0 | 0.0 |
| I (20 min) | 26.7 | 16.2 | 57.1 | 0 | 0.0 |
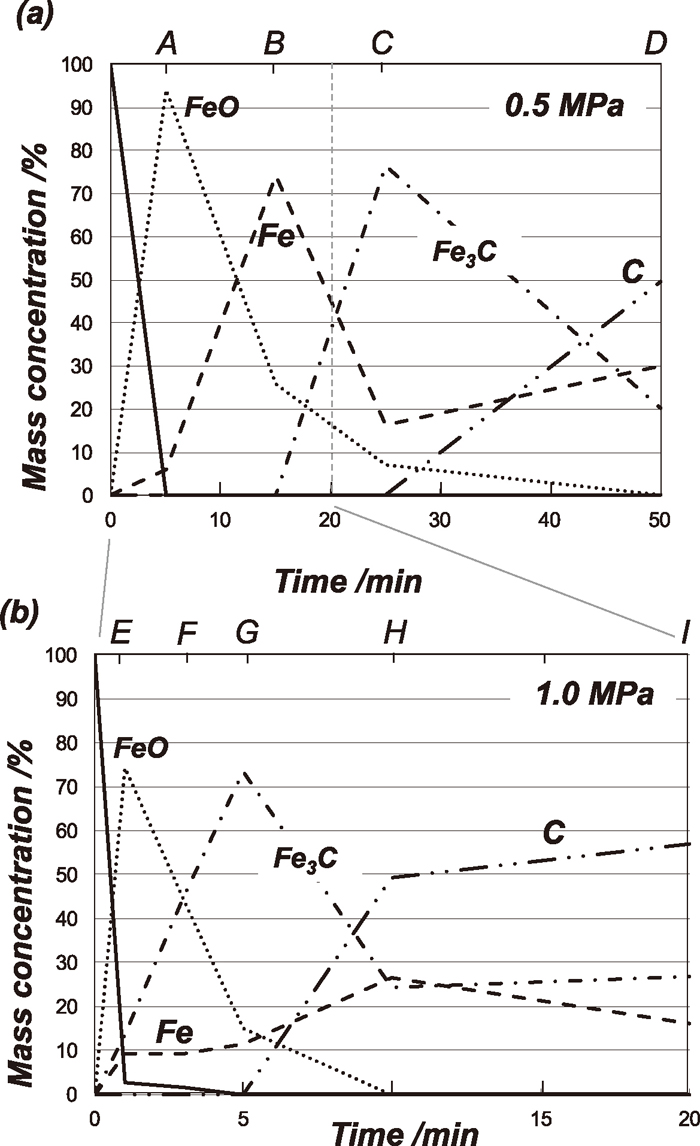
Phase composition changes during carburization of Fe3O4 powder at 1073 K based on XRD quantitative analysis with the total pressure of (a) 0.5 MPa and (b) 1.0 MPa.
For the experiment with the total pressure of 0.5 MPa, the Fe3C formation started between the points B (15 min) and C (25 min) based on the results shown in Fig. 4(a). At the point D (50 min), the amount of Fe3C was decreased and that of metallic Fe was increased compared with those at point C, and large amount of carbon was also found at the point D (50 min). The small increase of the amount of Fe and increase of carbon can be attributed to the Fe3C decomposition triggered by the carbon deposition.
| (6) |
Under the pressure of 1.0 MPa, Fe3C formation started earlier than that with 0.5 MPa and a small amount of Fe3C (about 13.7 mass%) was already produced after 1 min (point E). Differed from the case of 0.5 MPa, the increase of the Fe3C amount is approximately equal to the decay of the FeO (wüstite) amount but not the decay of the Fe amount. The carbon deposition started much earlier time (after 5 min) than that with 0.5 MPa (25 min). From the point G (5 min), the amount of Fe3C started to decrease while the amount of the metallic iron was slightly increased than those at the point F (3 min). This can be also due to the Fe3C decomposition since the carbon deposition was detected.
At the point of E, Fe3C as well as Fe are already formed. It was found that the Fe3C amount increased from the point E to G with decrease of wüstite and the small amount of Fe was almost constant. Namely, the reaction mechanisms with the total pressure of 0.5 MPa and 1.0 MPa seems to be different. The reasons of this apparent difference of the Fe3C formation reactions will be discussed in the section 4.1.
3.2. Fe3C Formation from Fe3O4 Single Crystal at 773 K under High PressureAs shown in Fig. 4, Fe is produced during the Fe3C formation process. This result does not deny the possibility of the direct Fe3C formation. The direct conversion from iron oxides may simultaneously occur along with the Fe3C formation by the carburization of the reduced Fe. The simple way to confirm the direct formation of Fe3C is to observe whether metallic iron is existed or not between Fe3O4 matrix and produced Fe3C by using TEM. It was found that the preparation of the suitable sample for TEM observation with fine Fe3O4 powder was quite difficult. Thus, for the observation of the interface between Fe3O4 and Fe3C by TEM, a single Fe3O4 crystal instead of Fe3O4 powder was used. To make the carburization reaction simple, the experimental temperature was set to 773 K to avoid the wüstite formation since wüstite cannot exit as a stable phase at less than 843 K, and the total pressure was fixed to 0.5 MPa.
In the single crystal experiment, several different carburizing gas mixtures were used. In Fig. 5, the corresponding pO2 and aC are shown as open circles indicated d and e in the Fe–C–O phase stability diagram at 773 K. In the hatched area shown in Fig. 5, Fe3C is thermodynamically stable but not metallic iron. The experimental condition at d was fixed with the gas mixture of 40%CO–60%CO2. The corresponding pO2 and aC (relative to graphite) are 1.81×10⁻²⁹ atm and 354, respectively. The condition at e was with the gas mixture of 70%CO–30%CO2. The pO2 and aC are 1.47×10⁻³⁰ atm and 2138, respectively. The points d and e are existed in the Fe3C stable region. The equilibrium pO2 between Fe and Fe3O4 at 773 K is about 9.47×10⁻³⁰ atm. Since the pO2 at the point d is larger than the equilibrium pO2, metallic Fe cannot be thermodynamically existed at the point d. Thus, if the Fe3C was formed at the point d, it is the clear evidence that Fe3C can be formed directly from Fe3O4 but not through the cementation of metallic Fe.
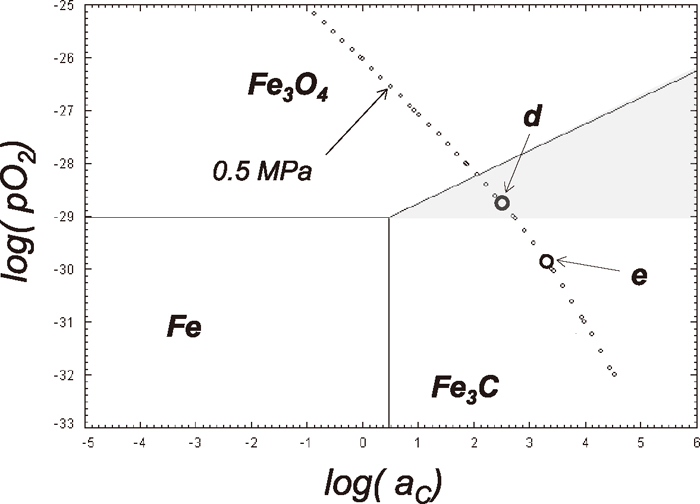
Fe–C–O phase stability diagram at 773 K with the relation between pO2 and aC under the total pressure of 0.5 MPa. The points e and d are the carburizing conditions of Fe3O4 single crystals and powder samples. The unit of pO2 in the figure is with atm.
The weight changes under the experimental conditions of d and e with time are shown in Fig. 6. At the condition d, no weight change was observed for about 3 min and then the weight of sample started to increase due to carbon deposition. This result simply suggests that the direct Fe3C did not occur under this experimental condition. In the carburization experiments under the condition e, the weight gradually decreased up to 40 min, and then it started to increase gradually due to the carbon deposition. To confirm that these kinetic behaviours are not due to the specificity of Fe3O4 single crystal, the carburization reaction of the Fe3O4 powder (0.5 mg) used at 1023 K experiments under the same conditions of d and e was carried out and the results are shown in Fig. 7. As with the case of the single crystal Fe3O4, the weight changes were not observed under at the point d. Under the condition of e, the weight change was observed. The amount of the weight change of powder sample was much larger than that of the single crystal. This is simply due to the difference of the surface area and surface structure between the powder and single crystal samples.
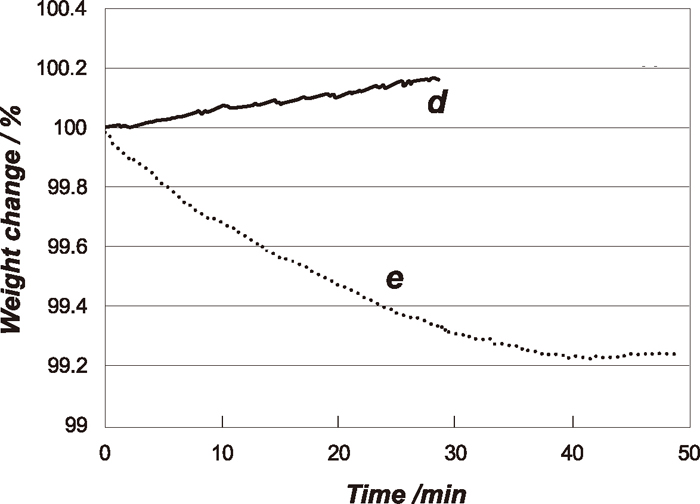
Carburizing curves of Fe3O4 single crystals under the experimental conditions of d and e with total pressure of 0.5 MPa at 773 K.
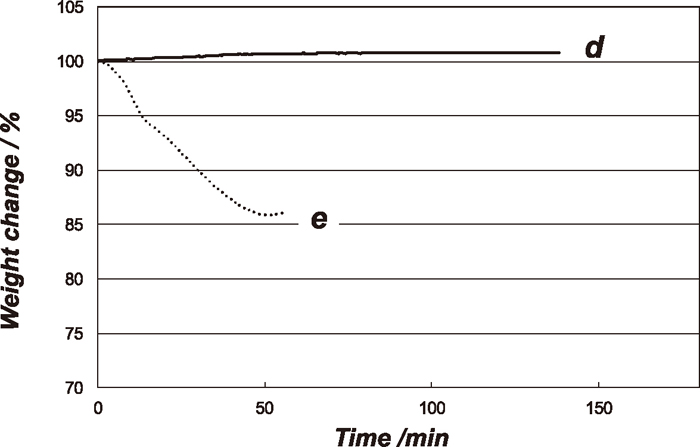
Carburizing curves of Fe3O4 powders with under the experimental conditions of d and e with total pressure of 0.5 MPa at 773 K.
The TEM observation was carried out for the single crystal samples reacted under the condition e. Figure 8 shows the low-magnification annular dark field-scanning TEM (ADF-STEM) of the sample after 60 minutes reaction. It shows two different phases. The dark grey coloured area is found to be Fe3O4 and bright grey area was Fe3C from the electron diffraction patterns. Fe3O4 matrix was fully covered with Fe3C layer, and the distinct Fe phase was not observed at the interface region. The formed Fe3C seemed to directly contact with Fe3O4 under this magnification. Figure 9 shows the high-magnification TEM image of the same specimen. The interface is located in the narrow dark band. From the on-site TEM observation, the lattice fringes of Fe3C and Fe3O4 phases were found to meet at the interface and both of the lattices were incoherently connected. The detectable Fe layer was not found between the Fe3O4 matrix and the formed Fe3C under this experimental condition.
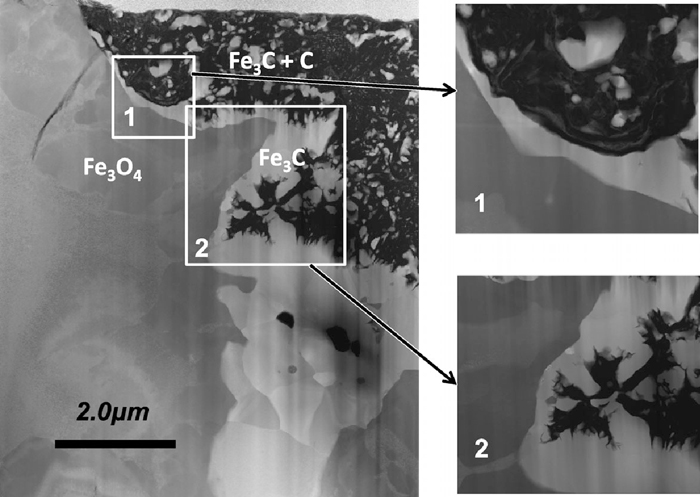
TEM image of a carburized Fe3O4 single crystal sample after 50 minutes reaction. The Fe3C phase is directly connected to Fe3O4 matrix.
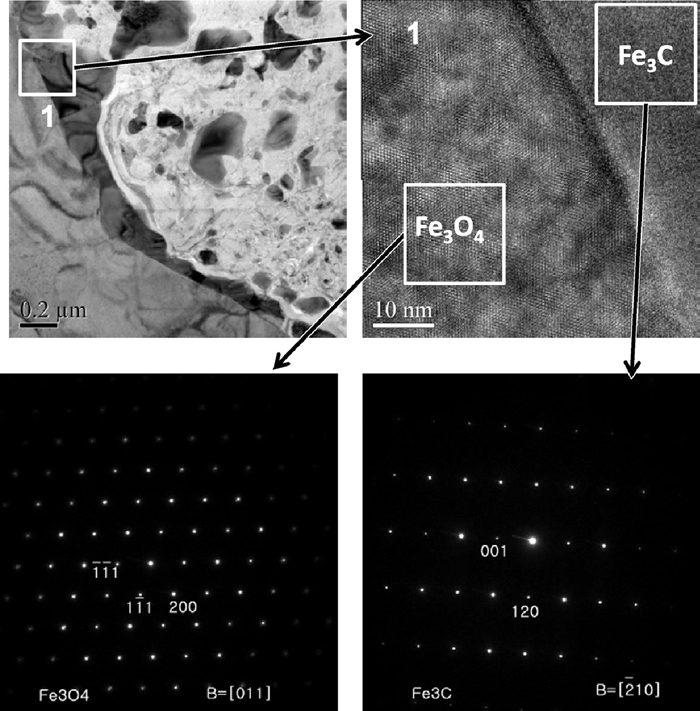
The high magnification TEM of the same sample shown in Fig. 8. The inset diffraction pattern shows spots corresponding to Fe3O4 and Fe3C phases.
As already shown in Fig. 4, the Fe3C formation mechanism at 1023 K seemed to change with the total pressure. The differences in these experimental conditions were aC and pCO (pO2 are the same). Thus, the change of aC or pCO possibly makes the reaction mechanism different. Before carbon deposition starts, the carburization reaction with the total pressure of 0.5 MPa possibly involves the following reactions base on the results shown in Fig. 4:
| (7) |
| (8) |
| (9) |
| (10) |
| (11) |
Since the reaction (7) and Fe3C decomposition reaction (6) after carbon deposition could have negligibly small influence on the overall Fe3C formation reaction, the analysis of Fe3C formation reaction was carried out by focussing on the conversion of ‘FeO’ to Fe3C via intermediate Fe. Fe3C formation was expressed by the consecutive reactions involving two stages:
| (11) |
In these consecutive reactions involving two stages, the reduced Fe content is determined by the relative values of k2 and k2. In the case of k1 > k2, Fe3C formation rate is supposed to be much smaller than “FeO” reduction rate. Thus, we may get substantial conversion of ‘FeO’ into Fe before much Fe3C is formed, but the rate of the accumulation of Fe3C is slow enough to allow an initial accumulation of Fe before it is converted to Fe3C. In the case of k2 > k1, Fe3C formation rate is much larger than “FeO” reduction rate. Namely, the reduced Fe is supposed to be very reactive intermediate. Once the intermediate Fe is formed, it rapidly converts to Fe3C. The concentration of the intermediate Fe does not have sufficient time to build up. Consequently, the reduced Fe concentration remains small throughout the reaction.
Thus, the apparently quite different behaviours of the concentration changes of “FeO”, Fe and Fe3C shown in Figs. 4(a) and 4(b) can be qualitatively explained based on the relative values of k1 and k2. The reactions with the total pressure of 0.5 MPa can be the case of k1 > k2, and the reaction with 1.0 MPa is corresponded to the case of k1 < k2. Namely, the reaction mechanism of the Fe3C formation reactions with 0.5 and 1.0 MPa are essentially the same and the apparently different behaviours is possibly attributed to the relative values of k1 and k2. It suggests that the Fe3C formation rates were more enhanced with increase of the total pressure than that of the wüstite reduction rates. The reason of the effective enhancement of Fe3C formation by the total pressure is not clear. In these experiments, the pO2 did not change by the total pressure, but the aC was changed from 3.1 to 35.5. Thus, the aC may possibly cause the apparently different reaction behaviours with 0.1, 0.5 and 1.0 MPa. Further works are certainly necessary to undersatand the effect of the aC on the Fe3C formation and ‘FeO’ reduction reactions.
4.2. Effect of pO2 on Fe3C FormationAs already mentioned, Fe3C was formed at the condition e, but not at d. At the experimental condition of d, the carbon activity of 354 is large enough to form Fe3C, but the oxygen partial pressure of 1.81 × 10⁻²⁹ atm is not low enough to form metallic iron. This result suggests that not only the carbon activity of more than unity but also the low oxygen potential enough to maintain the metallic Fe phase might be required for the Fe3C formation, although the metallic Fe was not observed by TEM.
As discussed in the section 4.1, the reaction mechanism of Fe3C formation at 1023 K was reasonably explained by the consecutive reactions involving the intermediate metallic Fe. There are no particular reasons that the same mechanism cannot be applied for the Fe3C formation of the single crystal Fe3O4. If so, metallic Fe must be existed although its content might be very small. TEM observation, however, showed that the detectable Fe layer was not found.
This inconsistency can be explained by considering the relative reaction rates of Fe3C formation from Fe and that of Fe formation from Fe3O4. In the case of Fe3C formation by the Fe carburization, the supersaturation of carbon in Fe matrix is required. The solubility of carbon in iron oxides such as ‘FeO’ and Fe3O4 has been measured by Wolf et al.24) to be less than 0.01 ppm even at 1273 K. This significantly low solubility will prevent any bulk diffusion of carbon in Fe3O4 or no carbon saturation in Fe3O4 matrix. Thus, the nucleation of Fe3C phase in the Fe3O4 matrix below the surface is hardly occurred. If so, Fe3O4 will be initially reduced to Fe and the produced Fe layer thickness gradually increases by the introduction of reducing gas. Carbon atoms can easily diffuse through the densely formed Fe layer but not for oxygen atoms or CO molecules. Thus, after some time, the increase of Fe layer thickness will be very slow down or even halted since CO molecules produced by Fe3O4 reduction cannot be removed though the densely formed Fe layer. Along with Fe formation, the absorbed carbon at the surface diffuses into the Fe layer and Fe3C will be formed in the Fe layer. Carbon atoms consecutively diffuse into the Fe layer through the formed Fe3C layer, and the Fe layer under the Fe3C layer will be converted into Fe3C. The produced Fe will be finally all consumed because the Fe layer thickness will not be changed after some time due to the previously mentioned reason. Then, the surface concentration of absorbed carbon gradually increases since carbon atoms are not consumed anymore and carbon deposition reaction will start at the surface. The proposed reaction mechanism is schematically illustrated in Fig. 10. If this mechanism is adapted, the reason that detectable Fe layer was not observed by TEM can be understood. Namely, the initially produced Fe in the observed Fe3O4 single crystal sample could be all consumed before the carbon deposition started. This mechanism can also explain the reason that the pO2 low enough for the Fe formation is required for the Fe3C formation. Namely, the existence of intermediate metallic Fe will be essential for Fe3C formation from iron oxides from the kinetics viewpoint.
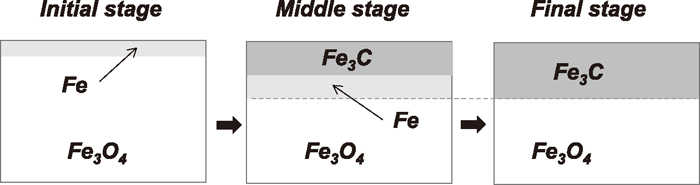
Schematics of the mechanism of Fe3C formation in a Fe3O4 single crystal. The interface position between Fe and Fe3O4 do not move so much after a particular time.
This result does not reject the thermodynamically possible direct Fe3C formation. Compared with the Fe3C formation and carbon deposition at the Fe3O4 surface, the carbon deposition can be much easier. Then, the carbon deposition may occur before the Fe3C formation proceeds at the Fe3O4 surface with increase of absorbed carbon concentration. If carbon deposition is suppressed, Fe3C formation may possibly occur even in the hatched area shown in Fig. 5. For more precise understanding of the direct formation mechanism of Fe3C from iron oxides, further investigations will be needed.
The kinetics of carburization reaction of Fe3O4 powder (0.3 g) and single crystals were carried out to investigate the reaction mechanism of the Fe3C formation from iron oxides with varying the total pressure from 0.1 to 1.0 MPa. Along with the kinetics study, the interface between the formed Fe3C and the Fe3O4 single crystal matrix was observed by TEM to investigate the metallic Fe and Fe3C phase developments during carburization reaction. Based on these studies, the following conclusions are obtained:
(1) The Fe3C formation reaction from Fe3O4 powder at 1023 K is found to be carried out by the sequential reactions of the conversion of Fe3O4 to Fe3C via intermediate metallic Fe.
(2) The carburization of the single crystal magnetite was carried out at 773 K under the pressure of the 0.5 MPa. The formed interface was examined by using TEM. It was found that the formed Fe3C was directly contacted with Fe3O4, and metallic Fe was not observed at the interface region.
(3) In the carburization of Fe3O4 single crystal sample, the produced Fe is continuously converted into Fe3C. However, the amount of the initially produced Fe is limited so that all of the produced Fe can be consumed after a particular time. This can be the possible reason that Fe layer was not found in TEM observation.
(4) The experimental conditions that satisfy the thermodynamically possible Fe3C formation are not sufficient for the actual Fe3C formation. Namely, not only the carbon activity of more than unity but also the low oxygen potential enough for metallic Fe existence might be required for the Fe3C formation form the kinetics viewpoint.