Regular Article
Thermodynamics of AlN Formation in High Manganese-Aluminum Alloyed Liquid Steels
2013 Volume 53 Issue 6 Pages 973-978
Details
2013 Volume 53 Issue 6 Pages 973-978
The AlN solubility product in liquid iron containing manganese up to 22 mass% were measured by the metal-nitride-gas equilibration technique in the temperature range from 1823 to 1873 K. Manganese significantly increased the AlN solubility product in liquid iron primarily due to the large effect of manganese on the nitrogen solubility. Using the Wagner’s formalism, the experimental results were thermodynamically analyzed to determine the thermodynamic interaction parameters between manganese and aluminum in high Mn–Al alloyed liquid steels as follows;
 |
Recently, a series of new advanced high strength steels (AHSS) have been developed for the future automotive industry. They provide an excellent combination of high strength, high ductility and high formability over conventional steels. Among these steel grades, high manganese (up to over 20 mass%) and high aluminum (up to 2 mass%) containing twining induced plasticity (TWIP) steels received much attention because of their superiority of mechanical properties.1,2,3)
While much study has been carried out on the material properties in theses steel grades, the influence of non-metallic inclusions on the properties of those steels has been noted recently. Gigacher et al.4) and Park et al.5) characterized the inclusions formed in solidified high Mn–Al alloyed steels (10–25 mass%Mn, 1–6 mass%Al). They classified the main endogenous inclusion types observed in solidified steel samples as AlN, Al2O3 and MnO·Al2O3 inclusions with MnS edge. Yin characterized the inclusions formed in as-cast high-Al TRIP steel slabs containing 1.2 mass%Al and 33 mass ppmN by the remelt button technique.6) He observed large crystalline AlN inclusions up to 10 μm as dominating inclusions in solidified steel samples. AlN is considered as a detrimental phase for the hot ductility of the steels.7)
These studies provided useful information on the characterization of inclusions in high Mn–Al alloyed steels. However, the specific effects of those alloying elements at high concentration on the formation of AlN inclusions are still unknown. In order to control the formation of AlN inclusions based on the supersaturation of those alloying elements during cooling and casting of liquid steels, it is essential to have accurate thermodynamic data of those elements in liquid steels as a function of melt temperature. In the authors’ recent studies,8,9) the thermodynamics of Fe–Al–N and Fe–Al–N–AlN systems was studied using the metal-gas-nitride equilibration technique in the temperature range from 1823 to 1973 K. The effect of manganese on the nitrogen solubility in Fe–Mn–N and Fe–Mn–Al–N melts was also studied.10)
In the present study, the effect of manganese on the AlN formation in high Mn–Al alloyed liquid steels were determined over wide ranges of manganese content and temperature. Using the Wagner’s formalism,11) the thermodynamic interactions between manganese and aluminum were determined from the experimental results. The interaction parameters determined in the present study were used to construct the AlN stability diagram for a typical TWIP steel (Fe-20 mass%Mn-1.5 mass%Al–N) as a function of melt temperature. In order to check the validity of the AlN stability diagram, an experiment was carried out to observe under what condition AlN forms on cooling at controlled aluminum and nitrogen contents in the melt.
The metal-nitride-gas equilibration experiments were carried out to determine the AlN solubility product in Fe–Mn–Al–N melts. Detailed descriptions of the experimental apparatus and procedure are available in the authors’ recent studies on Fe–Al–N and Fe–Al–Si–N systems.8,12)
Five hundred grams of high purity electrolytic iron contained in an Al2O3 crucible (outer diameter (OD): 56 mm, inner diameter (ID): 50 mm, height (H): 96 mm) was melted in the temperature range from 1823 to 1873 K by a 15 kW/30 kHz high frequency induction furnace. After melting the iron, the melt temperature was directly measured by a Pt/Pt-13 mass%Rh thermocouple sheathed with an 8 mm OD alumina tube immersed in the melt, and the temperature was accurately controlled within 2 K during each experiment by a proportional-integral-derivative (PID) controller of the induction furnace.
After the melt temperature was reached at a desired value, Ar-10%H2 gas was blown onto the melt surface at a high flow rate of ~5000 ml/min for 2 hours to deoxidize the iron melt. The oxygen content in the melt decreased to a value less than 20 mass ppm. Then, the gas was switched to a mixture of Ar-10%H2 and N2 gases to have nitrogen partial pressures from 0.2 to 0.8 atm. The flow rate of the gas mixture was controlled by a mass flow controller in the range of 1000–2000 ml/min depending on nitrogen partial pressures in the gas. Strong agitation of the melt by an induction furnace resulted in a fast attainment of equilibrium nitrogen solubility in liquid iron under a nitrogen partial pressure within 1 hour.
In case of the metal-nitride-gas equilibration experiments, aluminum (99.9% purity) addition and sampling were repeated until a stable AlN layer was formed on the surface of the iron melt. The formation of AlN in the iron melt could be confirmed by a sharp decrease in nitrogen content checked by the analysis of metal samples during the experiment. After the saturation of AlN in liquid iron, manganese pellets (99.99% purity) were added. After each manganese addition in liquid iron, the new equilibrium AlN solubility was attained within 2 hours. It was confirmed by sampling and insitu analysis for nitrogen at 30 minutes intervals. Manganese addition was repeated up to 22 mass%Mn in liquid iron.
2.2. Chemical AnalysisThe metal sample was extracted by a 6 mm OD quartz tube, and it was quenched rapidly in water within 2 seconds. The metal samples were carefully cut for the chemical analysis. Four specimens of each metal sample were prepared for the analysis of nitrogen and oxygen. The nitrogen and oxygen contents in the metal sample were measured by the inert gas fusion-infrared absorptiometry technique (LECO TC-600 apparatus; LECO Corporation, St. Joseph, MI) with an accuracy of ±2 mass ppm. For the analysis of manganese and aluminum, the metal sample (0.2 g) was dissolved in 20 mL of HCl (1 + 1) in a glass beaker of 50 mL capacity heated in a water bath for 2 hours and analyzed by the inductively coupled plasma atomic emission spectroscopy (ICP-AES, SPECTRO ARCOS apparatus, manufactured by Spectro Analytical Instruments, Kleve, Germany) using appropriate standard solutions containing the same amount of Fe (2000 mass ppm) as the sample solutions. The analytical limit for manganese and aluminum in the metal sample was 5 ± 1 mass ppm.
After each experiment, the melt remained in an Al2O3 crucible was quenched by blowing helium gas onto the melt surface. In order to check the presence of inclusions including AlN in the quenched melts, about 10 g of metal sampled near the upper surface of the melt was dissolved in dilute HCl (1 + 1) solution heated in a water bath for 72 hours. After the complete dissolution of metallic portion, the residue was filtrated and analyzed by the X-ray diffraction analysis (XRD, High power X-ray Diffractometer System, Rigaku D/MAX-2500/PC).
The nitride formed in the melt during the metal-nitride-gas equilibration experiments were identified as a pure solid AlN. The XRD data on the filtrated residue from the dissolved metal samples was compared with the XRD pattern of the stoichiometric AlN powder (99% purity, <10 μm, Aldrich Chemical Co.) in Fig. 1. By comparing 2θ values of the diffraction peaks, the aluminum nitride formed in Fe–Mn–Al–N melt in the present study can be considered as a pure solid stoichiometric AlN.
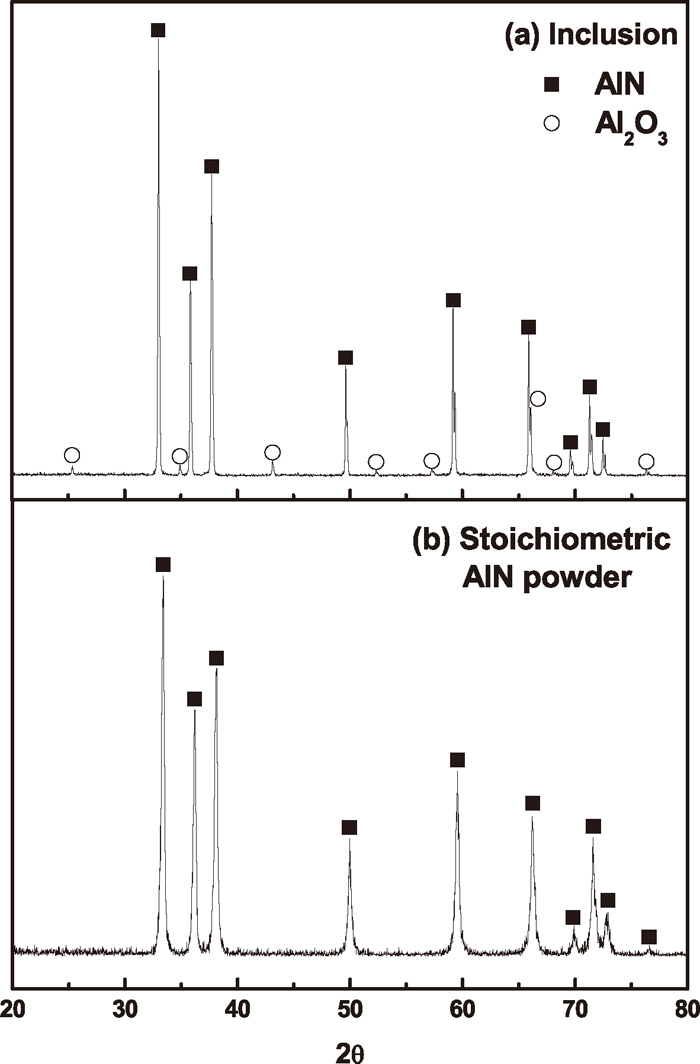
XRD patterns for (a) inclusions and (b) stoichiometric AlN powder.
The reaction equilibrium for the dissolution of pure solid AlN in liquid iron can be written as
| (1) |
| 9) (2) |
| (3) |
The experimental results of AlN solubility measurement with manganese additions in liquid iron are summarized in Table 1. Figure 2 shows the variation of equilibrium nitrogen solubility in Fe–Al–N melts with aluminum additions under a nitrogen partial pressure of 0.5 and 0.8 atm at 1873 K. The nitrogen solubility decreases slightly as the aluminum content increases in liquid iron when the melt is not saturated with AlN as shown using open symbols in the figure. When the aluminum content exceeds the critical value, the nitrogen solubility decreases due to the formation of AlN in the melt as shown using solid symbols in the figure. The solid line in Fig. 2 is the equilibrium solubility product of aluminum and nitrogen for the AlN formation in liquid iron at 1873 K determined in the authors’ previous study on the AlN formation in Fe–Al–N melts.9)
| Temp. (K) | PN2 (atm) | [%Mn] | [%Al] | [%N] |
|---|---|---|---|---|
| 1823 | 0.5 | 0 | 1.05 | 0.0174 |
| 0 | 1.51 | 0.0115 | ||
| 0.48 | 1.50 | 0.0125 | ||
| 1.12 | 1.47 | 0.0134 | ||
| 2.46 | 1.40 | 0.0151 | ||
| 7.11 | 1.28 | 0.0213 | ||
| 10.99 | 1.05 | 0.0326 | ||
| 14.65 | 0.84 | 0.0483 | ||
| 19.39 | 0.65 | 0.0763 | ||
| 0.3 | 21.30 | 0.86 | 0.0635 | |
| 21.28 | 1.06 | 0.0510 | ||
| 0.2 | 19.30 | 1.50 | 0.0340 | |
| 20.05 | 1.08 | 0.0511 | ||
| 21.05 | 1.05 | 0.0516 | ||
| 1848 | 0.5 | 0 | 1.03 | 0.0237 |
| 0 | 1.55 | 0.0150 | ||
| 0.94 | 1.49 | 0.0165 | ||
| 2.04 | 1.44 | 0.0186 | ||
| 6.13 | 1.42 | 0.0227 | ||
| 9.40 | 1.17 | 0.0340 | ||
| 13.35 | 0.81 | 0.0596 | ||
| 15.90 | 0.66 | 0.0836 | ||
| 1873 | 0.8 | 0 | 1.14 | 0.0274 |
| 0 | 1.77 | 0.0163 | ||
| 1.04 | 1.76 | 0.0181 | ||
| 5.19 | 1.44 | 0.0285 | ||
| 8.90 | 1.03 | 0.0504 | ||
| 12.92 | 0.69 | 0.0890 | ||
| 0.5 | 0 | 1.59 | 0.0190 | |
| 0.93 | 1.53 | 0.0203 | ||
| 5.92 | 1.24 | 0.0339 | ||
| 9.36 | 1.00 | 0.0511 | ||
| 12.30 | 0.99 | 0.0600 |

Equilibrium relation between [%Al] and [%N] in Fe–Al–N melts at 1873 K.
Figure 3 shows the effect of manganese additions on the solubility of aluminum and nitrogen for AlN saturation in liquid iron under nitrogen partial pressure of 0.5 atm at 1823 K. As the manganese content increases, the nitrogen solubility significantly increases while the aluminum content decreases. Figure 4 shows the effect of manganese content on the AlN solubility product, log [%Al][%N], at 1823, 1848, and 1873 K. The AlN solubility product in Fe–Mn alloys increases linearly with manganese content primarily due to the large effect of manganese on the nitrogen solubility.

Effect of Mn additions on [%Al] and [%N] for AlN saturation in Fe–Mn–Al–N melt at 1823 K.

Effect of Mn additions on AlN solubility product in Fe–Mn–Al–N melt at different melt temperatures.
In order to determine the thermodynamic relation between manganese and aluminum from the AlN solubility product data in Fe–Mn–Al–N melts, the equilibrium constant, KAlN can be written as the following relation using the interaction parameters:
| (4) |
| i | 1873 K | Temp. range (K) | Comp. range | Ref. | |
|---|---|---|---|---|---|
|
| Al | 0.017 | 1823–1973 | [%Al] ≤ 2.5 | 9 |
| Mn | –0.0233 | 1773–1873 | [%Mn] ≤ 26 | 10 | |
|
| Al | 0 | 1823–1973 | [%Al] ≤ 2.5 | 9 |
| Mn | 0 | 1773–1873 | [%Mn] ≤ 26 | 10 | |
|
| Al | 0.043 | 1823–1973 | [%Al] ≤ 4.5 | 9 |
|
| Al | 0 | 1823–1973 | [%Al] ≤ 4.5 | 9 |
| log KAlN | – | –1.434 | 1823–1973 | – | 9 |
| (–18580/T + 7.03) |
Therefore, the specific effect of manganese on aluminum at their high concentration can be determined from the AlN solubility product data as a function of manganese content in Fe–Mn–Al–N melts. Eq. (4) can be rearranged as
| (5) |
Figure 5 shows the values of log

Relation of log
The Japanese Society for the Promotion of Science (JSPS)13) recommends the
| Values | Temp. range(K) | Comp. range | Ref. | |
|---|---|---|---|---|
|
| 0 | 1823–1873 | [%Mn] ≤ 22 | Present study |
| [%Al] ≤ 1.8 | ||||
| –0.004 | 1873 | [%Mn] ≤ 0.7 | 14 | |
| [%Al] ≤ 0.05 | ||||
|
| 0 | 1823–1873 | [%Mn] ≤ 22 | Present study |
| [%Al] ≤ 1.8 |
Rearranging Eq. (5), the following relation can be obtained to construct the AlN solubility diagram for high Mn–Al steel melts as a function of melt composition and temperature.
| (6) |
Therefore, using the thermodynamic parameters determined by the authors’ studies shown in Table 2, one can calculate the contour lines of critical aluminum and nitrogen contents for the onset of AlN inclusion formation in a Fe-20 mass%Mn steel melt at different temperatures as shown in Fig. 6. For an example, when the aluminum content is 1.5 mass% in this alloy, the critical nitrogen contents for the AlN formation are 343, 197, and 107 ppm at 1823, 1773, and 1723 K, respectively.

AlN solubility diagram in Fe-20 mass%Mn–Al–N melts.
In order to check the validity of AlN stability diagram for this alloy, a separate experiment was carried out using the induction furnace by equilibrating an Fe-20 mass%Mn-1.5 mass%Al alloy melt under an Ar–N2 gas at 1823 K. The nitrogen partial pressure in the reaction chamber was controlled to keep the nitrogen content of 120 mass ppm in the melt at 1823 K (shown as symbol ‘A’ in Fig. 6). After the metal-gas equilibration, the metal sample was extracted by a 6 mm OD quartz tube and quenched rapidly in the ice water within 2 seconds. The melt temperature was then lowered to 1773 and 1723 K successively. The metal samples were extracted at each temperature by the same method.
The metal samples were analyzed for the inclusions by the SEM-EDS as shown in Fig. 7. The inclusions observed in the metal samples taken at 1823 and 1773 K were identified as MnO·Al2O3 phase. There was no AlN inclusions observed in these samples as predicted in Fig. 6. At 1723 K, however, AlN inclusions of ~2 μm in size were observed in the metal sample as shown in Fig. 7(c). This result indicates that thermodynamic parameters determined in the present study are valid for the prediction of AlN formation in high Mn–Al alloyed steel melts as a function of melt temperature.

SEM image of inclusion formed at (a)1823, (b)1773, (c)1723 K, and (d) room temperature.
After the solidification of the melt and cooling to room temperature, AlN inclusions of larger size were observed as shown in Fig. 7(d). As the solidification proceeds, the driving force of AlN formation becomes much greater due to the enrichment of [%Al] and [%N] in remaining liquid steel. During the solidification process of high Mn–Al alloyed steel, the enrichment of manganese, aluminum and nitrogen in remaining liquid steel should be also considered.15)
For nitrogen in the melt, Eq. (7) is used.
| (7) |
For aluminum and manganese in the melt, Eqs. (8) and (9) are used.
| (8) |
| (9) |
Therefore, one can estimate the change in the real value of hAlhN (= fAlfN[%Al][%N]) in Eq. (3) as the driving force of AlN formation during solidification. As shown in Fig. 8, the formation of secondary AlN inclusions can be started during solidification (gs = 0.8) even at low nitrogen content of 30 ppm in Fe-20 mass%Mn-1.5 mass%Al melt. Therefore, the nitrogen content in this high Mn–Al alloyed steel melt should be kept as low as possible to avoid the excessive formation of AlN inclusions.

AlN formation during solidification in Fe-20 mass%Mn-1.5 mass%Al–N melt.
Using the metal-nitride-gas equilibration technique, thermodynamic relations between manganese and aluminum in liquid iron were determined in high Mn–Al alloyed melts at 1823–1873 K. The main findings of this study can be summarized as follow.
(1) From the AlN solubility measurement in Fe–Mn–Al–N melts, the first- and second-order interaction parameters between manganese and aluminum were determined as
(2) Thermodynamic calculations using the parameters determined in the present study were in excellent agreement with the experimental results of observing the formation of AlN inclusions in Fe-20 mass%Mn-1.5 mass%Al–N alloy melt.
This work was supported by the research fund of Hanyang University (HY-2011-G).