Abstract
To examine the applicability of hematite ore to the ironmaking by microwave heating, the carbothermic reduction of hematite powders by microwave heating were elucidated using the gas analysis of exhausted gas, and were compared with that of magnetite powders. The temperature of the hematite – graphite mixed powders moderately increases at the beginning, and then, starts to increase abruptly at around 400°C owing to the thermal runaway of Fe2O3. Once the reduction reaction starts to take place, the reduction reaction rate of hematite is even faster than that of magnetite, which is the same behavior as that observed by conventional heating. Hematite ore could be a possible raw material for microwave ironmaking: When hematite ore is utilized, the ore should be preheated up to around 400°C prior to the feeding to a microwave furnace.
1. Introduction
Currently, iron and steel making industries encounter some problems such as quality decrement of raw materials, CO2 gas emission, and so on. In particular, the decline in iron ore quality is a serious problem; low-grade ore is the ore with less iron concentration and poorer sintering performance. In order to increase the iron concentration of low-grade ore, lump ore is crushed to separate particles containing higher iron concentration from particles mainly composed of gangue minerals. As a result, the quality decrement leads to pulverization of iron ore. Since a mixture of powdery iron ore and carbonaceous material is utilized for direct-reduced iron (DRI) processes such as FASTMET, ITmk3 and Hi-QIP, these processes may be promising. In fact, powdery raw materials enable us to attain energy conservation owing to the rapid reduction reaction rates; the CO gas diffusion from the surface is more promoted for iron ores with smaller particle size. For such processes utilizing powdery raw materials, heat is normally supplied by radiation, where the conductive heat flow from the surface to the interior of materials is the rate controlling step, resulting in the limitation of productivity.
In order to overcome this problem, the authors’ group has focused on the microwave heating as a new heating source for ironmaking.1,2,3,4) Microwaves are electromagnetic waves and are suitable for heating powders because of the possibility of the volumetric heating. It is known that microwave deeply goes into powdery materials and heats the inside of the materials directly. So far, the authors’ group has used magnetite ore as a raw material to carry out the basic research with respect to the process development of microwave ironmaking1,2,3,4) because magnetite is known to be an excellent absorber of microwave energy, while hematite is not.5) However, our final target is to apply low-quality ore to microwaves ironmaking. Raw material for research is not to be limited to magnetite ore. Since the reserve of hematite ore is larger than that of magnetite ore, it is necessary to examine the applicability of hematite to the microwave ironmaking.
Standish and Huang6) have carried out a pioneering experimentation with regard to the microwave ironmaking. They have compared the heating behavior as well as the carbothermic reduction rate for a mixture of powdery magnetite ore - carbonaceous material, with those for a mixture of hematite ore - carbonaceous material, and have found that two mixtures show no obvious difference in the heating behavior and in the reduction rate. They have presumed that Fe2O3 is reduced to Fe3O4 instantaneously after the onset of heating owing to the microwave volumetric heating associated with the carbonaceous material. Mourão et al.7) have also studied the carbothermic reduction of hematite ore by microwave heating. They have found that as the fraction of carbonaceous material increases, the maximum temperature attained increases, resulting in the higher reduction reaction rate. Both reports indicate that the main heat source of microwave heating is carbonaceous material rather than iron oxides. However, the carbon contents of their samples are quite sufficient compared to the possible quantities required for the reduction of hematite and/or magnetite ore assuming that the CO gas is produced by carbon. If the carbon content is reduced to the minimal amount, the heating behavior and the reduction reaction rate might change from their reports.
With respect to the carbothermic reduction behavior of iron ores by microwaves, the previous researches have only measured the temperatures as a function of time or with simultaneous thermogravimetric measurements.6,7) However, it is impossible to measure precisely the degree of oxide reduction by thermogravimetiric procedures because both CO and CO2 gases are produced. To carry out the in-situ observation of the degree of oxide reduction, the simultaneous gas analysis of the exhausted gas is necessary.
The aim of this study is to elucidate the carbothermic reduction behaviors of hematite powders, that is, the change in the constituent phases, by microwave heating using the gas analysis. We studied the effect of graphite content on the heating behavior of a mixture of hematite and graphite powders, and observed the heating behavior of pure substances, i.e., hematite, magnetite and graphite so as to estimate which substances are absorbers of microwaves during the reduction processes.
2. Experimental
2.1. Sample
Hematite powders (average particle size of 1 μm, 99.9% in purity) or magnetite powders (average particle size of 1 μm, 99.9% in purity) were mixed with powdery graphite (average particle size of 34 μm, 99% in purity), which were subjected to microwave heating. Table 1 summarizes the masses of substances and the C/O ratios for four samples, where the C/O ratio means the molar ratio of carbon to oxygen. The masses of hematite and magnetite were set to produce 2 g of iron. A mixed powder sample was placed on a crucible made of mullite brick, the inside of which was coated by alumina cement. The bulk densities of the mixtures are ca. 0.75 g·cm–3 for four samples. The hematite, magnetite and graphite powders were also employed for the microwave heating experiment of pure substances. 3 g of each pure substance was subjected to microwave heating in the same manner as the heating experiment of mixed powders. Since the hematite power could not be heated from room temperature, the powder preheated by a conventional electric furnace was also subjected to microwave heating.
Table 1. Mass of each substance and C/O ratios for the samples.
| Sample | α-Fe2O3/g | Fe3O4/g | C/g | C/O |
|---|
| H | 2.8595 | – | 0.6446 | 1.0 |
| M | – | 2.7640 | 0.5730 | 1.0 |
| Ha | 2.8595 | – | 0.9670 | 1.5 |
| Hb | 2.8595 | – | 1.2892 | 2.0 |
Figure 1 shows a schematic illustration of the experimental system. A sample in a crucible was placed inside a quartz tube (46 mm in inner diameter) connected to a thin quartz tube (7 mm in inner diameter), which enables us to control the atmosphere around the sample. To improve the accuracy of gas analysis, the dead volume in the quartz tube was decreased by inserting a closed quartz tube, as shown in Fig. 1. The samples were heated by a 2.45 GHz multi-mode microwave furnace. Prior to heating the sample, the quartz tube was flashed with a flow of nitrogen gas (99.9995%) for 1 h. A constant nitrogen flow of 100 mL·min–1 was then maintained during the heating. All samples were heated by a fixed microwave power of 3 kW. Sample temperatures were measured using an infrared pyrometer (Japan Sensor Co., FTZ6-R220-50S22): The measurement temperature range is 220–1700°C. The measurement wavelength is 1.95–2.5 μm, where the silica tube is transparent. The emissivity was set as 0.77. The CO and CO2 gas components in the outlet gas were analyzed using a gas chromatograph (Shimadzu Co., GX-8APT): About 1.0 mL gas was syringed by a microsyringe at the gas sampling point in Fig. 1. The offset in the gas sampling time was calculated by the dead volume and the flow rate, and was appropriately corrected.
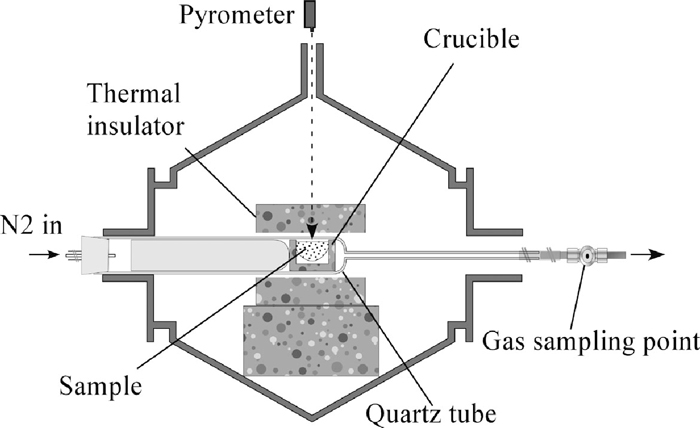
Figure 2 shows a schematic illustration of the furnace used in this study. The microwave furnace comprises eight 2.45-GHz magnetron oscillators, microwave isolators connected to each magnetron, WRJ-2 waveguides, and an applicator chamber. The magnetron generates microwaves at a variable power of 0.3–1.5 kW, for a total maximum output of 12 kW. The applicator chamber in the shape of a hexagonal cylinder was closed by two half spheres; this shape promotes focusing of the microwaves on the sample. At the two inlets of the applicator, fans were installed to scatter the microwaves to enable uniform heating of the samples.
Figure 3 shows a schematic illustration of the preheating experiment for hematite powders. Hematite powder was preheated in air in a conventional resistance furnace at various temperatures between 600 and 700°C for 15 min, and was transferred into the microwave furnace to be microwaved.
3. Results
Figure 4 shows the time dependencies of the temperature, the CO and CO2 gas concentrations in the outlet gas for the samples M and H. The temperature of the sample M abruptly increased up to around 1000°C in ca. 30 s after the onset of heating, and simultaneously, CO2 gas was generated. About 50 s later, CO gas was also started to be generated. On the other hand, it took as long as ca. 55 s for the temperature of the sample H to exceed 220°C, the limited measurement temperature of the pyrometer. The temperature moderately increased and reached 400°C in ca. 120 s after the onset of heating. Then, the temperature started to increase rapidly and became constant at around 1000°C; it took only 20 s for the temperature to increase from 400°C to 1000°C. With respect to the gas generation from the sample H, CO2 and CO gases were generated in ca. 130 s and ca. 150 s after the onset of heating.

Figure 5 shows the photographs of the samples M (a) and H (b) after microwave heating. As shown in Fig. 5, 2 to 5 mm diameter particles having metallic luster were obtained, indicating that metallic iron was produced, which was also confirmed by the X-ray diffraction analyses.

Figure 6(a) shows the temperature versus time curves for the samples H, Ha and Hb, where the C/O ratios for the samples H, Ha and Hb are 1.00, 1.50 and 2.00, respectively. It can be seen that the time required for the temperature to attain 400°C becomes shorter with increasing the C/O ratio, while the time for the temperature to increase from 400°C to the maximum temperature seems to be identical irrespective of the C/O ratios. Figure 6(b) shows the required times for the temperature to attain 400°C (open circle) and the times for the temperature to increase from 400°C to 800°C (solid circle) plotted against the C/O ratios for the samples H, Ha and Hb. The error bars represent the scatters in times for more than three runs.

Figure 7 shows the temperature versus time curves for pure substances, i.e., hematite, magnetite and graphite powders. With respect to hematite powder, the temperature could not exceed the lower limited temperature of the pyrometer even 400 s after the onset of microwave irradiation. However, when hematite powder preheated by a conventional resistance furnace was subjected to microwave heating, the temperature started to increase abruptly from ca. 400°C. This phenomenon of thermal runaway has also been reported by Pickles.8)
4. Discussion
4.1. Validity for the Gas Analyses of the Exhausted Gas
The validity for the gas analyses can be confirmed by mass balance. In this experiment, the mass change of the sample due to the reduction of iron oxides should be equal to the total mass, Δmt, of the CO and CO2 gases emitted during the reduction reaction. The total mass of the emitted CO and CO2 gases can be calculated by the following equation.
|
Δ
m
t
=
f
N
2
0
RT
p
T
∫
0
t
(
M
CO
x
CO
x
N
2
+
M
CO
2
x
CO
2
x
N
2
)
dt
| (1) |
where
f
N
2
0
is the average flow rate of N
2,
xi and
Mi are the molar fraction and the molecular mass of substance i (i = CO or CO
2), respectively,
T is the room temperature (= 25°C), and
pT is the atmospheric pressure (= 1 atm). The integral of
Eq. (1) can be deduced from the results of gas analysis shown in
Fig. 4: The areas under the CO and CO
2 gas concentration curves were calculated by trapezoidal approximation. The mass change of the sample due to the reduction of iron oxides was obtained by measuring the masses of the sample with the crucible before and after the reduction experiment. The ratio of the mass change of the sample to the Δ
mt value was calculated to be 1.00 for sample M and 1.02 for sample H, confirming the excellent experimental accuracy.
4.2. Carbothermic Reduction Behavior of Hematite Powders by Microwave Heating
Figure 8 shows the time dependencies of the reduction ratios of magnetite and hematite for samples M and H, respectively. Here, the reduction ratio is defined by the ratio of the oxygen amount released from a sample against the oxygen amount originally contained in the sample. The oxygen amount released from a sample corresponds to the total oxygen amount contained in the CO and/or CO2 gas produced up to t s after the onset of heating, which can be deduced from the results of gas analyses in Fig. 4. The reduction ratios R (%) were calculated by Eq. (2) using trapezoidal approximation.
|
R=
f
N
2
0
RT
n
O
p
T
∑
(
t
i+1
-
t
i
)
(
x
CO
x
N
2
+2
x
CO
2
x
N
2
)
t
i+1
+
(
x
CO
x
N
2
+2
x
CO
2
x
N
2
)
t
i
2
×100
| (2) |
The numbers added on the reduction ratio curve of sample H correspond to the gas sampling points subjected to the gas chromatograph analyses.
Assuming that the reduction reactions are not topochemical, but progress homogeneously throughout the sample, the constituent phases can be estimated from the reduction ratios R (%). The reduction ratios R (%) of Fe3O4 and FeO from Fe2O3 (sample H) are 11% and 33%, respectively. Therefore, it is considered that Fe2O3 and Fe3O4 coexist at the sampling numbers 1 to 4, Fe3O4 and FeO at the numbers 5 and 6, and FeO and Fe at the numbers 7 to 16.
Figure 9 shows the pCO/(pCO+pCO2) ratios versus temperature curves plotted in the Fe–C–O phase diagram,9) where pCO and pCO2 represent the partial pressures of CO and CO2, respectively. The pCO/(pCO+pCO2) ratios were calculated using the results of gas analyses. The numbers added in Fig. 9 correspond to the numbers in Fig. 8. It can be seen from Fig. 9 that the numbers 3 and 4 and the numbers 5 and 6 are in the Fe3O4 and FeO thermodynamically-stable regions, respectively, which are in good agreement with the interpretation of Fig. 8. The number 7 should be in the Fe stable region according to Fig. 8, although, as a matter of fact, it is not. This may be because the reduction reaction does not really progress homogeneously. Considerations of Figs. 8 and 9 indicate that α-Fe2O3 is reduced to Fe by a consecutive reaction through Fe3O4 and FeO by microwave heating in a manner similar to the reduction reaction caused by radiation heating. The authors have reported that the carbothermic reduction of Fe3O4 also occurs by a consecutive reaction by microwave heating.10,11)

It can be seen from Fig. 8 that the reduction of magnetite starts just after the onset of heating, while hematite only starts to be reduced 100 s later. This is due to the fact that it takes longer time for the temperature of the sample H to reach the reaction temperature. On the other hand, the reduction of the sample H is finished only 50 s after the completion of the reduction of the sample M, indicating that the reduction reaction rate of hematite is faster than that of magnetite. This coincides with the fact that the reducibility of hematite is better than the reducibility of magnetite, which has been confirmed by conventional heating.12)
4.3. Heating Mechanism during the Reduction Process
In Fig. 8, the reduction ratio R (%) of FeO from Fe3O4 (sample M) is 25%, and those of Fe3O4 and FeO from Fe2O3 (sample H) are 11% and 33%, respectively. Assuming that the reduction reactions are not topochemical, but progress homogeneously throughout the sample, it has been found from Fig. 8 that the sample M is reduced to FeO ca. 70 s after, and the sample H is reduced to Fe3O4 and to FeO ca. 150 s and 185 s after the onset of heating, respectively. The estimated reduction behaviors are shown in Fig. 10, where the onset times of reduction reactions, i.e., ca. 20 s and ca. 100 s for samples M and H correspond to the onset times of CO2 gas generation shown in Fig. 4. It can be considered from Fig. 10 that the rapid heating of the sample M at the beginning is due to the microwave absorption of Fe3O4, on the other hand, the moderate temperature increase in the sample H at the beginning is associated with the microwave absorption of graphite. The temperature of the sample H started to increase abruptly at around 400°C, in which 90% of Fe2O3 still remained as Fe2O3 and only 10% of Fe2O3 was reduced to Fe3O4 according to the results of the reduction ratios in Fig. 8. This indicates that the abrupt temperature increment is mainly due to the thermal runaway of Fe2O3, which is consistent with the results shown in Figs. 6 and 7: The times demanded for the temperature to increase from 400°C to the maximum temperature are independent of the graphite content (Fig. 6), and Fe2O3 in fact show the thermal runaway around 400°C (Fig. 7).

Hematite ore could be a possible raw material for microwave ironmaking: When hematite ore is utilized, the ore should be preheated up to around 400°C prior to the feeding to a microwave furnace.
In this study, hematite or magnetite powders with average particle size of 1 μm were mixed with powdery graphite with average particle size of 34 μm. The authors have carried out the microwave heating experiment on the powdery Fe3O4 samples having different particle sizes in the range of 1 μm to 5 mm, and have found that the microwave absorptivity hardly depends on the particle size.13) This may be due to the quite a large penetration depth of Fe3O4. However, the particle size effect should also be investigated for the mixtures of powdery iron oxide and graphite in the future.
5. Conclusions
The carbothermic reduction behaviors of hematite powders by microwave heating were elucidated using the gas analysis. The effect of graphite content on the heating behavior of a mixture of hematite and graphite powders, and the heating behaviors of pure substances, i.e., hematite, magnetite and graphite powders were also studied so as to estimate which substances are absorbers of microwaves during the reduction processes. The obtained results are summarized as follows:
(1) α-Fe2O3 is reduced to Fe by a consecutive reaction through Fe3O4 and FeO by microwave heating in a manner similar to the reduction reaction caused by conventional heating.
(2) It takes longer time to initiate the reduction of hematite than that of magnetite because hematite is hardly heated from room temperature by microwave. However, once the temperature reaches sufficiently high temperature and the reduction reaction starts to take place, the reduction reaction rate of hematite is faster than that of magnetite, which is the same behavior as that observed by conventional heating.
(3) The temperature of the hematite – graphite mixed powder moderately increases at the beginning, which is associated with the microwave absorption of graphite. On the other hand, the temperature of the mixed powder starts to increase abruptly at around 400°C. This is considered to be due to the thermal runaway of Fe2O3.
References
- 1) K. Ishizaki, K. Nagata and T. Hayashi: ISIJ Int., 46 (2006), 1403.
- 2) K. Hara, M. Hayashi, M. Sato and K. Nagata: J. Microwave Power E. E., 45 (2011), 137.
- 3) K. Kashimura, M. Sato, M. Hotta, D. K. Agrawal, K. Nagata, M. Hayashi, T. Mitani and N. Shinohara: Mater. Sci. Eng. A, A 556 (2012), 977.
- 4) K. Hara, M. Hayashi, M. Sato and K. Nagata: ISIJ Int., 52 (2012), 2149.
- 5) S. Zhong, H. E. Geotzman and R. L. Bleifuss: Miner. Metall. Proc., 13 (1996), 174.
- 6) N. Standish and W. Huang: ISIJ Int., 31 (1991), 241.
- 7) M. B. Mourão, I. P. de Carvalho, Jr. and C. Takano: ISIJ Int., 41 (2001), S27.
- 8) C. A. Pickles: Miner. Eng., 17 (2004), 775.
- 9) R. A. Gidding and R. S. Gordon: J. Am. Ceram. Soc., 56 (1973), 111.
- 10) Y. Yokoyama, H. Hayashi and K. Nagata: CAMP-ISIJ, 21 (2008), 898.
- 11) N. Sabelström, M. Hayashi, Y. Yokoyama, T. Watanabe and K. Nagata: Steel Res. Int., 84 (2013), in press.
- 12) J. O. Edström: J. Iron Steel Inst., 175 (1953), 289.
- 13) M. Hayashi, Y. Yokoyama and K. Nagata: J. Microwave Power E. E., 44 (2010), 198.


