Regular Article
Influence of Carbide Particles on the Grain Growth of Ferrite in an Fe–0.1C–0.09V Alloy
2013 Volume 53 Issue 7 Pages 1245-1252
Details
2013 Volume 53 Issue 7 Pages 1245-1252
The pinning effects of carbide particles on the grain growth of ferrite were studied in an Fe–0.1C–0.09V alloy. The distribution of real particle sizes in touch with grain boundary was determined coupling the measurement of diameters of the largest section of each particle on multiple sections with computer simulation. This procedure can improve remarkably the accuracy in evaluating the number of particles in the system composed of particles of widely varying sizes. The particle numbers in contact with grain boundary faces, edges and corners were considerably greater than those calculated assuming random distribution. The theory that all particles pin grain boundaries, Nishizawa et al.’s correlation model and a modified Hunderi-Ryum’s model are able to predict the grain size in fair agreement with experiment. A better account for final grain size was given by the mean size of particles in contact with grain boundaries rather than that of all particles probably because the particle size was highly non-uniform due to the formation of cementite and vanadium carbide.
The retardation of grain growth by second phase particles is known as Zener pinning.1) This phenomenon has a well-established industrial application such as suppression of grain coarsening in heat-affected zone of weld. The mechanisms by which the boundary pinning operates and particles which prevent grain growth most efficiently have been a subject of keen investigation for many years.2) In order to improve the predictive capability the original Zener theory has been modified in three ways. One is the rigorous treatment of pinning force of individual particles. The second is correction as to the difference between the curvature of migrating boundary and grain radius.3,4) The third is concerned about the non-uniform spatial distribution of particles. When particles are trapped during grain growth, boundaries will bend, slow down and even cease to move. Hence, the number of particles in touch with the boundaries is likely to increase and pinning force is expected to be larger than the force which the boundary would encounter from randomly dispersed particles. Indeed, Couturier et al.5) reported by computer simulation that a higher density of particles, nearly four times, resided on the grain boundary during normal grain growth than the density expected from random dispersion assumed in the original Zener theory. A number of modified Zener theories have been proposed to take into account the effects of non-random distribution of pinning particles. The final grain size is predicted to depend on f –1/2 if all particles are in contact with grain boundaries, where f is the volume fraction of particles.6,7,8) If all particles pin grain corners the grain size depends on f –1/3.9) Nishizawa et al.10) assumed that particles lying within half the mean inter-particle spacing from the boundary contribute to the pinning and proposed the f –2/3 dependence of final grain size. Hunderi-Ryum took the pinning at all grain boundary sites into account11) and derived an essentially f–1 dependence as in the original Zener equation assuming uniform distribution of particles. Since f is usually an order of 10–2 or less, corrections concerning non-random particle distribution would entail a most significant consequence in the prediction of final grain size.
Under this circumstance we have conducted serial sectioning to observe the spatial distribution of carbide particles in a cold rolled and annealed Fe–0.1C–0.09V alloy. In this alloy two kinds of carbide particles, cementite and vanadium carbide, contribute to the pinning while in our previous study in an Fe–0.1C–0.0005B alloy12) only one kind of carbide, i.e. cementite, was formed. The number and size distribution of particles in contact with grain faces, edges and corners were measured in multiple sections and the influence of non-uniform spatial distribution of particles on grain growth is discussed in terms of modified pinning theories.
A high-purity Fe–C–V alloy was vacuum-induction melted using electrolytic iron, high purity carbon and vanadium. A 10 kg ingot was hot-rolled and homogenized at 1250°C for 2 days. The chemical composition of alloy is shown in Table 1. The homogenized alloy was 80% cold rolled and cut into square specimens 10 mm in side and 0.6 mm in thickness. Specimens were vacuum-sealed for annealing at 700°C for up to 4 days. They were also annealed at the same temperature under flowing argon in a tube furnace for comparison of ferrite grain size and particle distributions with those of vacuum-sealed specimens.
| Fe | C | V | Mn | Si | P | S | Al | N |
|---|---|---|---|---|---|---|---|---|
| Bal. | 0.108 | 0.092 | <0.01 | <0.02 | <0.002 | <0.0001 | <0.002 | <0.004 |
Two kinds of carbide particles are expected to form in ferrite as shown in the vertical section of Fe–C–V phase diagram calculated at the V concentration of 0.092 mass% by Thermo-calc with TCFE6 database, see Fig. 1. As shown in Table 2, the cementite contains very little vanadium whereas VC (NaCl-type vanadium carbide) contained a substantial amount of Fe. The ratio of the Fe plus V concentration to the carbon concentration in vanadium carbide is seen to be slightly less than the stoichiometry. The volume fraction of cementite is ca. 6 times greater than that of vanadium carbide.
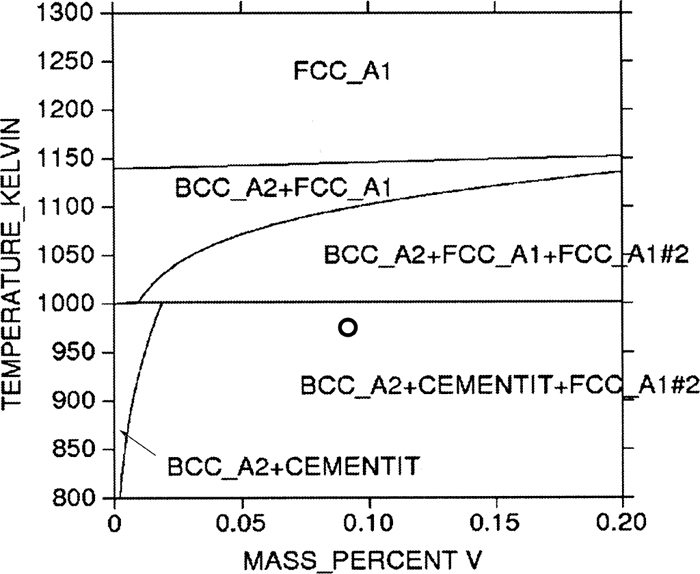
Vertical section of Fe–C–V phase diagram calculated at 0.1 mass% carbon by Thermo-calc. An open circle denotes the bulk alloy composition. BCC_A2, FCC_A1, FCC_A1#2 and CEMENTIT indicate ferrite, austenite, vanadium carbide and cementite, respectively.
| Fe | V | C | Possible formula | Volume fraction | |
|---|---|---|---|---|---|
| Cementite | 0.929 | 0.0040 | 0.0669 | (Fe0.995V0.005)3C | 0.011 |
| Vanadium carbide | 0.206 | 0.627 | 0.167 | (Fe0.23V0.77)7C6 | 0.0018 |
In order to measure the number and size distribution of carbide particles ca. 90 optical micrographs were taken by serial sectioning. The mean removal depth between consecutive sections measured by the change in the diagonal length of hardness indentation was δ=0.25±0.02 μm. The sample volume was thus 108 μm in height, 147 μm in width and 22.5 μm in thickness. In this study 17 consecutive sections which covered largest particles (~4.2 μm) were selected. The horizontal positions and the sizes of all particles in 2-dimensional section were recorded by software of 2D quantitative microstructural analysis. It was not difficult to identify particles between consecutive sections if they were not too small, while it was necessary to use scanning electron microscope to measure the number and size of smaller particles. Instead of recording the number of sections in which one particle was cut,12) the diameter of the largest section was recorded for each particle and classified according to the size. This apparent size distribution on multiple sections was converted to the real size distribution in space following the procedure described in section 3.3 and Appendix.
The grain size was measured in vacuum-sealed specimens and specimens annealed under flowing argon. It was plotted against annealing time in Fig. 2. In the former specimens the grain size increased fast initially and very slowly at prolonged holding. In the latter specimens, however, the grain size continued to increase at long times. This is probably because decarburization occurred during annealing under argon, as observed previously in an Fe–C–B alloy.12)
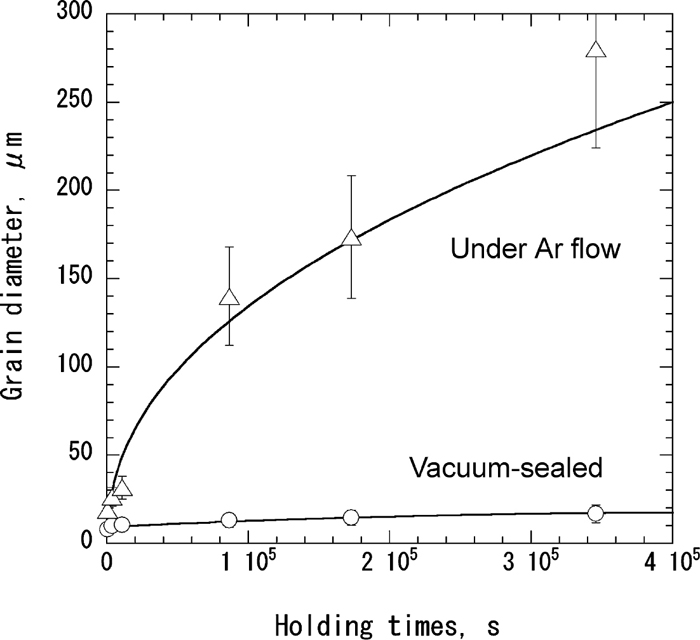
Variation with annealing time of grain size of vacuum-sealed specimens and specimens annealed in flowing argon. The annealing temperature was 700°C.
Figure 3 shows the SEM micrograph of a vacuum-sealed specimen annealed for 3 hr. An SEM-EDX analysis was conducted to identify the particles. Larger particles formed at grain boundaries contained little vanadium and thus, they are cementite. On the other hand, smaller particles observed in the matrix and at grain boundaries, 100–300 nm in diameter, contained vanadium, while a substantial proportion of particles of this size did not contain vanadium. Hence, particles in the matrix are either VC or cementite.
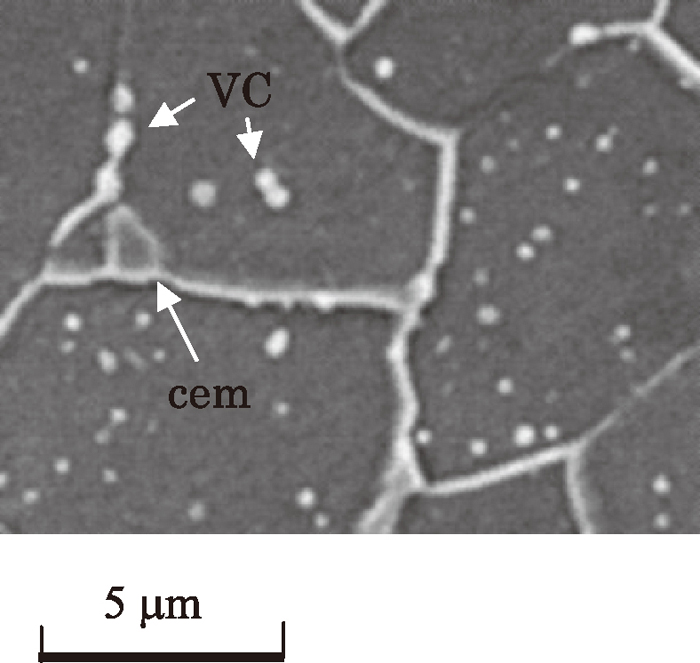
SEM micrograph of a specimen vacuum-sealed and annealed at 700°C for 3 hr.
Grain edges and corners were identified by recombination of grain boundaries and triangular annihilation. Figures 4(a) through 4(c) are an example of the former. Here, particles in touch with the triple points are painted green, particles observed apparently at grain faces are painted blue, even though they are in touch with the triple point in the next section and particles in the matrix are painted red. In Fig. 4(a) two grains A and C are abutting on each other. In Fig. 4(b) grains B and D come closer and are in touch with each other in Fig. 4(c), which indicates that a grain corner exists between sections b) and c). Since particle 1 does not touch with grain D in any section, it does not lie on the corner. Also, particle 3 does not reside on the corner because it is not in touch with grain A in any section. Thus, only particle 2 resides on the corner.
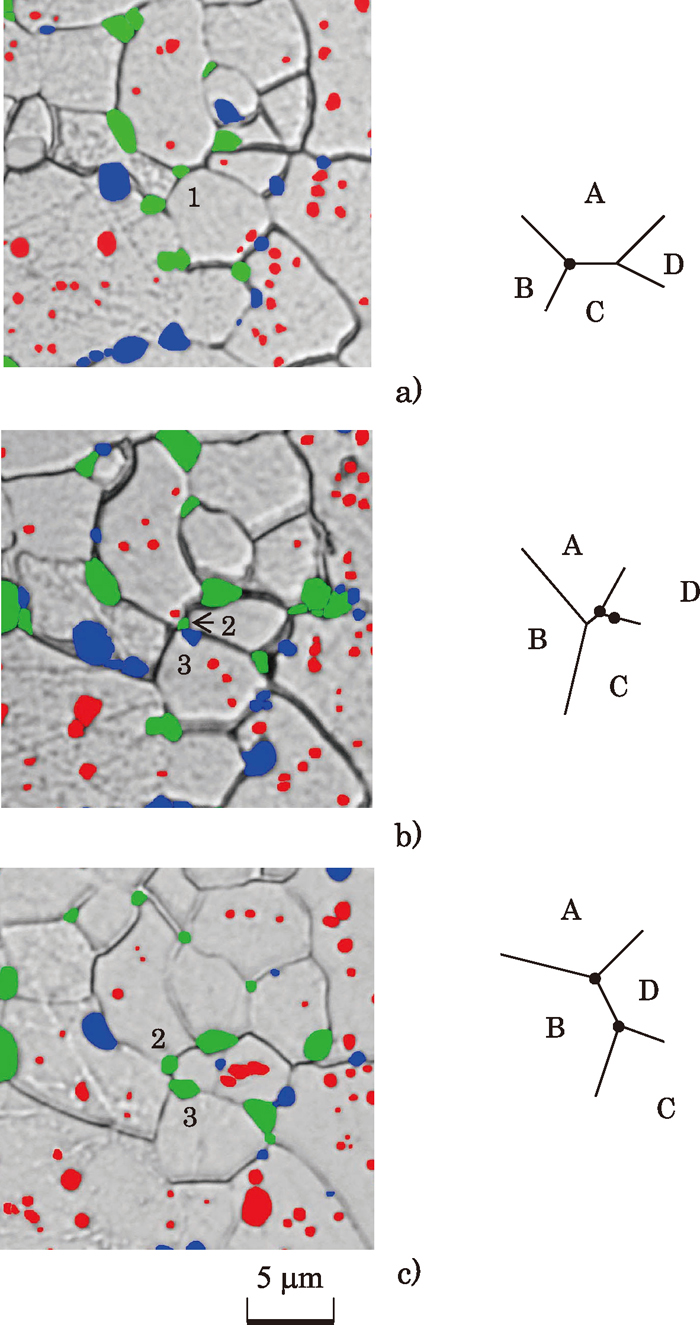
Identification of pinning site of carbide particles at grain corner by recombination of grain boundary. The recombination of grain boundaries occurred from A/C to B/D.
In Figs. 5(a) through 5(c) is shown an example of triangular annihilation. Here, particle 3 and grain E, which was probably beneath particle 1, newly appeared in Fig. 5(b). Thus, particle 1 is likely to reside on the corner made from grains B, C, D and E. It is also likely that recombination of grain boundary occurred from B/D to A/E between sections a) and b). Hence, particle 2 may be in touch with the corner made from grains A, B, D and E. However, particle 3 probably lies on the edge made from grains A, D and E because it is not in contact with grain B or C in any section.
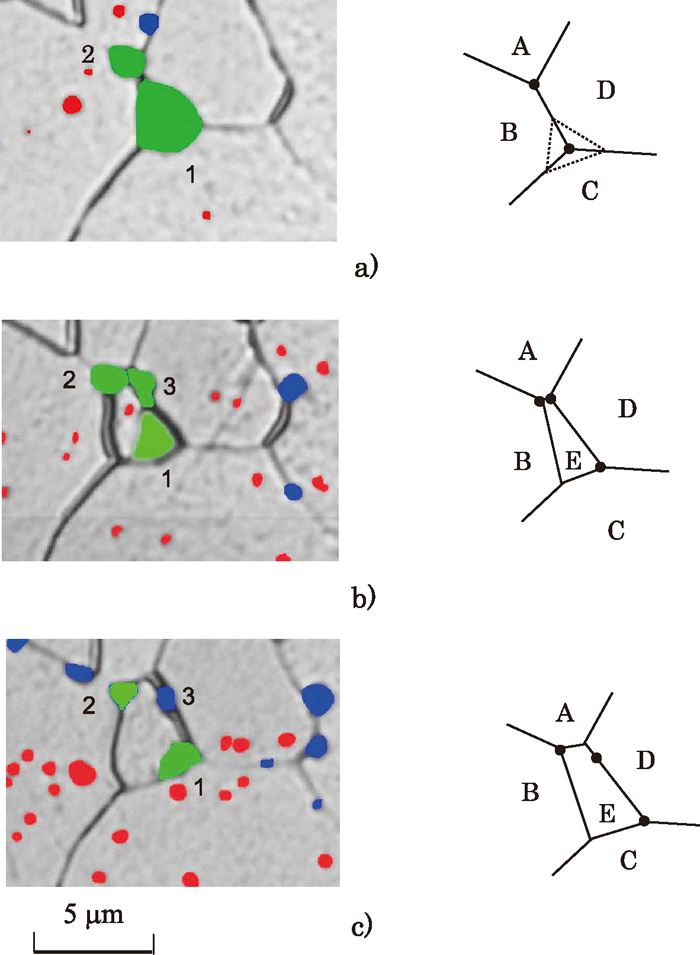
Identification of pinning site of carbide particles at grain corner by triangular annihilation. A new grain E appeared at the edge of grains B, C and D. Besides, boundary recombination occurred from B/D to A/E.
The distribution of real particle sizes in space is usually determined from the size distribution in one random section. For instance, readers are referred to Schwartz-Saltykov diameter analysis.13,14) In this study the particle size was measured in multiple sections and the diameter of the largest section Δmax was recorded for each particle. As illustrated in Fig. 6, Δmax is close to the real size (denoted d) if the particle is sufficiently large. However, the difference between Δmax and d can be large for a small particle and the particle may well be recorded in a smaller size group. Moreover, in the smallest size group (d ≤ δ ) a substantial fraction of particles are not counted because they do not appear in any section. Thus, a computer program was developed to calculate the number of particles that were missed or enrolled in a smaller size group in multiple sectioning. As described in Appendix, the conversion from the measured (denoted ni) to the real size distribution (Nj) is made by matrix A–1, the elements of which are related to the probability of finding a section diameter smaller than the true diameter of spherical particles. As seen from the calculated matrix, Eq. (A2), differences between observed and real particle numbers are significant only in a few smallest size groups (d ≤ 4δ). Hence, corrections in this regard do not have a major influence for particles on grain faces, even less at grain edges or corners because particles are relatively large. The distributions of real particle size thus calculated are shown in Figs. 7(a) through 7(d) for matrix and each boundary site. Particles in the smallest size group in Figs. 7(a) and 7(b) were primarily due to vanadium carbides while particles in Figs. 7(b) through 7(d) were mostly cementite. The number and mean size of particles are summarized in Table 3, together with the volume fraction calculated incorporating the distributions from the equation,
| (1) |
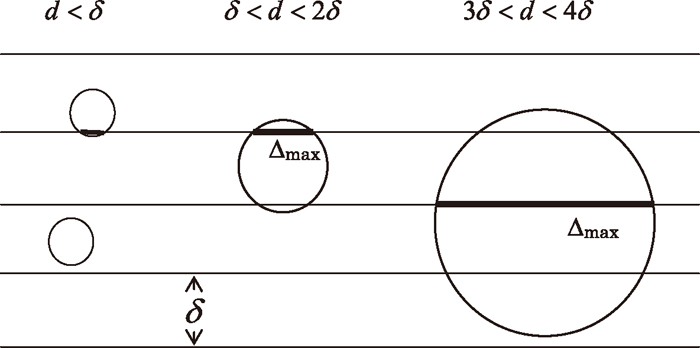
Schematic illustration of multiple sectioning of particle. The diameter of the largest section Δmax (thick line) becomes increasingly smaller than the real diameter d as the particle size decreases.
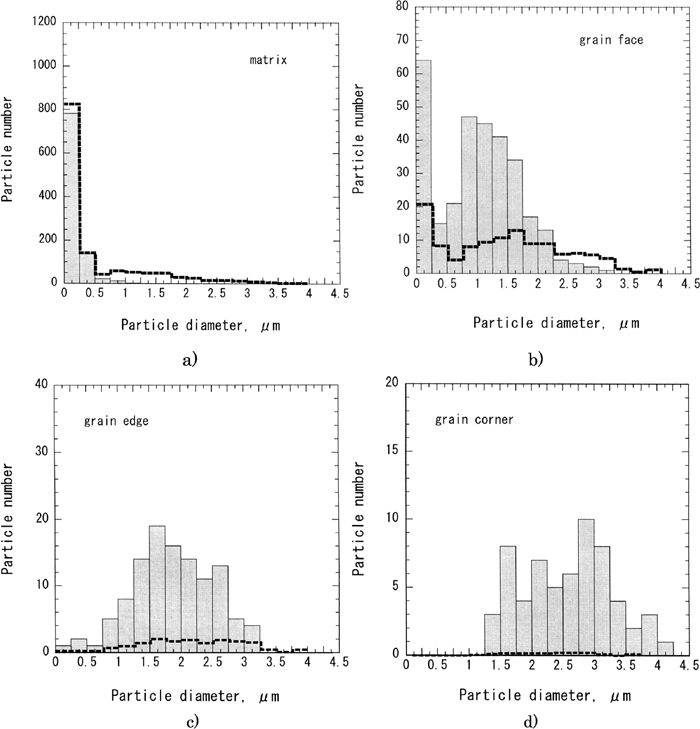
Size distribution of carbide particles a) in the matrix, and b) at grain faces, c) at grain edges and d) at grain corners. The ordinate is particle number in the sample volume. Thick dashed lines are the particle numbers calculated assuming particles were dispersed randomly in space.
| Matrix | Grain face | Edge | Corner | Total or mean*2 | ||
|---|---|---|---|---|---|---|
| All particles | Grain boundary | |||||
| Particle number | 956 | 303 | 114 (440)* | 68 (119)* | 1434 | 485 |
| Mean diameter | 0.17±0.01 | 1.04±0.03 | 1.87±0.06 | 2.57±0.09 | 0.59±0.02 | 1.43±0.04 |
| Volume fraction | 0.0001 | 0.0063 | 0.0068 | 0.0083 | 0.0215 | 0.0214 |
| Random dispersion | 1296 | 121 | 15 | 2 | 1434 | 138 |
The number of grain edges and corners identified in the sample volume were 440 and 119, respectively. Thus, 26 percent of edges and 57 percent of corners were occupied by particles. It is noted that the difference in particle size between the matrix and grain boundary sites is large compared to the difference in an Fe–0.1C–0.0005B alloy in which only cementite particles were formed.12)
During grain growth the migration of grain boundaries is hindered when they come across precipitate particles and even stop if the pinning force is strong enough. Thus, the number of particles which are in contact with grain boundaries is expected to be greater than it would be if particles were distributed in random fashion. The fraction of particles in contact with grain boundaries is a key parameter in the prediction of final grain size. A number of theoretical and computational studies were addressed to this problem and proposed the f–1/2, f–1/3 or f–2/3 dependence of final grain size on the particle volume fraction f.2)
Under this circumstance the experimentally determined size distributions are compared with the number of particles that are distributed in random fashion and in touch with grain boundaries. The number of particles in contact with grain face can be calculated from the equation,
| (2) |
| (3) |
| (4) |
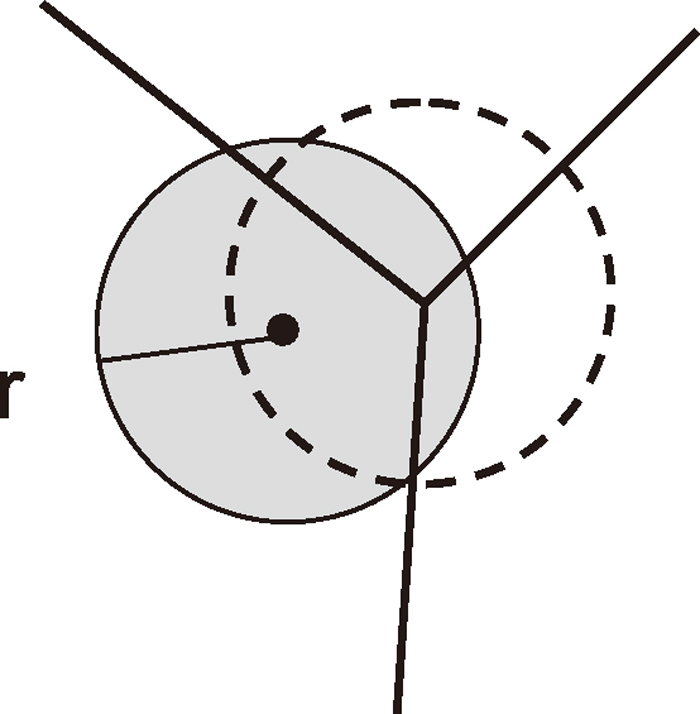
Schematic illustration of particle (grey circle) located within the distance r from the grain edge. The particle exerts a pinning force on the grain edge.
Before calculating the final grain size from modified Zener equations, we see that the measured volume fraction (f=0.021, Table 3) is considerably greater than that calculated by Thermo-calc (f=0.013, Table 2). This was also the case with an Fe–C–B alloy12) and was attributed to the overestimate of particle diameter in etched microstructure. Hence, we employ the volume fraction calculated by Thermo-calc. As for the mean particle radius, if we employ the mean radius of all particles, including those in the matrix (r= 0.30 μm, Table 3), the particle number calculated from f is of the order of 104 and thus, it does not represent the actual particle number within the sample volume. Although modified Zener equations do not explicitly contain the particle number, it plays a key role in the derivation of the equations. Indeed, if we employ the mean radius of all particles, the final grain sizes are calculated to be smaller from all modified equations than the measured grain size. As an alternative, if we use the mean radius of particles in touch with grain boundaries (r=0.71 μm), the particle number is about one third (=570) of all particles, and becomes closer to the particle number in contact with grain boundaries (=485).
In Table 4 are shown final grain sizes calculated from modified Zener theories using the latter mean particle radius. It is immediately seen that the original Zener equation yielded the grain size much greater than the measured one. The theory which assumes that all particles are in contact with grain boundaries yielded a grain size close to the measurement. The theory of all particles pinning grain corners gave too small grain sizes. The correlation model predicted a somewhat large grain size. In this model the number of particles that are responsible for pinning can be calculated from the equation 4r/3f2/3 10) and it yielded the particle number of 420, fairly close to the observed one at grain boundaries. If the mean radius of all particles was employed, it gives a rather good account for the final grain size (R=7.4 μm), but the particle number in contact with grain boundaries (=162) becomes too small. From these results the exponent of f in the range of 1/2–2/3 (n=1.5–2 in the equation R ∝ f-1/n) can account for the measured grain size.
| Model | Dependence of grain size with volume fraction f | Grain size, μm |
|---|---|---|
| Measured | – | 6.8±0.5 |
| Zener1) |
|
73.1 |
| Pinning at grain boundary |
|
5.9–12.5 |
| Pinning at grain corner |
|
3.8–5.5 |
| Nishizawa et al.10) |
|
17.3 |
| Hunderi-Ryum (H-R)11) |
|
24.3–27.0 |
| Modified H-R |
|
7.0 |
The Hunderi-Ryum (H-R) theory11) takes into account the pinning at grain faces, edges and corners altogether, but yielded a significantly larger grain size. This is because they calculated the numbers of particles in contact with all grain boundary sites assuming random dispersion. One can incorporate the observed non-random number of particles into H-R theory as follows. The final grain size R1 is obtained solving the quadratic equation,
| (5) |
| (6) |
| (7) |
| (8) |
| Grain face | Edge | Corner | |
|---|---|---|---|
| Pinning force,11) k/rγ | 3.14(=π) | 1.63 or 4.71 | 1.34 |
| Coefficients in H-R theory11) | a~4π* | b~10 | c~10 |
| Coefficients used in this work | a’ = 10.4 | b’=57.0 | c’=340 |
Both the original and modified theories would work best if the particle size is uniform. In the present alloy the particle size was highly non-uniform because two kinds of carbides were responsible for pinning. Moreover, once they become contact with grain boundaries, rapid coarsening may increase the degree of non-uniformity of particle size distribution. Indeed, the coarsening of pinning particles is one of the main issues in the simulation of grain growth.17) The exclusion of particles in the matrix probably is an oversimplification. However, in order to make the best use of simple Zener equations cautions have to be exercised in an alloy in which particles size is highly non-uniform.
The pinning effects of carbide particles on the growth of ferrite grains were studied in an Fe–0.1C–0.09V alloy, in which pinning was caused by cementite and vanadium carbide particles. Cementite particles were greater in both size and volume fraction than vanadium carbide particles. The number and size distribution of particles were determined separately at grain faces, edges and corners by serial sectioning, coupled with computer simulation. It is thought that measurement on multiple sections remarkably reduces the error in the evaluation of particle number at grain boundary site. The particle numbers thus determined were all greater than those calculated assuming random dispersion, progressively to a larger extent in the order of grain face, edge and corner.
All theories which predict the f–1/n dependence (n>1) gave a final grain size considerably smaller than the measured grain size if the mean radius of all particles was employed in the Zener equations. In contrast, when the mean radius of particles at grain boundary sites was employed, the predicted grain size was in fair agreement with the measured one except in the theory of corner pinning. Moreover, if measured non-randomly dispersed particles were incorporated, the grain size predicted from Hunderi-Ryum’s model became close to the experiment. It seems that the mean size of particles at grain boundary sites gave a better accounting than that of all particles because the former mean size represented better the actual number of particles pinning the boundaries although the particle number is not explicitly included in the equations. In order to make the best use of simple Zener-type equations necessary cautions should be taken in the prediction of final grain size in alloys in which the particle size is highly non-uniform.
This work was carried out with the aid of Steel Research Promotion Fund of The Iron and Steel Institute of Japan (No.19, 2010.4 – 2012.3).
The procedure of calculating the real size distribution of particles in space is as follows. Consider a cube of length l in which particles of certain radii are dispersed in random fashion. We take (s+1) sections in the cube, see Fig. A1, and measure the diameter of the largest section for each particle, Δmax (Fig. 6). Let aij be the fraction of particles whose real diameter is between jδ and (j+1)δ and Δmax is between iδ and (i+1)δ. Nj is equal to the number of particles present in the volume composed of the (s+1) sections except for j=0. The values of aij can be determined almost uniquely as long as a sufficiently large number of particles are dispersed within the cube. It is noted that the true diameters were varied between jδ and (j+1)δ by generating random numbers and thus, the system is not a mono-dispersed system of fixed particle radius, often assumed in the discussion of stereological analysis.13) Since particles of different j are actually present, the number of particles in the i-th apparent size group ni is given by the equation,
| (A1) |
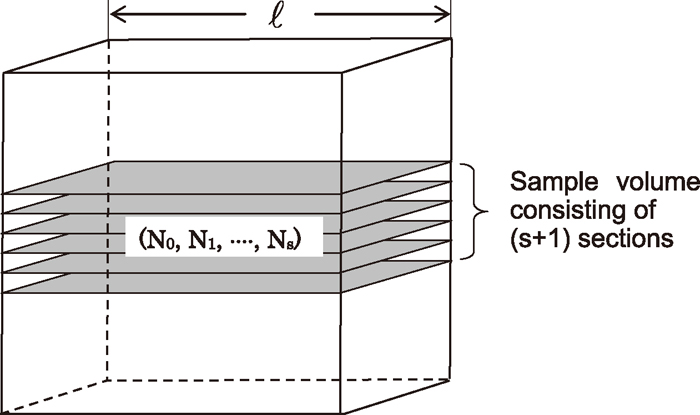
Schematic illustration of cube and sample volume composed of (s+1) sections.
The term a00 represents the fraction of particles which are smaller than δ and happen to be sectioned, while (1- a00) is the fraction of particles in the smallest size group which were missed by serial sectioning. The value of a00 depends upon the smallest diameter of particles present in the specimen. Here, the smallest particle diameter was taken to be 0.1 μm, as observed under SEM. Once all aij values are determined, one can calculate the real size distribution Nj from the distribution of Δmax, using the inverse matrix A–1.
Figures A2 and A3 show, respectively, the fraction of particles ni calculated with 17(=s+1) sections when particles of d=(2–3)δ, and d=(10–11)δ, are dispersed randomly within the cube (black columns). It is seen that the probability (or fraction) of particles being classified in the right group (i=j) is greater than 0.9 even for particles as small as j=2 and is very close to unity for large particles such as j=10. White columns show the distribution of apparent particle sizes on a single section. It was calculated from the same number of particles in the cube as in multiple sectioning. As expected, the sizes of particle sections scatter widely from 0 to j-th group on a single section. Moreover, the number of particles is much less because many particles are not cut by single sectioning. This would produce a larger amount of error in the calculation of real size distribution. Hence, the measurement in multiple sections improves greatly the accuracy in the evaluation of particle number and real size distribution.
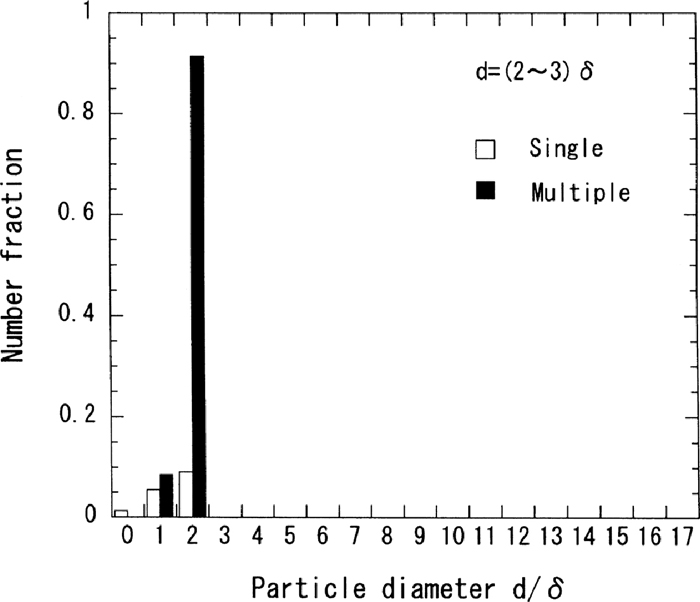
Distribution of Δmax of particles of d=(2–3)δ by multiple sectioning (black columns). a12=0.0848 and a22=0.915. White columns show the distribution of the apparent sizes of particles on a single section.
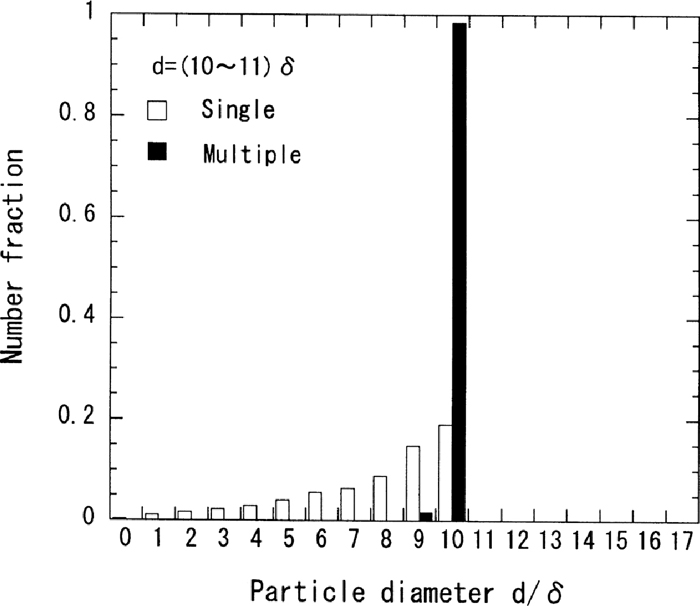
Distribution of Δmax of particles of d=(10–11)δ by multiple sectioning (black columns). a9,10=0.0161 and a10,10=0.984. White columns show the distribution of the apparent sizes of particles on a single section.
When measurement was made on 17 sections the inverse matrix A–1 is given by Eq. (A2), where matrix elements less than 0.001 were disregarded. It is emphasized that the values of matrix elements are not altered by the number of particles in the cube as long as the particles are spherical. Only a00–1(=0.706–1) varies with the smallest particle size in the specimen. It is seen that the magnitude of correction is less than 3% for j > 5. Hence, the measured particle numbers ni are not significantly different from the real particle numbers Nj in contact with grain face, even less at grain edges and corners. If one uses a smaller number of sections in the measurement, e.g. s=10, non-zero off-diagonal elements spread further upwards as expected from the size distribution on a single section in Figs. A2 and A3.
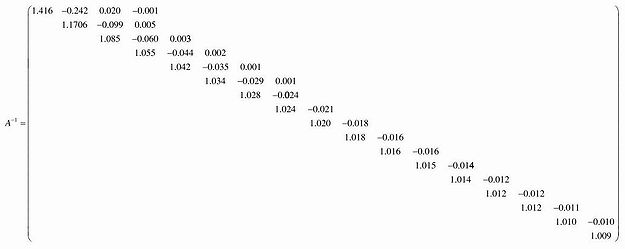 | (A2) |