Abstract
Currently, boron steel with Al–Si coating experiences a rapid growth in the anti-intrusion applications in the car body due to its superior mechanical properties after hot stamping. However, the final microstructure can be sensitive to delayed fracture if the product is exposed to a critical combination of diffusible hydrogen content, stresses and other metallurgical factors. As the metallurgical parameters and stresses are usually defined, the proper control of the diffusible hydrogen content is the key parameter to improve the safety aspect of the product. However, this content is quite difficult to determine. In this paper, the parameters governing the absorption and desorption of diffusible hydrogen in aluminized boron steels is investigated. The present research shows that the dew point and the austenitizing holding time have a bigger influence on the diffusible hydrogen content than the austenitizing temperature. Simultaneously, four-point bending test, which is simple and representative of the stress field that may be encountered in car bodies, is used to determine the acceptable limit of the diffusible hydrogen amount. Using this test, a delayed fracture map is proposed, which can be used as a guideline to determine the safe process areas. The study reveals that fast cooling rates or the sheared edges lead to lower the critical diffusible hydrogen content. Nevertheless, under the standard industrial operating conditions, the materials remain safe. Finally, an e-coating process that is applied to the sample surface induces an efficient degassing that provides an additional safety margin.
1. Introduction
In order to reduce the fuel consumption, it is necessary to reduce the weight of the vehicles. Therefore the new generation, high strength steels are largely integrated in the modern car bodies. In recent time, aluminized boron steel, a fully martensitic grade coated with Al–Si alloy, experiences a rapid growth in the anti-intrusion applications of the automotive structures, e.g. bumpers or doors, due to its excellent mechanical properties after hot stamping.1,2) The grade provides a very high strength of around 1500 MPa and can be formed to complex shapes without any shape deviation or spring-back. However, such microstructures are sensitive to delayed fracture. This phenomenon can be described as an unexpected fracture or a sudden ductility loss arising after a certain period of time. Previous investigations have shown that a critical combination of factors govern the occurrence of the delayed fracture: the presence of diffusible hydrogen,3,4) the rise of applied or residual stresses5,6) to a sufficient level during assembling for example and other metallurgic factors such as the chemical composition or the steel.7,8,9,10) As metallurgy and the stresses are usually driven by the process, uncontrolled hydrogen charging must be avoided to obtain safe products, especially when a coating hinders hydrogen escaping from the steel.11,12)
Thermal desorption analysis, TDA, has been largely applied for the study of the diffusible hydrogen in bare iron and steels.13,14,15,16) However, there is very little information available on the TDA analysis concerning the diffusible hydrogen content in the Al–Si coated steels. However due to the development of a specially designed TDA setup, it is now possible to measure the diffusible hydrogen content on the coated products.17,18,19) In addition, the set-up also able to quantify the influence of dew point, the austenitizing temperature and the holding time at the austenite temperature on the diffusible hydrogen content. In order to limit the diffusible hydrogen content, the dew point should be as low as possible and the austenitizing holding time must be as short as allowed by the process.
The Al–Si coating appears to be a barrier to the hydrogen diffusion at room temperature; thus the impact of post heating at temperatures below 250°C is evaluated. A focus is made on the potential impact of the customer post production treatment such as during e-coating, on the delayed fracture. A quite complete degassing is observed in this case, inducing a beneficial effect on the delayed fracture susceptibility.
Finally, the critical level of diffusible hydrogen for such microstructures is determined by the use of selective mechanical tests. As contrary to the cold formed steels, the hot stamped materials exhibit almost no residual stresses. Then, the main delayed fracture risk is associated to a poor assembling process which may generate high applied stresses with detrimental effect. In order to assess this risk, four-point bending test is used to determine the acceptable limits of the diffusible hydrogen as a function of the cooling rate after austenite soaking or as a function of the nature of sample edges. This test is simple and representative of the stress field that may be encountered in car bodies.
In summary, the present work aims to study the introduction of the diffusible hydrogen in an aluminized boron steel during the austenitizing process of press hardened parts. The best operating window for the hot stampers to minimize the diffusible hydrogen content is determined. In a second step, a post-heating similar to a baking operation after the cataphoresis deposit is applied and the impact of this baking process on the diffusible hydrogen degassing is demonstrated. Finally, the critical hydrogen contents as a function of the state of the sample edges and of the applying cooling rate is evaluated.
2. Materials
The investigated material is a patented aluminium-silicon coated 22MnB5 steel.20) The chemical composition of the steel grade is presented in Table 1. Mn, Si and Cr are mainly added to achieve the desired quenchability, while B prevents the ferrite formation during the transfer from the furnace to the hot stamping tool.
Table 1. Chemical analysis of the studied boron steel (mass%).
| C | Mn | Si | Cr | Ti | B | S | P |
|---|
| 0.22 | 1.3 | 0.25 | 0.15 | 0.04 | 0.003 | 0.002 | 0.013 |
The Al–Si coating microstructure at the delivery state is defined by the aluminizing reactions occurring during the continuous hot-dip process. The initial bath composition is about 88 wt% of Al, 9% of Si and 3% of Fe and the bath temperature is around 675°C. The liquid is in equilibrium with the ternary intermetallic compound having a chemical composition of Al4–9Fe1–4Si1–4 named τ6.
During the immersion, the chemical composition of the liquid in the vicinity of the steel surface is modified by iron dissolution from the steel. The first growing phase at the steel surface is the ternary intermetallic compound Al12–15 Fe3–6Si2–5 named τ5 that is in equilibrium with the Fe enriched liquid phase. However, as the intermetallic compound τ5 is not in equilibrium with ferrite, a thin layer of Fe2Al5 + FeAl3 grows that ensures the thermodynamic equilibriums along all the interfaces between steel and τ5 layer. During cooling after immersion, needles of solid τ6 grow in the liquid and facilitate the Al grains to nucleate and grow. At 575°C, the last liquid reaches the eutectic composition (87.02 wt% of Al, 12.2 wt% of Si and 0.78 wt% of Fe) and solidifies as a ternary eutectic Al + Si + τ6. So at the delivery state, the Al–Si coating stays as a multiphase coating.21)
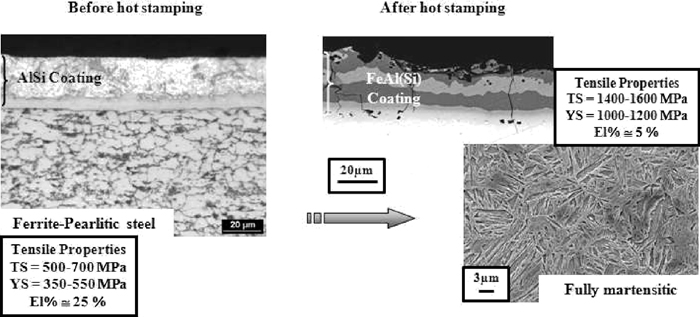
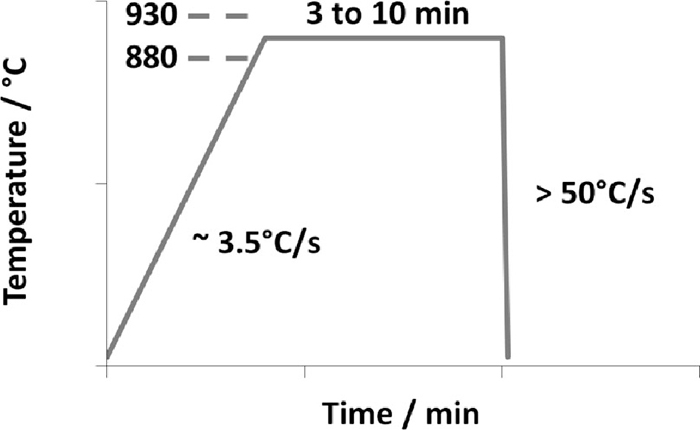
This present grade is designed to reach the outstanding mechanical properties at the final stage, i.e. heating to austenite + austenite soaking followed by hot stamping and quenching in the closed die. In the direct hot stamping process, the steel blank is heated in a furnace to an austenite temperature around 880–930°C and soaked there for 3 to 10 minutes in order to achieve 100% austenite as depicted in Fig. 1. It is then quickly transferred, typically within 5 to 7 s to a die quenching press in which it is simultaneously hardened and given the desired component form. The cooling rate is higher than 50°C/s to avoid the bainitic transformation in the deformed areas. Depending on the carbon content, an ultimate tensile strength between 1400 MPa and 1600 MPa, a yield strength between 1000 MPa and 1200 MPa and an elongation at fracture of 5% can be obtained. In the present study, tensile tests are performed following the ISO 6892-1:2009 standard (gage length is 80 mm).
The microstructures of the coating before and after the hot stamping operations are presented in Fig. 2. The final automotive part has a fully martensitic microstructure and the Al–Si coating is fully transformed into Fex–Aly(Si) compounds.21) The Pre-coating step offers lot of advantages: eliminates the necessity of temporary protection such as oil protection and the presence of an inert atmosphere during the austenite heating and soaking. Moreover, there is no scale growth on the product surface and therefore no need to remove the oxide layer after heat treatment with techniques like shot blasting that often leads to the deformation of the parts. This AlSi layer also avoids the steel decarburization, which could lead to a significant decrease in the fatigue properties. Finally, this coating gives a high corrosion protection, peculiarly in terms of perforating corrosion.
3. Experiments
3.1. Charging Procedure
Simulation of the heating conditions of hot stamping is carried out in an adapted furnace. Before injection, a part of the dry gas flow is bubbled in water at room temperature to reach the desired dew point. Dew points varying from –30°C to +20°C are achieved. A mirror hygrometer is used to measure the dew point on a sampled gas extracted above the sample. The total time includes the time, typically 3 or 4 minutes, to reach the austenite temperature and the soaking duration at this temperature. Both cold and hot water are used for quenching. Using of hot water at 80°C allows to achieve an average cooling rate of 65°C/s between the austenite temperature and 100°C, which simulates the approximate cooling rate of the die quench process after hot stamping. In contrast, cold water provides an average cooling rate higher than 100°C/s, typically close to 150°C/s.
A square plate of 250 mm and having a thickness of 2.1 mm is used for the present study. Table 2 summarises the employed charging conditions. Mechanical tests have not been performed on these samples.
Table 2. Summary of the applied austenitizing conditions to study the hydrogen absorption.
| Austenitizing Temperature | Holding time | Dew Point | Cooling rate |
|---|
| 920°C, 980°C | 5, 10, 15, 20 and 30 minutes | –15, 0, 5, 10, 15 and 19°C | ~ 65°C/s |
| 980°C | 4 and 15 minutes | +15°C | ~ 65°C/s |
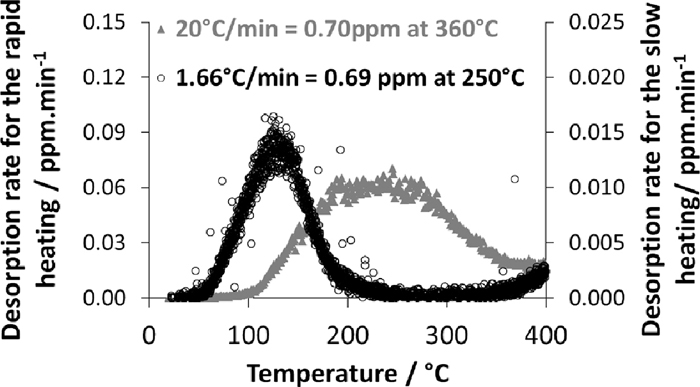
The TDA set-up consists of a heating room in which a flat sample is heated in an I-R furnace at 20°C/min under a constant flow of pure nitrogen up to 900°C. The temperature is recorded by a thermocouple spot welded on the sample surface. Released hydrogen carried by nitrogen is detected by a quadrupole mass spectrometer. The typical sample dimensions are 25 mm in width and 80 mm in length. Filters are included before analysers in order to avoid any spectrometer contamination due to the coating. In the present study, the calibration is performed by a certified gas mixture of 50 ppm hydrogen in nitrogen having a standard deviation of 0.7 ppm. In order to avoid the hydrogen desorption, the samples are stored in liquid nitrogen until the measurement is conducted on them. After removal from cryotank, the samples are cleaned in acetone and dried. Desorption curves are analyzed and the rate of desorption is expressed in mass ppm/min as a function of the temperature expressed in °C. The diffusible hydrogen content is quantified during heating by integrating the signal from the room temperature to 360°C when the test is performed at a heating rate of 20°C/min. In the case of slower heating rate, such as at 1.66°C/min, the integration of the signal is stopped at 250°C. As shown in Fig. 3, the integration gives similar amount of diffusible hydrogen for both the heating rates.
The Al–Si coating is supposed to block the hydrogen diffusion completely at room temperature.19)
However, post heating at moderate temperatures may possibly promote some hydrogen escape through the coating. In order to quantify the potential desorption as a function of test temperature and time, the isothermal experiments are performed in TDA, which involves a fast heating followed by isothermal holding. Hydrogen desorption from 25 mm width and 80 mm length samples is measured for 7 hours at temperatures ranging from 50 to 250°C that allows to determine the fraction of hydrogen desorbed during the isothermal holding. Moreover the residual diffusible hydrogen after isothermal holding is also quantified. The sum of hydrogen desorbed during holding and residual hydrogen after holding corresponds to the total hydrogen measured on the samples before holding.
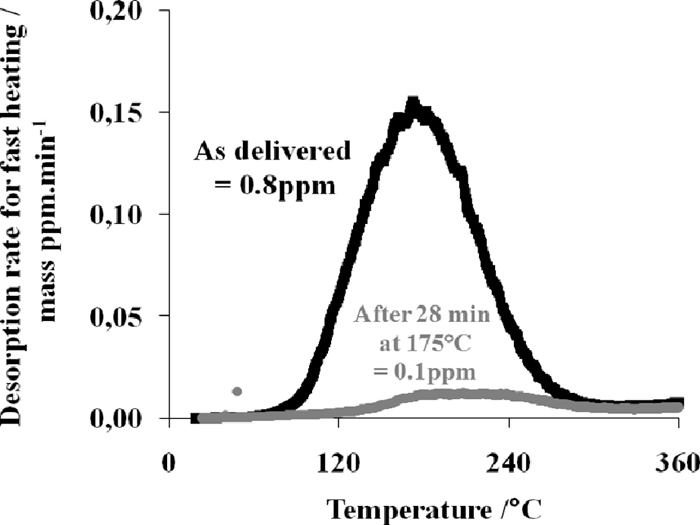
Additionally, in order to verify the effect of a paint baking cycle, an e-coating is applied on the samples presenting an initial content of 0.8 ppm diffusible hydrogen. The process sequences are as follows: first the phosphating and then cataphoresis deposit and baking at 175°C for 28 minutes. Hydrogen measurements are carried out on the e-coated samples without the removal of e-coating employing a heating rate of 1.66°C/min. This helps to avoid the burning and fast decomposition of e-coating. The measurements are also performed on the post heat treated samples; i.e., baking cycle without phosphating and cataphoresis at a heating rate of 20°C/min.
3.4. Mechanical Testing
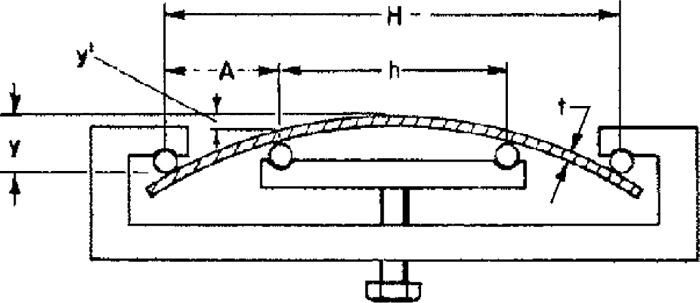
The four points bending test simulates the potential applied stress that can be experienced by the product during a poor assembling process on a stress free part. The sample dimensions are as follows: 40 mm in width and 110 mm in length. The test is originally standardized to assess the stress corrosion cracking resistance of beams exposed to gaseous or liquid environments.22) In the above situation, the hydrogen content is expected to increase with time due to sample corrosion, whereas, in the present experiments, the hydrogen level is fixed by the austenitizing parameters and there is no additional hydrogen pick up during the experiment. However in reality, a small decrease of the global amount is expected as the bare edges do not prevent hydrogen escape. In addition, the crack initiation can also be greatly influenced by the edge nature: laser or machined edges are less detrimental than the mechanically cut edges. The maximal stress experienced by the skin can be expressed by the equation presented below provided that the whole specimen remains elastic:
|
σ=
12Ety
3
H
2
-4
A
2
| (1) |
where
E is the Young modulus,
t is the specimen thickness,
y is the deflection between the centre of the specimen and the outer supports,
H is the distance between the two outer supports and
A is the distance between the inner and outer supports as shown in
Fig. 4. The stress values are measured by attaching a strain gage at the surface of the specimen. It is observed that the data predicted by the
Eq. (1) is in accord with the measured values.
In order to build a delayed fracture map, another set of specimens with various hydrogen contents are produced and tested. As described in the previous chapter, it is possible to modify the dew point, the austenite temperature and the soaking time at the austenite temperatures to gradually increase the diffusible hydrogen amount. For a fixed amount of diffusible hydrogen, the sensitivity to delayed fracture increases with increasing the value of cooling rate. This is because as the cooling rate increases, it reduces the volume fraction of auto-tempered martensite and thus increases the product hardness. The auto-tempered martensite presents a lower hardness as compared to the quenched martensite due to the carbide precipitation that occurs during tempering. Two quenching modes are therefore tested: the standard die quenching process simulated by the use of hot water; i.e., the cooling rate is about 65°C/s and the most severe cold water quenching for which the cooling rate is above 100°C/s. The specimen is loaded for 200 hours at a maximal stress at the surface expressed as a function of the material yield strength. If no crack appears during this period, the specimen is considered as safe. On the opposite, if a crack appears, new samples are tested at lower stress until no cracks appear.
4. Results
4.1. Hydrogen Absorption
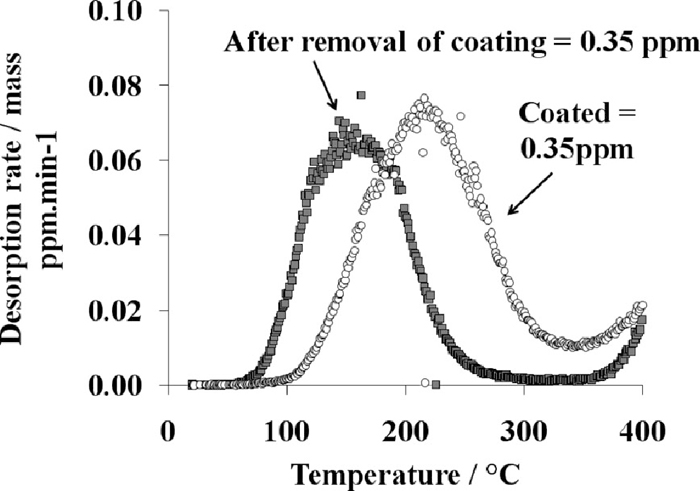
Typical desorption curves obtained after austenitizing at 920°C for 5 minutes and 30 minutes are presented in Fig. 5. Dew point inside the furnace is +19°C. No diffusible hydrogen is present before charging. After austenitizing, a hydrogen peak appears at temperatures ranging between 200°C to 225°C. Hydrogen escape indicated by this peak is termed as the ‘diffusible hydrogen’ in the following part of the article. Diffusible hydrogen level varies from 0.45 to 0.95 ppm as a function of the austenitizing time. Table 3 summarizes all the values obtained as a function of time and dew point inside the furnace. In Fig. 6, it is demonstrated that the diffusible hydrogen stays within the steel and not partially in the coating.
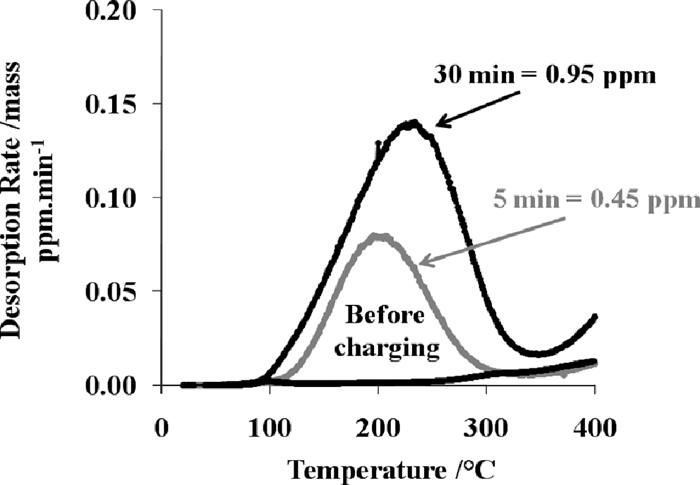
Table 3. Summary of diffusive hydrogen content expressed in mass ppm as a function of the austenitizing time and dew point.
| Dew Point/°C | Time/min |
|---|
| 5 | 10 | 15 | 20 | 30 |
|---|
| –15 | 0.24 | 0.38 | 0.42 | 0.45 | 0.33 |
| 0 | 0.37 | 0.49 | 0.39 | 0.42 | 0.43 |
| 5 | 0.36 | 0.46 | 0.66 | 0.66 | 0.67 |
| 10 | 0.43 | 0.59 | 0.68 | 0.69 | 0.76 |
| 15 | 0.49 | 0.65 | 0.78 | 0.81 | 0.84 |
| 19 | 0.44 | 0.70 | 0.79 | 0.83 | 0.92 |
After mechanical removal of the coating by grinding, the hydrogen content of the first peak remains very similar to the previous one. However, the new peak appears at a lower temperature due to the absence of the coating, which acts as a barrier for diffusion.
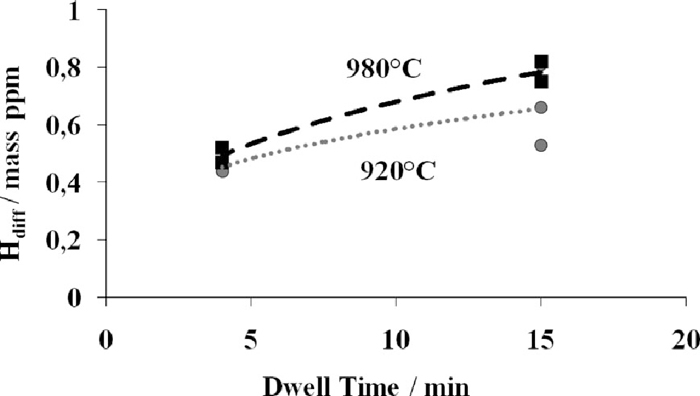
Figure 7 presents the influence of the soaking time at the austenite temperature as a function of the dew point at 920°C. The holding time in the furnace is 5 minutes or 30 minutes. There is a clear synergetic effect between the holding time and the dew point: at low dew point, –15°C, the diffusible hydrogen content is no more varying with the holding time as it is observed for higher dew points. The obtained values are an average of three measurements. Linear regressions, as presented in Fig. 7, are derived from the experimental results for each soaking time at austenite temperature and for dew points increasing from –15°C to 19°C. The linear regressions method is used to calculate the diffusible hydrogen content as a function of the time and the dew point during austenitizing. Finally, the evolution of the diffusible hydrogen contents as a function of the time for two austenite temperatures is presented in Fig. 8. Performing the tests at higher austenite temperature induces higher hydrogen content; however the influence of time is similar for both curves.
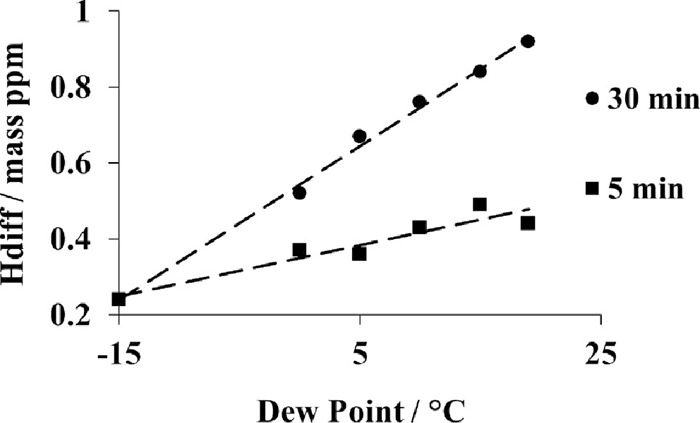
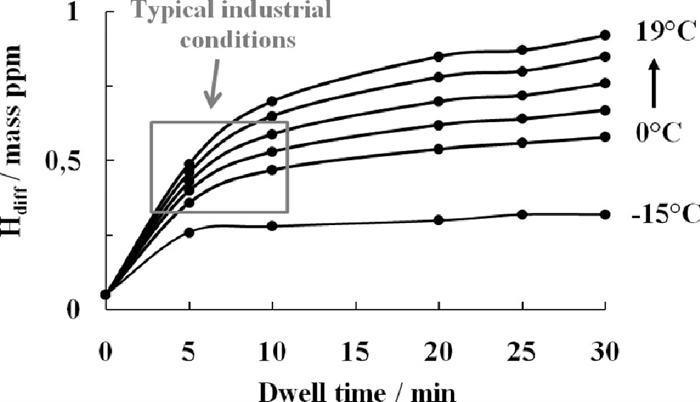
Figure 9 summarises the evolution of the diffusible hydrogen content as a function of the dew point for holding times varying from 5 minutes to 30 minutes. During the first few minutes, a rapid absorption of hydrogen occurs. The decrease in the curve slope after 10 minutes means that the dew point has stronger influence then the holding time on the level of diffusible hydrogen content. The grey square on the figure presents the typical industrial conditions during austenitizing. It indicates that typically diffusible hydrogen level of around 0.3 ppm to 0.6 ppm can be present inside steel during industrial operation.
4.2. Promotion of Degassing
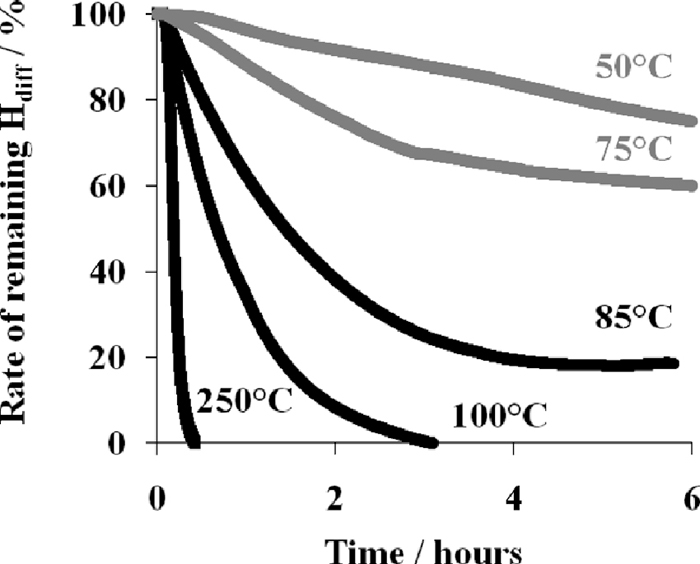
The remaining hydrogen as a function of the temperature and the holding time is presented in Fig. 10. For lower temperatures, 50°C and 75°C, the degassing kinetics is quite slow and less than 40% of the initial hydrogen is desorbed after six hours. In contrast, as the temperature increases, a fast degassing occurs and, above 100°C, a complete degassing can be reached after 3 hours.
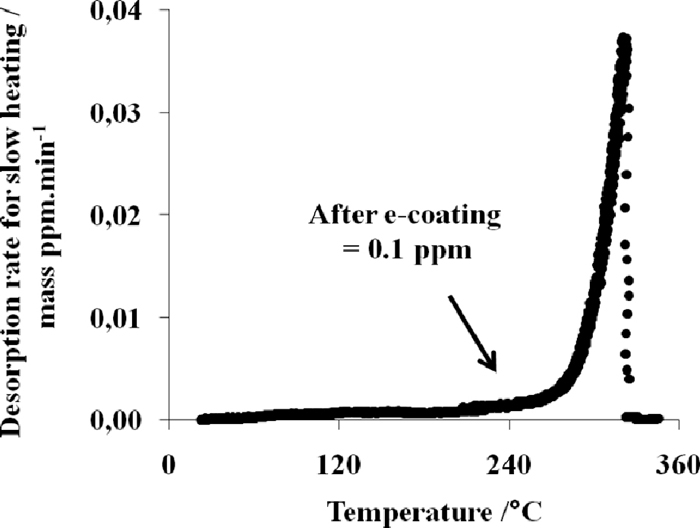
For industrial parts, holding times below 30 minutes at temperatures above 100°C, are of primary interest for the present study as they correspond to the thermal cycles used by the customers for paint baking process involving the e-coating, the sealer and the top coat. Figure 11 shows that above 150°C, almost full degassing is expected between 20 and 30 minutes. Figures 12 and 13 show that the results are fully consistent with the curves presented in Figs. 10 and 11. The hydrogen content has been greatly reduced on the e-coated sample as the measured residual amount is below 0.1 ppm as showed in Fig. 12.

The hydrogen content corresponds to the integration of the first peak until 250°C for a slow heating rate is used. The increase of the hydrogen signal after 250°C is not considered because the increase of the hydrogen signal after 250°C is conjectured to be due to the paint decomposition. A similar value of 0.10 ppm is measured on the baked sample without e-coating. This proves that the thermal cycle is efficient for degassing the hydrogen introduced during the hot stamping process and that the e-coating does not play a barrier role against hydrogen escape.
4.3. Mechanical Tests
Table 4 summarizes the adopted process conditions to prepare the samples, the obtained amounts of hydrogen and the typical measured mechanical properties. For the four samples produced with cold water quenching, the measured diffusible hydrogen levels vary in between 0.1 to 0.7 ppm, whereas, for the two samples quenched by hot water, values ranging between of 0.6 and 0.7 ppm are obtained. For all samples, the yielding is continuous. It is important to note that the cooling rate has no impact on the hydrogen uptake; it only influences the final microstructure and, therefore, its sensitivity to delayed fracture.
Table 4. Austenitizing and cooling conditions applied to mechanically tested samples.
| Thickness (mm) | Cooling rate | Dew point/Austenitizing conditions | Obtained diffusible hydrogen contents (ppm) | Typical mechanical properties (tensile direction) ISO specimens W20 X L80 YS (MPa) -TS (MPa) TE (%) |
|---|
| 1.5 | >100°C/s | –20°C/4 min at 920°C | 0.1 | 1130 – 1590 – 4.3 |
| 0°C/4 min at 920°C | 0.4 | 1125 – 1585 – 4.4 |
| +20°C/ 4 min at 980°C | 0.6 | 1140 – 1595 – 4.2 |
| +20°C/15 min at 980°C | 0.7 | 1135 – 1590 – 4.3 |
| ~65°C/s | +20°C/4 min at 980°C | 0.6 | 1065 – 1495 – 5.2 |
| +20°C/15 min at 980°C | 0.7 | 1055 – 1485 – 5.4 |
Delayed fracture curves on the materials for each hydrogen level are determined, i.e. the time to rupture as a function of applied stress is expressed in relation to the Yield Strength. As mentioned previously, three parameters influencing delayed fracture sensitivity are tested: the initial diffusible hydrogen content, the cooling rate inducing microstructure changes and the state of the edges.
4.3.1. Effect of the Diffusible Hydrogen Content
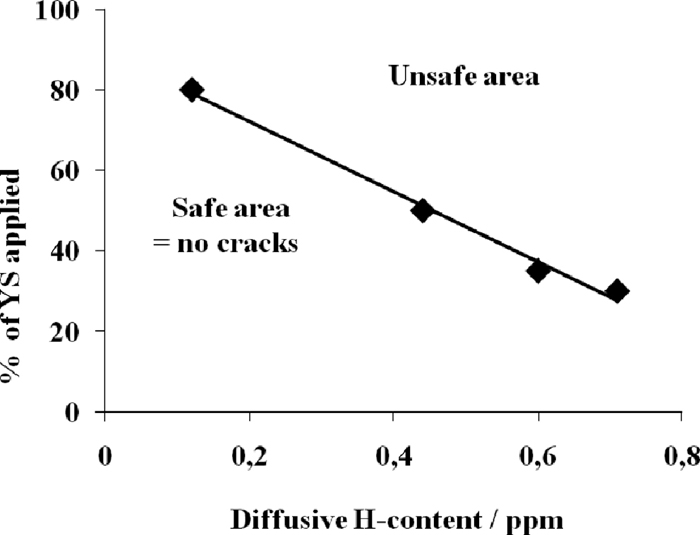
The effect of the diffusible hydrogen content on delayed fracture curves is presented in Fig. 14. The material is quenched in cold water and the edges are sheared. The stress necessary to induce cracking increases when the diffusible hydrogen content decreases from 0.7 ppm to 0.1 ppm. The result establishes that for very low levels of diffusible hydrogen, e.g. 0.1 ppm, it is difficult to induce crack as the crack initiation requires a stress value of around 85–90% of the Yield Strength. Figure 15 is plotted from these minimal stresses inducing the crack. A delayed fracture map as a function of the diffusible hydrogen content is then obtained. As already explained, each dot signifies the minimum stress level necessary to initiate the cracks.
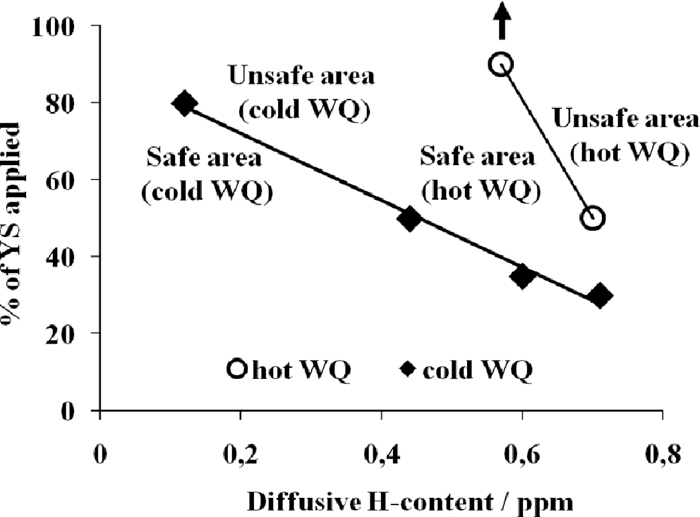
4.3.2. Effect of Cooling Rate
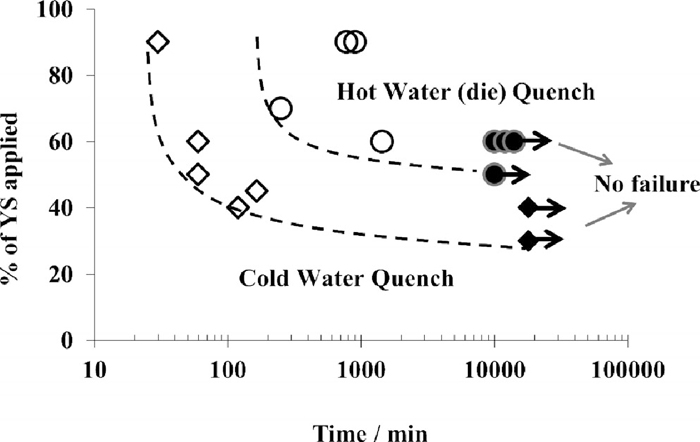
Figure 16 shows the effect of cooling rate on delayed fracture. For these tests, samples having diffusible hydrogen content of 0.7 ppm and sheared edges are used. Delayed fracture for the cold water quenched samples occurs at a lower applied stress as compared to the stress required for the hot water quenched samples. In addition, the kinetics of the fracture is faster for the cold water quenched samples. Delayed fracture maps for sheared edges as a function of the cooling rate are displayed on Fig. 17. As can be seen from the figure, for the cold water quenched materials with lower hydrogen levels around 0.1 ppm, a maximal loading of 90% of the yield strength is necessary to initiate the mechanism. The same load can initiate fracture mechanism on the hot water quenched sample when the diffusible hydrogen content is higher than 0.55 ppm. In summary, for the die quenched material, the most severe condition implies a combination of sheared edge and hydrogen content of 0.7 ppm, that triggers delayed fracture mechanism.
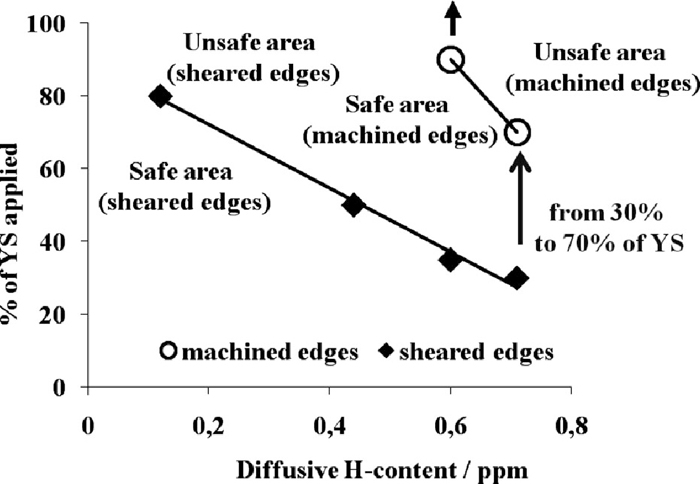
The impact of the edge nature, i.e. sheared against machined is also evaluated. Delayed fracture curves for the cold water quenched samples containing 0.7 ppm of diffusible hydrogen are presented in Fig. 18. Sheared edge samples are clearly more sensitive to delayed fracture as the stress level necessary to promote cracks is much lower than the machined edge specimens. The influence of the nature of the edges on delayed fracture maps is summarized in Fig. 19. For machined edges, a high hydrogen level, 0.7 ppm, is required to trigger fracture mechanism. It is important to note that, in this case, some cracks initiate at the centre of the specimen.
4.3.4. Effect of e-coating
Comparative bending tests are carried out on highly charged material, first in its as-delivered state having a hydrogen content of around 0.8 ppm and then after e-coating, with a hydrogen content of around 0.1 ppm. The most detrimental test conditions are applied involving cold water quenching on the samples having sheared edges, to promote delayed fracture. Mechanical properties before and after the e-coating are presented in Table 5. The table shows that after e-coating, a slight increase of yield strength and a decrease of tensile strength is noticed. This is possibly due to a tempering effect on the as-quenched microstructure during the baking operation.
Table 5. Effect of e-coating on the mechanical properties. The width of the specimens is 40 mm and the length is 110 mm.
| Material | YS (MPa) | TS (MPa) | TE (%) |
|---|
| As quenched | 1185 | 1670 | 7.8 |
| After e-coating | 1215 | 1515 | 8.9 |
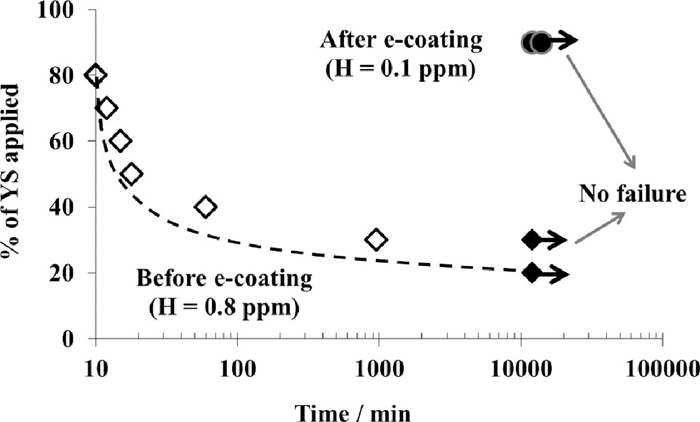
On the as-delivered material, the failure occurs when the applied stress level is around 30% of the yield stress. On the contrary, even when the applied stress level is around 90% of the yield strength, no failure is observed on the e-coated samples (Fig. 20). The result shown in Fig. 20 is in agreement with Fig. 14, which presents the behavior of the water quenched materials having sheared edges and hydrogen content of 0.1 or 0.7 ppm. It is also observed that for a diffusible hydrogen content of 0.1 ppm, the e-coated samples exhibit slightly better response to delayed fracture as compared to their counterpart, the non e-coated specimens. The e-coated material presents absolutely no cracks, whereas, the as-quenched samples without e-coating produce results which are slightly inferior. This difference is probably due to the better resistance of the microstructure after the tempering that occurs during the e-coating process.
5. Discussion
5.1. Hydrogen Absorption Mechanisms
With no gaseous hydrogen in the furnace atmosphere, no hydrogen pick-up by the steel is expected. However, in the present situation, water vapor present in the furnace atmosphere is adsorbed at the surface of the material. The effect of the dew point on the diffusible hydrogen is clearly demonstrated in Figs. 7 and 9 indicating that different equilibrium points are reached for each dew point. Adsorbed water vapor molecules reach equilibrium with adsorbed oxygen and hydrogen by dissociation on the steel surface. Oxygen produced from that dissociation is responsible for the surface oxidation while most of the hydrogen atoms recombine into molecular gaseous H2, which escapes into the furnace atmosphere. Aluminium based coating, by promoting oxidation, enhances the reaction. Nature of oxides greatly influence the hydrogen absorption as already mentioned by Bruzzoni et al.,23) Hirohata et al.24) or Raiteri et al.25)
A part of the adsorbed hydrogen is able to dissolve into the austenite lattice at high temperature. This phenomenon is amplified at higher temperatures because the hydrogen solubility in austenite increases with temperature. An increase of about 10% of hydrogen amount is noticed when the operating temperature is raised from 920°C to 980°C, without change of the dew point.
This indicates that all three parameters can influence the hydrogen pick-up: the dew point of the furnace atmosphere defining the amount of hydrogen able to enter into the steel, the austenite test temperature and the dwell time defining the amount of hydrogen that the austenite is able to dissolve, see Figs. 7 and 9. Moreover, it seems that a synergetic effect takes place between the holding time and the dew point. At low dew point, e.g. at –15°C, the hydrogen pick up saturates rapidly after 5 minutes, whereas no such saturation is observed for higher dew points, typically from 0°C to 19°C. In fact, the slope of the curves that relates the hydrogen content to the dwell time increases gradually with increasing dew point value as shown in Fig. 7. In extreme conditions, such as at dew point value of +20°C, the hydrogen content is almost doubled with increasing the dwell time from 5 to 30 minutes. Therefore, it is of prime interest to control this parameter in order to minimize delayed fracture risk.
During cooling, the hydrogen steel solubility decreases and the steel gets over saturated in hydrogen. Hydrogen tries to diffuse toward the steel surface but its desorption is limited by the rapid cooling. At room temperature, the coating acts as a physical barrier to hydrogen escape.
5.2. Promotion of Degassing
After the cooling process, the steel is over-saturated with hydrogen atoms which try to desorb. This mechanism is very slow at room temperature (process kinetics controlled by diffusion) and is accelerated at higher temperatures. However, a change of behavior is observed between 75°C and 100°C. This change is probably due to the varying hydrogen diffusion coefficient in Al–Si coating with temperature. At temperature close to 85°C or higher, the H diffusion rate through the coating is expected to become similar or faster to the one through the steel. Therefore, degassing through the coated faces becomes higher than degassing through the bare edges. This explains why the baking treatment is efficient to degas the samples.
This proposition can be verified as presented below. The diffusion Eq. (2) can be used to determine the hydrogen concentration as a function of time and position through thickness
|
∂
C
H
(x,t)
∂t
=D
∂
2
C
H
(x,t)
∂
x
2
| (2) |
considering the following initial condition (
Eq. (3)):
The following boundary conditions are adopted:
- the concentration is equal to zero at the sample surfaces:
- for symmetry reason, the hydrogen flow is zero at the middle of the sample (the same amount of H atoms diffusing to the left and to the right)
The solution of that problem, using the Laplace transformation solving method, can be expressed as:
|
C
H
(x,t)=
C
0
-
C
0
(
∑
n=0
∞
(-1)
n
(
erfc(
(2n+1) e+x
2
Dt
)
+erfc(
(2n+1) e-x
2
Dt
)
)
)
| (4) |
Where
C0 is the initial concentration in mol/m³ and
e is half the thickness of the sample (1.05 mm in this case),
x is varying from –
e to +
e.
D represents the apparent diffusion coefficient in m²/sec and is expressed by
|
D(T)=
D
0
exp(
-Q
RT
)
| (5) |
Where the temperature
T is expressed in K,
D0 is the pre-exponential coefficient for diffusion in m²/sec,
Q is the activation energy for diffusion in J/mole and
R is the universal gas constant. It is now possible to calculate the instantaneous flow of hydrogen at the sample surface as
|
J(x=±e,t)=
-D
∂
C
H
(x,t)
∂x
|
x=±e
| (6) |
Incorporating
Eqs. (4) &
(5),
Eq. (6) becomes:
|
J(x=±e,t)=
-
C
0
D
π
t
(
∑
n=0
∞
(-1)
n
(
exp(
-
((n+1) e)
2
Dt
)
-exp(
-
(ne)
2
Dt
)
)
)
| (7) |
which can then be re-written as:
|
J(x=±e,t)=
C
0
D
π
t
(
1+2
∑
n=1
∞
(-1)
n
exp
-
n
2
e
2
Dt
)
| (8) |
As long as
2
Dt
remains smaller than
e, the flow given by
Eq. (6) can be expressed with an error lower than 5% by:
As expected, the hydrogen flow out of the sample is decreasing with the exposure time. During an isothermal holding, the total flow through surface at the temperature
T is
|
ϕ(T)=∫
J(t)dt≈2
C
0
π
Dt
| (10) |
In order to use the data from
Figs. 10 and
11, the rate of remaining hydrogen (%
RRH) is introduced as follows
|
%RRH
100
=
2
C
0
eS-2ϕS
2
C
0
eS
=
C
0
e-ϕ
C
0
e
| (11) |
where, 2
e is the thickness in meter and
S represents the sample surface area expressed in m². This relationship gives the time needed to reach %
RRH for a given temperature. The choice of %
RRH has to be made in order to keep
2
Dt
lower than
e. Using
Eq. (10), the
Eq. (11) gives:
|
2
Dt
e
=
π
(
1-
%RRH
100
)
| (12) |
and the condition
2
Dt
<
e gives
|
%RRH
100
≥1-
1
π
=0,43
| (13) |
In the present article, %
RRH of 80 is selected which corresponds to
Finally, by using
Eqs. (5) and
(10),
Eq. (11) can be expressed as
|
ln(t)=ln(
π
e
2
4
D
0
)
+2ln(
1-
%RRH
100
)
+
Q
R
1
T
| (15) |
As can be seen from
Eq. (14), only two data are unknown,
D0 and
Q. By plotting a graph of ln(
t) as a function of 1/
T for the selected value of %
RRH, the value of
Q can be obtained by considering that
Q is a constant against temperature.
Figure 21 presents such a graph for a %
RRH of 80%. A clear change from linearity can be observed in
Fig. 21. At low temperature, diffusion through the coating is much lower than the diffusion through the steel. With an increase in temperature, the diffusion through the coating increases and it becomes equal to the diffusion through the steel at 110°C. Above 110°C, the diffusion in the steel becomes rate controlling for degassing process as it is much slower that the diffusion through the coating.

The values of Q and D0, obtained at high temperatures and at low temperatures, have been used to calculate an apparent diffusion coefficient at room temperature in both cases. The value of D is derived from the data obtained at high temperature in the present study and is presented in Table 6. The value is very similar to the one calculated by Georges et al. after long isothermal holding at room temperature for AlSi coated 22MnB5 samples with cut edges.19) In this research work, the diffusible hydrogen only escapes through cut edges as the AlSi coating acts as a barrier to the hydrogen diffusion at room temperature. Therefore, the obtained diffusion coefficient corresponds to an apparent diffusion through the steel. The lower value of the apparent diffusion coefficient obtained during sample soaking below 110°C is logical as the AlSi coating slows down the hydrogen diffusion through the coated surfaces.
Table 6. Apparent diffusion coefficient at room temperature calculated for a %RRH of 80%.
| Obtention temperature of D0 and Q | Type of diffusion | Apparent diffusion coefficient D calculated at room temperature (m²/sec) | Reference |
|---|
| T<110°C | Diffusion governed by the AlSi coating | 1.8E-13 | This study |
| T>110°C | Diffusion governed by the substrate | 5.5E-11 | This study |
| Room temperature | Diffusion governed by the substrate | 4.5E-11 | Georges et al.19) |
Cracks appear faster for the sheared edge samples than for the machined edge samples. As compared to the machined edges, the sheared edges employ mechanical cutting process. This process increases the severity of the test by promoting areas which play a role of notch26) and probably facilitate comparatively higher hydrogen concentration.6,27) For the process involving standard die quenching or hot water quenching having cut edges, the mechanism of delayed fracture does not start when the diffusible hydrogen amount is less than 0.7 ppm. This criterion proposes an extreme hot stamping condition i.e. a very high dew point close to 20°C and a soaking time of higher than 10 minutes. Therefore, considering a standard processing conditions, no crack initiation is expected on a cut edge even if it is loaded in bending to its maximal elastic level.
The present study reveals that the water quenching process, 100°C/s of cooling rate, which is not a standard operating procedure, is highly sensitive to delayed fracture. On the water quenched samples, the cracks may initiate from a cut edge even with 0.1 ppm of diffusible hydrogen. This high level of sensitivity is probably due to the final microstructure obtained as a result of very high cooling rate. After water quenching, no tempered martensite is observed and the mechanical properties are significantly high that lowers critical level of diffusible hydrogen8) to initiate the crack. However, it is worth noting that this is only a potential risk before e-coating as according to the present research the baking treatment at 170°C associated with the e-coating process reduces the hydrogen content, in our experiment from 0.8 to 0.1 ppm, and tempers the as quenched microstructure. As a consequence, no delayed fracture risk is expected during bending after e-coating even with the presence of the most detrimental parameters: water quenching, cut edge and initial high hydrogen content.
6. Conclusion
The factors governing absorption and desorption of diffusible hydrogen in an aluminized boron steel have been evaluated. It is demonstrated that the dew point and the austenitizing time are the key parameters to control the hydrogen absorption. The austenitizing temperature has comparatively smaller effect on the hydrogen uptake. In the typical industrial production conditions, 0.35 to 0.60 ppm of diffusible hydrogen could be introduced in the microstructure. It is also shown that a post heat treatment can reduce rapidly the initial hydrogen content. This treatment must be carried out at a temperature where the diffusion is mainly governed by the steel and not by the coating which rather acts as a barrier to hydrogen diffusion below this temperature. According to the present study, the value of this critical temperature is 110°C.
The sensitivity of the material to delayed fracture is also quantified for three parameters: the diffusible hydrogen content, the cooling rate and the edges state. Cold water quenched materials are more sensitive to delayed fracture than the die or hot water quenched ones. This is probably due to the decrease of auto-tempered martensite volume fraction which is less sensitive to delayed fracture than the fresh martensite. For die quenched materials, which represent the products obtained after industrial processing, hydrogen content needs to be higher than 0.6 ppm to trigger delayed fracture when the material is bended at its maximal elastic level on mechanically cut edge, i.e. employing the most detrimental test conditions. Moreover, it is shown that the e-coating process greatly increases the safety margin as most of the initial diffusible hydrogen is degassed during the baking treatment.
To summarize, for a standard hot stamping conditions involving classical or mechanical cutting, the risk of hydrogen embrittlement is already very weak. Comparatively sophisticated mode of cutting, like laser or water jet, is expected to provide an additional margin in the acceptable hydrogen level; however the value is not determined in the present study. Finally, it can be concluded that in the range of the parameters investigated in the present study, baking treatment during the e-coating process completely remove the embrittlement risk.
References
- 1) P. Hein and J. Wilsius: Steel Res. Int., 79 (2008), 85.
- 2) M. Suehiro, K. Kusumi, T. Miyakoshi, J. Maki and M. Ohgami: Nippon Steel Tech. Rep., 88 (2003), 16.
- 3) M. Nagumo: ISIJ Int., 41 (2001), 590.
- 4) L. Duprez, K. Verbeken and M. Verhaege: Proc. of the 2008 Int. Hydrogen Conf., ed. by B. Somerday, P. Sofronis and R. Jones, ASM International, Materials Park, OH, (2008), 62.
- 5) D. Hardie and S. Liu: Corros. Sci., 38 (1996), 721.
- 6) Y. Toji, S. Takagi, M. Yoshino, K. Hasegawa and Y. Tanaka: Mater. Sci. Forum, 638–642 (2010), 3537.
- 7) J. S. Kim, Y. H. Lee, D. L. Lee, K.-T. Park and C. S. Lee: Mater. Sci. Eng. A, 505 (2009), 105.
- 8) J. L. Gu, K. D. Chang, H. S. Fang and B. Z. Bai: ISIJ Int., 42 (2002), 1560.
- 9) R. G. Thiessen, T. Heller, K. Mraczek, A. Nitscke and A. Pichler: Proc. of the 2011 Int. Steely Hydrogen Conf., ed. by L. Duprez, OCAS, Zelzate, Belgium, (2011), 43.
- 10) T. Hojo, K.-I Sugimoto, Y. Mukai and S. Ikeda: ISIJ Int., 48 (2008), 824.
- 11) H. E. Townsend: Metall. Trans., 6A (1975), 877.
- 12) M. J. Carr and M. J. Robinson: Trans. I.M.F., 73 (1995), 58.
- 13) M. Nagumo, M. Nakamura and K. Takai: Metall. Mater. Trans., 32A (2001), 339.
- 14) J. Kim, Y. Lee, D. Lee, K. Park and C. Lee: Mater. Sci. Eng., A505 (2009), 105.
- 15) S. Lee and J. Lee: Surf. Coat. Tech., 28 (1986), 301.
- 16) R. Takai and R. Watanuki: ISIJ Int., 43 (2003), 520.
- 17) C. Georges and T. Sturel: Proc. of the 2008 Int. Hydrogen Conf., ed. by B. Somerday, P. Sofronis and R. Jones, ASM International, Materials Park, OH, (2008), 493.
- 18) C. Georges and X. Vanden Eynde: Proc. of the 8th Int. Conf. on Zinc and Zinc Alloy Coated Steel Sheet - GALVATECH 2011, AIM, Milano, Italy, (2011).
- 19) C. Georges, T. Machado, P. Drillet, T. Sturel and T. Vietoris: Proc of the Int. Steely Hydrogen Conf., ed. by L. Duprez, OCAS, Zelzate, Belgium, (2011), 77.
- 20) Patent usibor FR9808793.
- 21) R. Grigorieva, P. Drillet, J.-M. Mataigne and P. Barges: Proc. of the 8th Int. Conf. on Zinc and Zinc Alloy Coated Steel Sheet - GALVATECH 2011, AIM, Milano, Italy, (2011).
- 22) Standard Practice for Preparation and Use of Bent-beam Stress Corrosion Test Specimens, ASTM standard G39-99, ASTM International, West Conshohocken, PA, (2005).
- 23) P. Bruzzoni and R. Garavaglia: Corros. Sci., 33 (1992), 1797.
- 24) Y. Hirohata, D. Motojima, T. Hino and S. Sengoku: J. Nucl. Mater., 313–316 (2003), 172.
- 25) G. Raiteri and A. Calcatelli: Vacuum, 62 (2001), 7.
- 26) K. Hasegawa, K. Kawamura, T. Urabe and Y. Hosoya: ISIJ Int., 44 (2004), 603.
- 27) M. Wang, E. Akiyama and K. Tsuzaki: Scr. Mater., 53 (2005), 713.