Abstract
As a fundamental study for clarifying the reduction phenomena of sintered ore in a blast furnace, mixtures of iron oxide and quaternary calcium ferrite (Cf) were prepared and its kinetic behavior at the final stage of reduction with CO gas was studied. Reduction rate increased with increasing reduction temperature regardless of mineral ratio. Influence of mineral ratio were small and reduction rate were similar in every sample at 1000°C and above. While at 900°C and below, reduction rate increased with increaseng amount of Cf. The reason thought to be due to that the dense iron layer on surface of iron oxide particle inhibits the reduction at inner phase. Reduction reaction proceeded topochemically at higher temperature. On the other hand, reduction reaction did not proceed topochemically at lower temperature. Besides reduction reaction of rich Cf samples proceeded topochemically. Reduction data were analyzed based on the two interface unreacted core model, effective diffusion coefficient in outer layer and inner layer were determined. Reduction curves calculated by using the rate parameters obtained by the analysis agreed with observed data very well at 1000°C and above. Therefore reduction rate of two minerals mixture sample can be analyzed based on the two interface unreacted core model above 1000°C.
1. Introduction
Reduction behavior of self-fluxing iron ore sinter is important for clarifying the reaction behavior in blast furnace because iron ore sinter is a main source of iron. Many experiments for iron ore sinter that produced in sinter plants or pods were carried out to clarify the reduction behavior. However, iron ore sinter has various mineral phases such as iron oxide, calcium ferrite, slag. Therefore structure of iron ore sinter is very complex. Analysis of simulated iron ore sinter that has simplified structure is required for the quantitative analysis of reduction rate of iron ore sinter. In particular, clarifying the reducibility of iron oxide and calcium ferrite is most important for understanding the reducibility of iron ore sinter in blast furnace.
In previous paper,1) reduction rate analysis at final stage of reduction of single mineral phase sample that made from iron oxide or quaternary calcium ferrite was reported. Iron ore sinter has various mineral phases, therefore, kinetic analysis for many mineral phases sample were required. However, previous studies analyzed iron ore sinter as single mineral phase sample.2) Thus in this study, dual mineral phase samples that made from both iron oxide and quaternary calcium ferrite were prepared, and relationship between reduction rate at final stage of reduction and mineral composition of the samples was investigated. Additionally, the reduction rate was analyzed the results based on new two interface unreacted core model that was developed in this paper, and the suitability of this model for dual mineral phase sample was discussed.
2. Experiments
2.1. Samples
Dual mineral phase sample was composed of iron oxide (H) and quaternary calcium ferrite (Cf). Reagent grade powder of Fe2O3 was used as iron oxide. Quaternary calcium ferrite was synthesized as follows.
Quaternary calcium ferrite was prepared from reagent grade powders of Fe2O3, CaCO3, SiO2 and Al2O3. The powders were mixed to be the composition as shown in Table 1. The mixed powder was fired at 1000°C for 1h in the air and was followed by crushing and mixing. The operation of firing, crushing and mixing was repeated three times. The powder was put into a magnesia crucible (3 cmϕ × 10 cm) and it was then heated up to 1300°C at the rate of 0.17 K/s (10°C/min) using a silicon carbide resistance furnace. After being kept for 0.5 h at 1300°C, the synthesized sample was cooled down to 1100°C at the rate of 0.33 K/s (20°C/min) and was finally quenched in water.
Table 1. Chemical composition of calcium ferrite sample as mixed (mass%).
| Fe2O3 | CaO | SiO2 | Al2O3 |
|---|
| 65.0 | 23.3 | 7.8 | 3.9 |
Iron oxide and calcium ferrite in particle size range of 45–75 μm were mixed in reducible oxygen ratio of 80:20, 60:40 and 40:60 (weight ratio of iron oxide and calcium ferrite is 72.2:27.8, 49.6:50.4 and 30.4:69.6). Table 2 shows mixture ratio of samples. About 2.3 g of the mixed powder was weighed out and compacted into a briquette of about 1 cmϕ × 1 cm. The briquette was used for the reduction experiment without sintering. The porosity of samples was 26–30%, which was calculated from the apparent and true density of each mineral.
Table 2. Mixture ratio of samples (oxygen%).
| hematite | calcium ferrite |
|---|
| sample 1 | 80 | 20 |
| sample 2 | 60 | 40 |
| sample 3 | 40 | 60 |
Reduction experiments were carried out at 800, 900, 1000 and 1100°C using a thermal balance. It was heated up to each experiment temperature in N2 gas stream. Then, a sample was hung on the thermal balance under N2 atmosphere. At first, the sample was reduced to wustite with 50%CO–50%CO2 gas mixture. Next, the sample was reduced to iron with CO gas. Gas flow rates were 3.33 × 10⁻⁵ Nm3/s (2 NL/min) in all experiments so that reductions were not controlled by gas supply.3)
3. Results
3.1. Reduction Curves
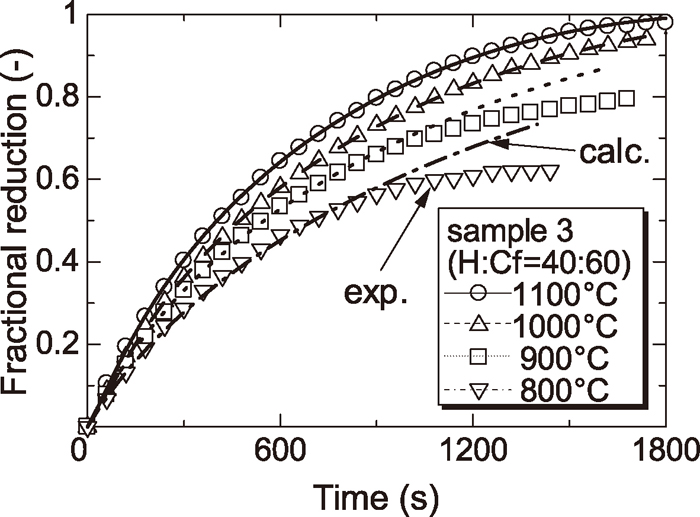
Figures 1, 2 and 3 show the reduction curves of samples 1, 2 and 3 at each temperature respectively. From these figures, it was found that reduction rate of each sample was increased with increasing reduction temperature.

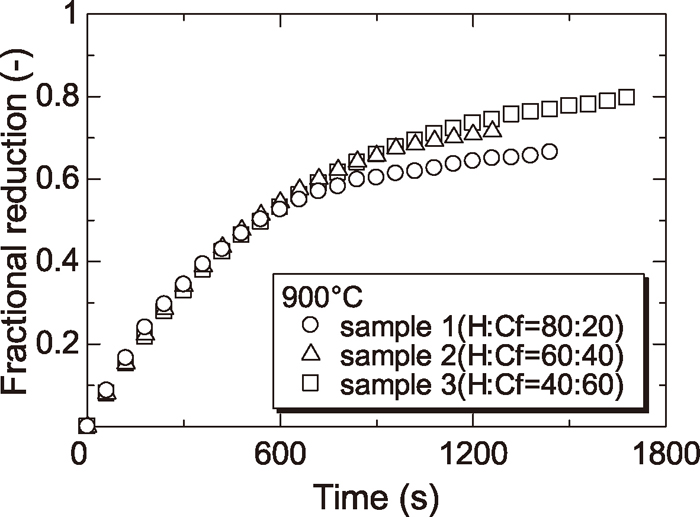
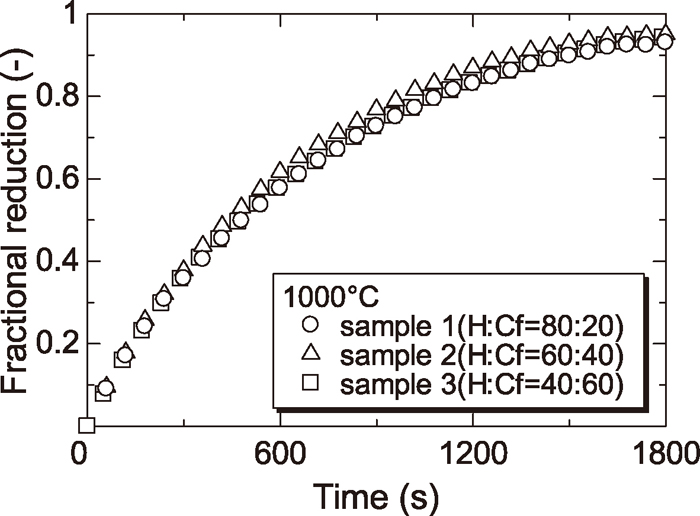
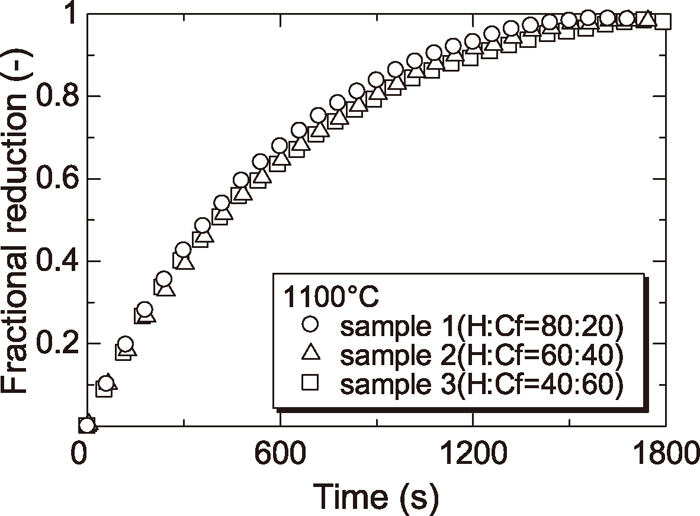
Figures 4, 5, 6 and 7 show the reduction curves of each sample reduced at 800, 900, 1000 and 1100°C respectively. From these figures, it was found that the reduction rate above 1000°C was almost the same regardless of the amount of Cf and the reduction rate at later stage of reduction below 900°C was increased with increasing the amount of Cf. As described §3.2, the reduction rate of wustite particle derived from H was slowed at low temperature because the diffusion of CO gas to wustite surface was prevented by dense iron layer surrounding wustite particle derived from H. By contrast, the reduction rate of wustite derived from Cf was not slowed because the diffusion of CO gas to wustite surface was not prevented since the reduced iron layer derived from Cf was not dense. For this reason, reduction rate at later step became small in case of sample containing a small amount of Cf at low temperature.
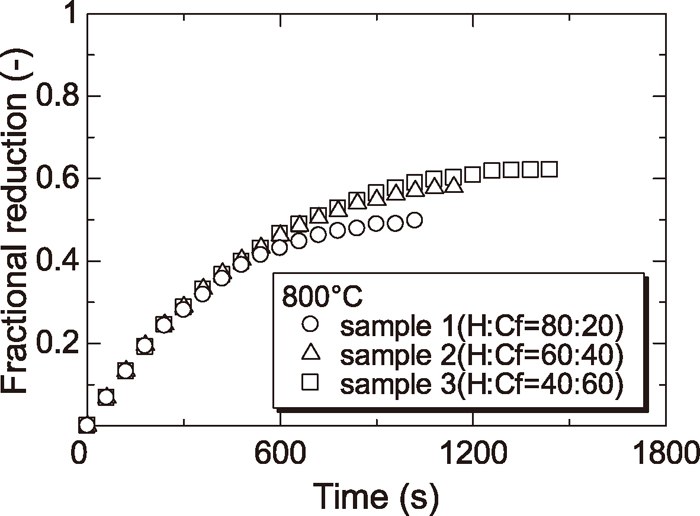
In addition, the effect of the mixture ratio of mineral phase on the reduction rate was smaller than that of the temperature. However, the effect of the mixture ratio of mineral phase on the reduction rate was not negligible at lower temperature (<900°C).
3.2. Macro and Microscopic Observations of Partially Reduced Samples
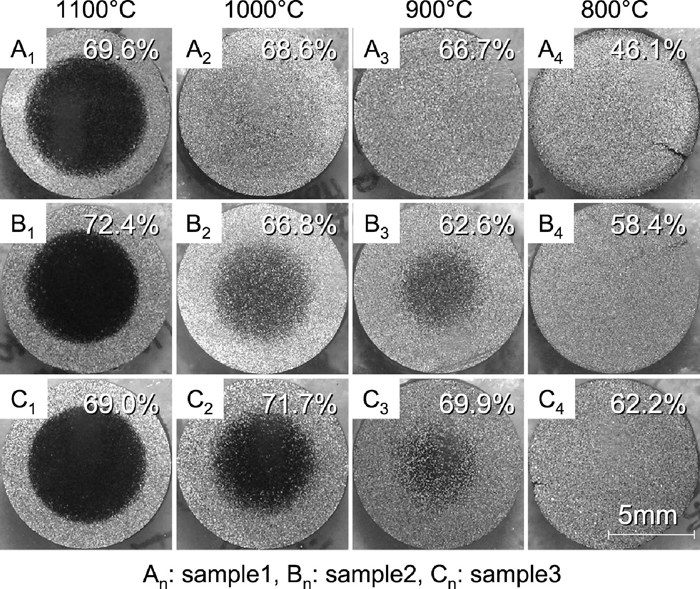
Macroscopic observations were performed by using the partially reduced samples which was prepared by interrupting the reduction at about 70% reduction degree. Figure 8 shows the cross-sectional view of each sample at each temperature. Percentages in this figure represent reduction degree of each sample.
In case of reduction at 1100°C, it was found that the reduction of each sample proceeded topochemically because the boundary between surface layer and unreacted core was clear. By contrast, the boundary of each sample at lower temperature (<1000°C) was not clear. In particular at 800°C, it is considered that the reduction reaction proceeded uniformly because unreacted core was not confirmed.
Additionally, boundary of sample containing smaller amount of Cf was less sharp and unreacted core of sample containing lowest amount of Cf (sample 1) was not confirmed at 900°C.
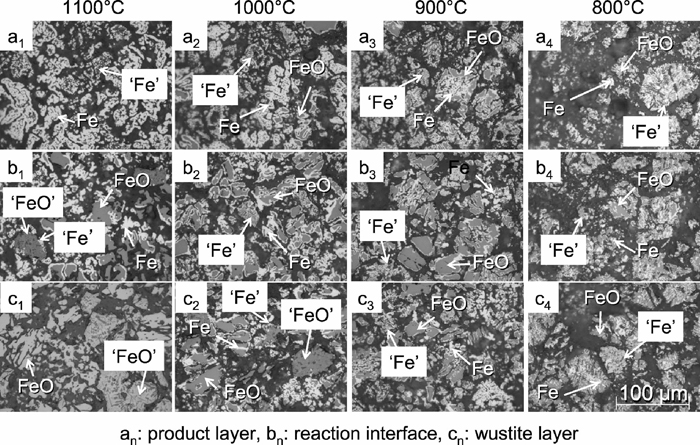
Figure 9 shows the microstructure of partially reduced sample 1 at 800, 900, 1000 and 1100°C. In this figure, an, bn and cn show the microstructure at surface layer, at the reaction interface and at the center of sample respectively. In this figure, FeO and Fe show wustite and iron derived from H respectively, and ‘FeO’ and ‘Fe’ are wustite and iron derived from Cf respectively. Additionally, Fig. 10 shows particles reduced at 900°C derived from H and Cf respectively.
At 1100°C, most particles in surface layer had become reduced iron. These in unreacted core was unreduced wustite. On the other hand, below 1000°C, partially reduced wustite particles were observed in both the surface and core layer . In addition, the amount of unreduced wustite in surface layer and reduced iron in the unreacted core tended to increase with decreasing temperature. The same tendency was observed in sample 2 and 3.
From the microscopic observation of particles derived from H (left particle shown in Fig. 10), there were many particles of which reduced iron existed at the surface and unreduced wustite existed inside. The reduced iron layer on the surface of the particle became thinner with lower temperature, and many such particles were observed in the center of the sample reduced at low temperature. It is considered that diffusion of reducing gas in the particle is prevented by the iron layer because dense iron layer is formed at surface of the particle. When the iron layer covers the particles, it is considered that reduction rate of samples is controlled by the oxygen diffusion through the dense iron layer. The oxygen diffusion through the dense iron layer becomes slow at low temperature particularly. For this reason, reduction rate at later step became small at low temperature.
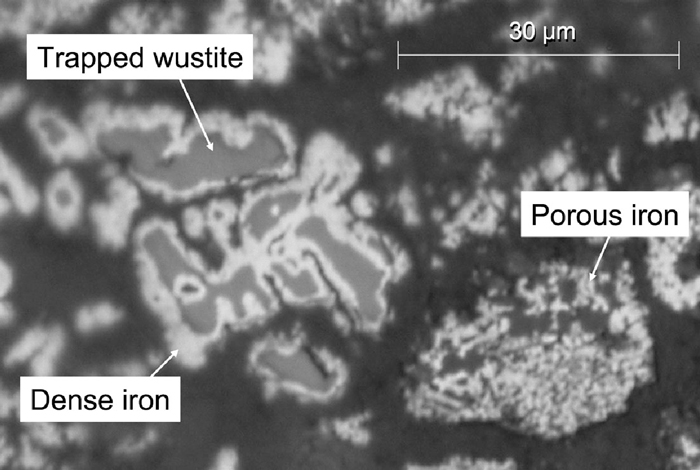
From the microscopic obsevation of particles derived from Cf (right particle shown in Fig. 10), there was no particle covered with dense iron layer differently from H particles. Reduced iron was porous because slag phase was precipitated during reduction of Cf. Thus, it is not considered that the reduction rate of sample is controlled by the oxygen diffusion through the dense iron layer.
For these reasons, it is considered that the reduction rate at later of reduction decreases with increasing the amount of H in sample. This consideration agrees with the experimental results (Figs. 4,5,6,7).
4. Analysis Based on Two Interface Unreacted Core Model
4.1. Procedure of Analysis
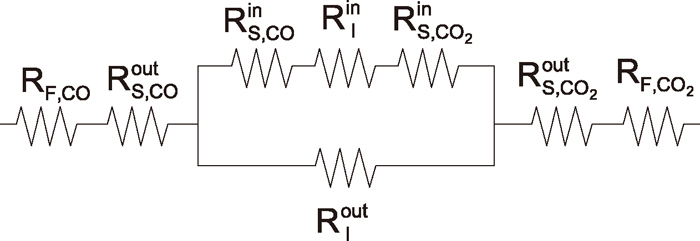
In order to conduct the reduction rate analysis more accurately, two interface unreacted core model based on three interface model of Spitzer et al.4) was developed. Figure 11 shows the schematic view of the unreacted core model with two reaction interfaces. Figure 12 shows equivalent electric circuit of this model. In this model, as shown in Fig. 11, the chemical reactions are assumed to take place topochemically at two interfaces: (AO+BO)/(A+BO or AO+B) and (A+BO or AO+B)/(A+B). Besides these chemical reaction processes, masstransfer in the gas film and gaseous diffusion in each product layer (A+B, A+BO or AO+B) are also taken into account in the analysis.
• Reductions from AO to A or from BO to B proceed as one interface respectively. Intermediate layer are not produced.
• Each reaction proceeds topochemically and independently. These reaction interfaces can be replaced each other.
• The reaction area depends on the amount of oxide concerned with reduction at reaction interface.
• The overall reduction degree is the sum of what multiplied the reduction degree of each oxide by each existence ratio.
• Total pressure is 1 atm at every place.
The rate of each elementary step is expressed as follows.
1) Mass transfer in the gas film
|
n
˙
F
=
1
R
F
(
P
CO
b
-
P
CO
0
)
| (1) |
2) Diffusion process in the (A+B) layer
|
n
˙
S
(A+B)
=
1
R
S
(A+B)
(
P
CO
0
-
P
CO
(A+B)
)
| (2) |
|
R
S
(A+B)
=
RT
D
e
out
(
r
0
-
X
i
(A+B)
)
4π
r
0
X
i
(A+B)
|
3) Diffusion process in the (A+BO) layer
|
n
˙
S
(A+BO)
=
1
R
S
(A+BO)
(
P
CO
(A+B)
-
P
CO
(A+BO)
)
| (3) |
|
R
S
(A+BO)
=
RT
D
e
in
(
X
i
(A+B)
-
X
i
(A+BO)
)
4π
X
i
(A+B)
X
i
(A+BO)
|
4) Diffusion process in the (AO+B) layer
|
n
˙
S
(AO+B)
=
1
R
S
(AO+B)
(
P
CO
(A+B)
-
P
CO
(AO+B)
)
| (4) |
|
R
S
(AO+B)
=
RT
D
e
in
(
X
i
(A+B)
-
X
i
(AO+B)
)
4π
X
i
(A+B)
X
i
(AO+B)
|
5) Chemical reaction process at the reaction interfaces
|
n
˙
I
(t)
=
1
R
I
(t)
(
P
CO
(t)
-
P
CO,e
(t)
)
| (5) |
|
R
I
(t)
=
RT
k
c
(s)
4π
(
X
i
(t)
)
2
K
(s)
1+
K
(s)
|
On the other hand,
n
˙
I
(t)
equals the rate of removal of oxygen from oxide s, in reaction from s to t.
|
n
˙
I
(t)
=-4π
(
X
I
(t)
)
2
Ψ
s
(t)
d
O
T
d
X
(t)
dθ
| (6) |
The rate of interface movement is obtained from Eqs. (5) and (6) as follows.
|
d
X
(t)
dθ
=-
k
c
(s)
RT
d
O
T
Ψ
s
(t)
(
1+
1
K
(s)
)
(
P
CO
(t)
-
P
CO,e
(t)
)
| (7) |
From the equivalent electric circuit shown in Fig. 11, overall reduction rate equation of this model is given by the following equation.
|
-
n
˙
=
λ
a
P
CO
b
-
λ
b
K
AO
K
BO
P
C
O
2
b
λ
a
(
R
F,CO
+
R
S,CO
(A+B)
)
+
λ
b
K
AO
K
BO
(
R
F,C
O
2
+
R
S,C
O
2
(A+B)
)
+1
| (8) |
when the reduction of AO is faster than that of BO;
|
(
λ
a
=
1
R
I
(A+B)
+
1
R
S,CO
(A+BO)
+
R
I
(A+BO)
+
R
S,C
O
2
(A+BO)
/
K
AO
λ
b
=
K
AO
R
I
(A+B)
+
K
BO
R
S,CO
(A+BO)
+
R
I
(A+BO)
+
R
S,C
O
2
(A+BO)
/
K
AO
|
when the reduction of BO is faster than that of AO;
|
(
λ
a
=
1
R
I
(A+B)
+
1
R
S,CO
(AO+B)
+
R
I
(AO+B)
+
R
S,C
O
2
(AO+B)
/
K
BO
λ
b
=
K
BO
R
I
(A+B)
+
K
AO
R
S,CO
(AO+B)
+
R
I
(AO+B)
+
R
S,C
O
2
(AO+B)
/
K
BO
|
Assuming that reduction of AO is faster than that of BO, the procedure of calculation is described below.
i) Initial condition of XiAO and XiBO equal r0.
ii) Calculate five resistances, λa and λb.
iii) Calculate overall reduction rate
-
n
˙
from Eq. (8).
iv) Calculate PCO0 from Eq. (1) by using the relation of
-
n
˙
=-
n
˙
F
=-
n
˙
S
(A+B)
.
v) Substitute PCO0 in Eq. (2), then calculate PCO(A+B).
vi) Substitute PCO(A+B) in Eq. (5), then calculate
n
˙
I
(A+B)
.
vii) Calculate
-
n
˙
S
(A+BO)
by using the relation of
-
n
˙
S
(A+B)
=-
n
˙
I
(A+B)
+-
n
˙
S
(A+BO)
.
viii) Substitute
-
n
˙
S
(A+BO)
and PCO(A+B) in Eq. (3), then calculate PCO(A+BO).
ix) Transform Eq. (7) into differential equation, determine the relationship between time θ and interface radius Xi(t) by using the obtained PCO(A+B) and PCO(A+BO).
Steps from ii) to ix) are repeated at every time step. Judging of whether interfaces are replaced is performed in step ii). If interfaces are replaced, the substitute equation is changed sequentially in steps from ii) to ix) and calculated.
If the relative thickness of product layers is determined, the reduction degree of AO and BO is expressed as following equations.
|
F
AO
=1-
(
X
i
(A+BO)
r
0
)
3
| (9) |
|
F
BO
=1-
(
X
i
(A+B)
r
0
)
3
| (10) |
Total reducible oxygen is obtained following Eq. (11).
|
4
3
π
r
0
3
d
O
T
=
4
3
π
r
0
3
d
O
AO
+
4
3
π
r
0
3
d
O
BO
| (11) |
Overall reduction degree of sample is obtained following Eq. (12).
|
F
T
=
F
AO
d
O
AO
+
F
BO
d
O
BO
d
O
T
=
F
AO
ϕ
AO
+
F
BO
ϕ
BO
| (12) |
Following equilibrium constants were applied in this analysis. Equation (13) represents at final stage of reduction of iron oxide and Eq. (14) represents the equilibrium constant of this reaction step.5)
|
FeO (s) + CO (g) = Fe (s) + CO
2
(g)
| (13) |
|
K
H
=
p
C
O
2
,e
H
p
CO,e
H
=exp(
-2.706+
2 289
T
)
| (14) |
On the other hand, Eq. (15) represents reduction at final stage of quaternary calcium ferrite and Eq. (16) represents the equilibrium constant of this reaction step.6,7,8)
|
‘FeO’
(s) + CO (g) = Fe (s) + CO
2
(g)
| (15) |
|
K
Cf
=
p
C
O
2
,e
Cf
p
CO,e
Cf
=exp(
-2.785+
2 042
T
)
| (16) |
It was reported that apparent chemical reaction rate constant of mixed oxide is proportional to oxide ratio.9,10) Chemical reaction rate constant of oxide s in oxide mixture kc(s) is expressed by using chemical reaction constant kc(s)° and existent ratio ϕ(s) of pure oxide s as follows.
|
k
c
(s)
=
k
c
(s)∘
ϕ
(s)
| (19) |
The values of chemical reaction rate constant of pure single mineral phase sample of H and Cf were reported in previous study.1) Therefore, these values were used for calculation in this study.
By the way, in this analysis model, there are three necessary parameters: mass transfer coefficient in the gas film kf, effective diffusion coefficients in the outer layer Deout and in the inner layer Dein. The value of kf was derived using Ranz-Marshall correlation. Thus, curve fitting method was carried out for determining Deout and Dein. Additionally, it is assuming that Deout is larger than Dein because porosity in outer layer is larger than that in inner layer.
Applying unreacted core model was not appropriate at lower temperature because the reduction reaction did not proceed topochemically at lower temperature. In this study, however, result of all experimental conditions were analyzed using this model for comparison.
4.2. Results of Analysis
Figures 1, 2 and 3 show the calculated reduction curves and observed data for comparison. Calculated reduction curves agreed with observed data very well above 1000°C. By contrast, calculated reduction curves in later reduction step of reduction did not agree with observed data below 900°C. This is attributed that the reduction reaction did not proceed topochemically and was retarded by dense iron layer reduced from H particle.
Therefore reduction rate of dual mineral phase sample above 1000°C can be analyzed based on the two interface unreacted core model developed in this study using chemical reaction rate constant of single mineral phase sample.
Figures 13 and 14 show temparature dependency of Deout and Dein. These coefficients represent the reduction rate where the calculated curves agree well with observed data. Namely, below 900°C, these coefficients represent the rate in the lower reduction degree. Effective diffusion coefficients of single mineral phase sample1) were also shown in Fig. 13 for comparison.


The values of Dein were about three orders of magnitude smaller than the values of Deout. This represents that diffusion resistance in the inner layer is extremely large and that two reaction interfaces of FeO/Fe and ‘FeO’/Fe progresses approximately at the same time. The positions of each interfaces were almost same at higher temperature. On the other hand, the judgment of whether each interface progresses at the same time is difficult, because the interfaces became not clear at the low temperature. The value of both Deout and Dein increased with increasing the amount of H. This trend represents that higher H content sample has advantage for reduction. At lower temperature (<900°C), the reduction curves in later step of reduction did not agree with observed. However it is considered that the result of analysis by using this model is proper because effective diffusion coefficient in outer layer is the same order as the coefficient of single mineral phase sample. Both Deout and Dein show the Arrhenius-type temperature dependency and are expressed following equations. However, at low temperature (<900°C), you must note that these value represent earlier reduction rate. However, at low temperature (<900°C), you must note that these value represent earlier reduction rate.
sample 1: Deout = exp (5.152 – 53.54 × 10³/RT)
Dein = exp (1.339 – 73.63 × 10³/RT)
sample 2: Deout = exp (2.772 – 34.95 × 10³/RT)
Dein = exp (0.4358 – 68.45 × 10³/RT)
sample 3: Deout = exp (2.704 – 40.97 × 10³/RT)
Dein = exp (–0.2034 – 66.79 × 10³/RT)
5. Conclusions
As a fundamental study for clarifying the reduction phenomena of iron ore sinter in a blast furnace, dual mineral phase samples of iron oxide and quaternary calcium ferrite (Cf) were prepared and its kinetic behavior at the final stage of reduction with CO gas was studied. Additionally reduction data were analyzed based on the two interface unreacted core model that developed in this study. Obtained results are summarized as follows.
(1) Reduction rate increased with increasing reduction temperature regardless of mixture ratio of mineral phase.
(2) Influence of mixture ratio of mineral phase were small and reduction rate were similar in every sample at 1000°C and above. While at 900°C and below, reduction rate increased with increaseng amount of Cf. The reason thought to be due to that the dense iron layer on surface of iron oxide particle interferes the reduction within the iron layer.
(3) Reduction reaction proceeded topochemically at higher temperature. On the other hand, reduction reaction did not proceed topochemically at lower temperature. Besides reduction reaction of rich Cf samples proceeded topochemically.
(4) Effective diffusion coefficient in outer layer Deout and in inner layer Dein were determined from analysis based on the two interface unreacted core model. The both values show the Arrhenius-type temperature dependency and are expressed as follows.
sample 1: Deout = exp (5.152 – 53.54 × 10³/RT)
Dein = exp (1.339 – 73.63 × 10³/RT)
sample 2: Deout = exp (2.772 – 34.95 × 10³/RT)
Dein = exp (0.4358 – 68.45 × 10³/RT)
sample 3: Deout = exp (2.704 – 40.97 × 10³/RT)
Dein = exp (–0.2034 – 66.79 × 10³/RT)
Reduction curves calculated by using the rate parameters obtained by the analysis agreed with observed data very well at 1000°C and above. Therefore reduction rate of dual minerals phase sample above 1000°C can be analyzed based on the two interface unreacted core model that developed in this study.
Notation
Dein : Effective diffusion coefficient in the inner layer (cm2/s)
Deout : Effective diffusion coefficient in the outer layer (cm2/s)
doT : Total concentration of reducible oxygen in the sample (g-atom/cm3)
do(s) : Concentration of reducible oxygen in the oxide s (g-atom/cm3)
FT : Overall reduction degree of sample (–)
F(s) : Reduction degree of oxide s (–)
K(s) : Equilibrium constant for reduction reaction of oxide s (–)
kc(s) : Chemical reaction rate constant of oxide s (cm/s)
kc(s)° : Chemical reaction rate constant of oxide s in single mineral phase sample by one interface unreacted core model (cm/s)
kf : Mass transfer coefficient in the gas film considered the resistance due to the rate of gas flow (cm/s)
n
˙
: Overall reduction rate of sample (mol/s)
n
˙
F
: Mass transfer rate in the gas film (mol/s)
n
˙
I
(t)
: Chemical reaction rate at the reaction interface from s to t (mol/s)
n
˙
S
(t)
: Diffusion rate at the layer t (mol/s)
P0CO : Partial pressure of CO at the surface of sample (atm)
PbCO : Partial pressure of CO in the bulk gas phase (atm)
P(t)CO : Partial pressure of CO at the reaction interface from s to t (atm)
P(t)CO,e : Equilibrium partial pressure of CO for reaction from s to t (atm)
R : Gas constant (cm3·atm/(mol·K))
RF : Mass transfer resistance in the gas film (s·atm/mol)
RI(t) : Chemical reaction resistance at the reaction interface for reaction from s to t (s·atm/mol)
RS(t) : Mass transfer resistance in the layer t (s·atm/mol)
r0 : Sample radius (cm)
T : Temperature (K)
Xi(t) : Effective interface radius for reaction from s to t (cm)
Greek
ϕ(s) : Existence ratio of oxides (–)
λa, λb : Coefficients in two interface unreacted core model (–)
θ : Time (s)
Ψs(t) : Reducible oxygen ratio of reaction from s to t (–)
References
- 1) D. Noguchi, K. Ohno, T. Maeda, K. Nishioka and M. Shimizu: Tetsu-to-Hagané, 97 (2011), 548.
- 2) T. Usui, M. Naito, T. Murayama and Z. Morita: Tetsu-to-Hagané, 80 (1994), 431.
- 3) T. Murayama, Y. Ono and Y. Kawai: Tetsu-to-Hagané, 63 (1977), 1229.
- 4) R. H. Spitzer, F. S. Manning and W. O. Philbroo: Trans. Metall. Soc. AIME, 236 (1966), 1715.
- 5) W. S. Chung, T. Murayama and Y. Ono: J. Jpn. Inst. Met., 51 (1987), 659.
- 6) T. Maeda and Y. Ono: Tetsu-to-Hagané, 75 (1989), 416.
- 7) T. Maeda, S. Masumoto and Y. Ono: Technol. Rep. Kyushu Univ., 62 (1989), 697.
- 8) T. Maeda and Y. Ono: Tetsu-to-Hagané, 80 (1994), 451.
- 9) T. Murayama, Y. Ono and C. Kamijo: CAMP-ISIJ, 2 (1989), 949.
- 10) C. Kamijo, T. Murayama and Y. Ono: CAMP-ISIJ, 3 (1990), 976.